425 State Highway 34 SW · Italy, TX
Flood risk 1/10 · Minimal
- FEMA flood zone
- X (unshaded)
- Chance of flooding over 30 yrs
- 0.0%
- Est. flood insurance / yr
- $507 – $1,088
Fire risk 5/10 · Moderate
- Est. fire insurance / yr
- $1,222 – $2,270
Heat risk 7/10 · Major
- Hot days now (above 110°F)
- 7 days/yr
- Hot days in 30 yrs
- 24 days/yr
Wind risk 6/10 · Moderate
- Chance of severe wind over 30 yrs
- 27.0%
Air-quality risk 2/10 · Minimal
- Unhealthy air days now
- 1 days/yr
- Unhealthy air days in 30 yrs
- 1 days/yr
Risk factors via First Street. Map © Google.
Why this score? — see what drove the B+ grade
The composite is a weighted blend of 9 inputs, each scored 0–100. Each bar is that input's sub-score; the figure is the points it added to the 100-point composite (weight × sub-score).
- Cash flow +30.0/30.0
- 1% rule +10.0/10.0
- DSCR +10.0/10.0
- Appreciation +10.0/10.0
- ARV discount +7.5/15.0
- Livability +3.7/5.0
- Schools +2.9/10.0
- Rent growth +2.5/5.0
- Condition / age +2.5/5.0
$45,000
🖨 Deal sheet 📄 Offer letter ✓ Due diligence
Listing remarks
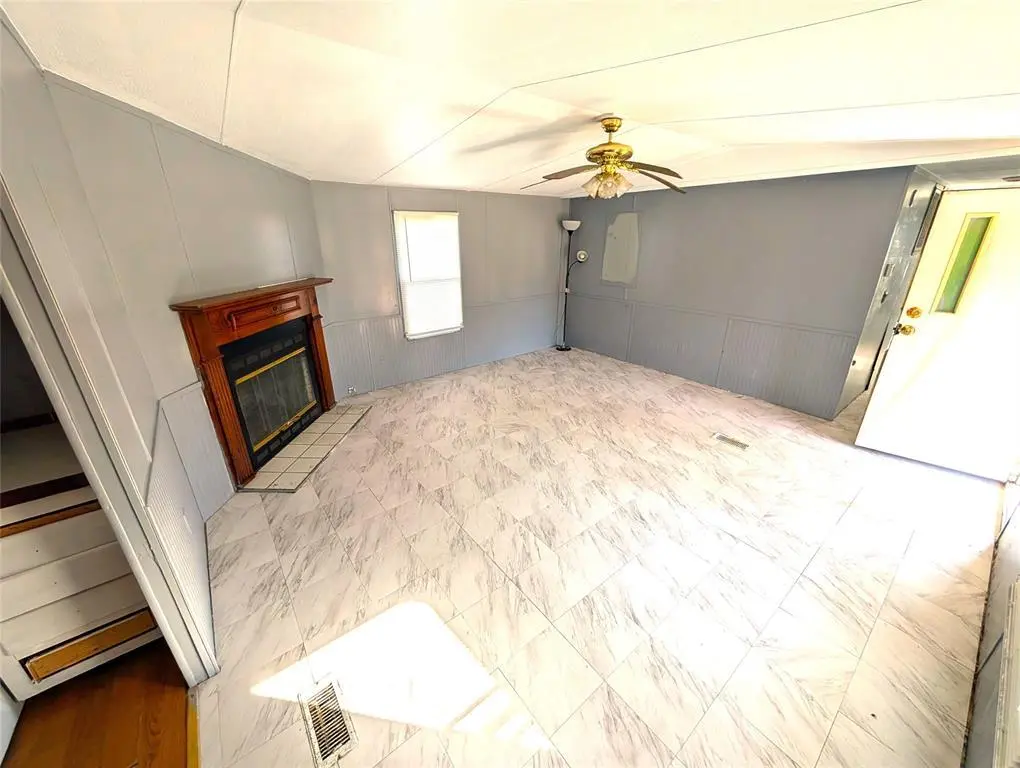
Newly Renovated Single wide mobile home just a few blocks from downtown Italy Texas. Only 10 minutes from Waxahachie. Home features . 25 acre lot, concrete driveway. Home inside has all new flooring and freshly painted. It is ready to move in. Open floorplan with built in fireplace. Central heat and AC. City water and sewer. Owner will finance the mobile home. Land is not for sale and will be leased to buyer. Some repairs are needed on the outside. Owner is ready to negotiate. If you are handy, this is a deal for you. Owner is a real estate agent in Texas.
Key facts
- New flooring
- City water and sewer
- Built in fireplace
Tags
Property features AI
Finance
- Other: Property type: Residential mobile home; Listing status: Active; Possession at closing/funding
- Financial info: Owner will carry (listing terms); Lender: Kopf
- HOA & community: No association
Exterior
- Parking: Concrete driveway parking; No garage; No covered or carport spaces
- Utilities: City water; City sewer; Electricity available and connected
- Home design: Mobile home (single-story); One level
- Construction: Siding construction; Built in 2001
- Exterior features: Covered patio/deck; Deck; Front porch; Concrete driveway; Lot under 0.5 acre (about 0.25 acre)
Interior
- Kitchen: Dishwasher; Electric oven; Refrigerator; Pantry; Eat-in kitchen
- Bedrooms: Primary bedroom (15 x 12) on main level; Bedroom (15 x 10) on main level; Bedroom (12 x 10) on main level
- Flooring: Tile flooring
- Bathrooms: 2 full bathrooms
- Heating & cooling: Central heating (electric); Central air (electric)
- Interior features: Open floorplan; Eat-in kitchen; Pantry; Double vanity; Walk-in closet(s)
- Laundry & utility: Utility room; Full-size washer/dryer area; Washer hookup; Electric water heater
Neighborhood map
What this means for you Summary
Snapshot
- This is a 3-bed/2.0-bath manufactured listed at $45k.
Deal economics
- At list price, monthly cash flow is $796 ($10k/yr) — positive.
- The deal already cash-flows at list — no discount required.
- Meets the 1% rule at list price ($1k rent vs $45k).
- Recommended offer: $44k (1.5% below list) — sets the bar for market timing.
- Cap rate 27.5% vs local median 2.7% in Italy — top-decile yield for the area; either an underpriced asset or a hidden risk that comps aren't pricing in. Stress-test before assuming the spread holds.
Location & tenants
- Location reads 73/100 on livability (#224 in TX) — a middle-class / working-renter tenant base. Strengths: cost of living A+, housing A+, health & safety A+; Watch: employment D+, amenities F, commute F.
- Italy ISD (rural): math 30% / reading 37% proficiency, ranked #544 of 826 in TX (top 66%) — families likely to look elsewhere, expect single-tenant / working-renter base with shorter leases.
- Zoned schools: Stafford El (math 37% / reading 32%, grade F, #1,995 of 4,322 statewide, top 50%, 331 students, 70% FRL) — zoned schools average 70% FRL vs 53% district-wide (17 pts higher); higher-poverty schools than district average — tighter screening recommended.
- Market conditions: 35 active listings in the ZIP; 3 comparable units currently listed for rent nearby; rentals leasing fast (median 10d on market — plan ~1-2 weeks tenant-placement turnaround); 3,016 units permitted in Ellis County in 2024 (20 in 5+ unit buildings).
Forward outlook
- In year one you build about $5k of equity ($311 loan paydown + $4k appreciation (10.0% local appreciation)).
- Ellis County population projected at +36% by 2050 — long-run rental-demand tailwind backs the buy-and-hold thesis.
- At projected returns (10.0% appreciation + 3.0% rent growth), your $13k cash investment doubles in ~1 year — after that, you're playing with house money.
- By year 7, paydown + projected appreciation supports a ~$35k cash-out refi (75% LTV) — recoverable capital for the next deal without selling this one.
Negotiation context
- It's been on market 23 days — a 2% lower offer ($44k) is reasonable based on typical stale-listing flexibility.
Risks & watch-outs
- Climate carrying-cost: major wind risk, 27% chance of damaging wind over 30y; moderate wildfire risk; extreme-heat days projected 7→24/yr by 2055 (HVAC capex compounding) — expect insurance premiums to compound above CPI over the hold.
Questions for the listing agent
- Is there a deadline driving the sale (1031 exchange, divorce, estate, relocation)? That informs how much negotiation room exists.
- Schools are D-rated, which usually means shorter tenancies and higher turnover. Who's the typical renter profile here, and what's been the actual vacancy rate?
- What's the average days-on-market for RENTAL listings here right now (not sales)? A rising rental-DOM trend means longer vacancies and softer asking-rent achievability than the comps imply.
- What's the recent tenant-quality profile in this submarket — average credit score on applications, eviction rate, late-payment / NSF rate, and stable-employment percentage? A property-management company in the area should have these aggregated.
- How much new for-sale + rental construction is in the pipeline within 1–3 miles? Heavy new supply typically softens prices + rents 12–24 months out; constrained supply supports both.
Investment metrics
- 1% rule
- 3.07% ✓
- Cap rate
- 27.51%
- Cash-on-cash
- 75.76%
- DSCR
- 4.37
- GRM
- 2.7
CMA / ARV
No comps found within radius.
Projected returns pro-forma
10.0% appreciation · 3.0% rent growth · sell at horizon
- IRR
- 86.1%
- Equity multiple
- 6.97×
- Total profit
- $75,186
- Equity at exit
- $40,540
- IRR
- 80.7%
- Equity multiple
- 15.41×
- Total profit
- $181,588
- Equity at exit
- $87,425
Cash invested: $12,600 (down + closing). Projections, not guarantees.
Landlord ↔ Tenant lean methodology
- Overall (STATE)
- 87 Strongly Landlord-Friendly
- State Texas
- 87 Strongly Landlord-Friendly · R+5
- County
- — inherits STATE
- City
- — inherits STATE
ZIP-level market 76651
- Home prices YoY
- 11.3%
- Active inventory
- 35
- Price-to-rent
- 2.7×
Monthly cashflow live
- Estimated rent
- $1,381 medium interval (Pro) →
- Mortgage (P&I)
- −$236
- Tax from tax record
- −$41 /mo · $491/yr
- Insurance
- −$19
- HOA
- −$0
- Vacancy / Maint / Mgmt
- −$290
- Net cashflow
- $796
Break-even live
UW: 25.0% down · 7.5% · 30yr · 1.5% tax · 5.0% vac · 8.0% maint · 8.0% mgmt
Financing live
Cash to close
- Down payment
- $11,250
- Closing costs
- $1,350
- Reserves months
- —
- Total cash needed
- —
Loan-product check · same deal, 3 products live
Conventional
25% down · 7.5% · 30yr
- Down + closing
- —
- Monthly P&I
- —
- Monthly cashflow
- —
- DSCR
- —
- Eligible?
- —
Personal DTI + credit; lowest rate.
DSCR
20% down · 8.5% · 30yr
- Down + closing
- —
- Monthly P&I
- —
- Monthly cashflow
- —
- DSCR
- —
- Eligible?
- —
No personal income docs; deal must DSCR.
Hard money
10% down · 12.0% · 12mo
- Down + closing
- —
- Monthly P&I
- —
- Monthly cashflow
- —
- DSCR
- —
- Eligible?
- —
Short-term bridge; refi at stabilization.
Rent comps 3 comps
| Address | Beds | Baths | Sqft | Rent | $/sqft | DOM | Units | Dist |
|---|---|---|---|---|---|---|---|---|
| 472 Clark St Unit 472 Italy, TX | 3.0 | 2.0 | 1055 | $1,450 | $1.37 | 10d | 1 | 0.63mi |
| 462 Derrs Chapel Rd Italy, TX | 2.0 | 2.0 | 963 | $1,300 | $1.35 | 1d | 1 | 1.35mi |
| 462 Derrs Chapel Rd Italy, TX | 2.0 | 2.0 | 963 | $1,300 | $1.35 | 15d | 1 | 1.35mi |
Listing history 14 events
-
2026-06-18days on market $45,000 Active 23 DOM
-
2026-06-17days on market $45,000 Active 22 DOM
-
2026-06-16days on market $45,000 Active 21 DOM
-
2026-06-15days on market $45,000 Active 20 DOM
-
2026-06-13days on market $45,000 Active 18 DOM
-
2026-06-09days on market $45,000 Active 14 DOM
-
2026-06-08days on market $45,000 Active 13 DOM
-
2026-06-07days on market $45,000 Active 12 DOM
-
2026-06-04days on market $45,000 Active 9 DOM
-
2026-06-03days on market $45,000 Active 8 DOM
-
2026-06-02days on market $45,000 Active 7 DOM
-
2026-06-01days on market $45,000 Active 6 DOM
-
2026-05-31days on market $45,000 Active 5 DOM
-
2026-05-26$45,000 Active
ⓘ Source: listings_history table (triggers on properties + properties_extension) + one-shot
backfill from property_details.listing_events for pre-trigger history.
Tax reassessment forecast TX · Resets to sale price
- Current annual tax
- $491 · $41/mo
- Projected year-2 tax
- $824 · $69/mo
- Expected delta
- +$333/yr (+$28/mo · 67.8%)
ⓘ Screening estimate from a state-policy table — verify with the county assessor before closing.
Climate risk First Street
- Flood 1/10 Low FEMA zone X (unshaded) · 0% chance over 30 yrs
- Wildfire 5/10 Major
- Heat 7/10 Severe 7 d/yr ≥110°F today · 24 d/yr by 30 yrs out
- Wind 6/10 Major 27% chance of damaging wind over 30 yrs
- Air quality 2/10 Low 1 unhealthy d/yr today · 1 by 30 yrs out
Nearby sold comps map
Loading sold comps map…
Walkable amenities ~0.75 mi
Loading nearby amenities…
Taxation est. · year 1
- Rental income
- $16,574
- − Mortgage interest
- −$2,521
- − Property taxes
- −$491
- − Insurance
- −$225
- − Repairs & maintenance
- −$1,326
- − Management
- −$1,326
- − Depreciation
- −$1,309
- Taxable income
- $9,377
- Est. tax owed @ 24.0%
- −$2,250
- After-tax cash flow
- $7,296/yr
For passive investors: Depreciation is non-cash, so a rental often shows a tax loss while cash-flowing — sheltering income. Rental losses are passive: they offset passive income freely, and up to $25,000/yr can offset ordinary (W-2) income if you actively participate and your MAGI is under $100k (phasing out to $0 by $150k); unused losses carry forward. On sale, claimed depreciation is recaptured at up to 25%, and gains may owe capital-gains tax (a 1031 exchange can defer both). Figures are a year-1 estimate at your 24.0% rate — not tax advice; consult a CPA.
Schools (NCES district)
- District
- Italy ISD
- NCES district ID
- 4824450
- Math proficiency
- 30% ▼ -11.00%
- Reading proficiency
- 37% ▼ -5.00%
- Median HH income
- $47,650
- Composite
- 28.86/100
- National rank
- #6644
- State rank
- #544 of 826 in TX
Livability — Italy
- Score
- 73/100
- State rank
- #224
- US rank
- #5516
Category grades
Schools grade is shown separately in the Schools card above.
Census & demographics
- Census place
- Italy, TX
- Population (ZIP)
- 4,071
Population outlook (Ellis County) Hauer SSP2
- Today (2025)
- 194,556 people
- By 2030
- 209,679 · +7.8%
- By 2040
- 238,837 · +22.8%
- By 2050
- 265,451 · +36.4%
- By 2075
- 326,571 · +67.9%
- By 2100
- 362,156 · +86.1%
Race, ethnicity, and origin ACS 2023
- Neighborhood character
- Majority White (64%)
- Race & ethnicity
- White 64% Hispanic / Latino 19% Black 14% Two or more races 7%
- Hispanic origin (detail)
- Mexican 17%
- Common ancestry
- Slovak 2% Serbian 1% Romanian 1%
- Foreign-born
- 3% · Canada
- Languages at home
- 89% English-only · Spanish 10%
Political lean MEDSL · Ellis
- 2024 margin
- Solid R (+31.1) · D 34.0% · R 65.1%
- 2008→2024 swing
- +11.2pp toward D · 2008: -42.2pp · 2024: -31.1pp
- All cycles
- 2024: R+31.1 2020: R+34.1 2016: R+45.4 2012: R+47.5 2008: R+42.2
Not yet ingested
- Civics
- —
Market trends
- HPI YoY
- ▲ 32.46%
- Current HPI
- 319.195
- Rent YoY
- —
- Metro
- —
- State GDP YoY
- ▲ 3.95%
- F500 in state
- 110
Industry mix (Fortune 500 HQ in TX)
| Industry | F500 HQs | Revenue |
|---|---|---|
| Energy | 16 | $1,198B |
|
||
| Technology | 5 | $198B |
|
||
| Engineering / Construction | 4 | $72B |
|
||
| Energy Services | 3 | $60B |
|
||
| Utilities | 3 | $41B |
|
||
| Healthcare | 2 | $330B |
|
||
Price history
1 event — show timeline
- 2026-05-26 Listed $45,000 NTREIS
Property tax history
-0.8%/yrLatest (2025): $491 · -19.7% YoY. Source: county tax records.
Cash-flow waterfall
monthlySold comps — $/sqft
last 12 mo · ≤1 miLoading sold comps…