 🏷️ Likely Rental
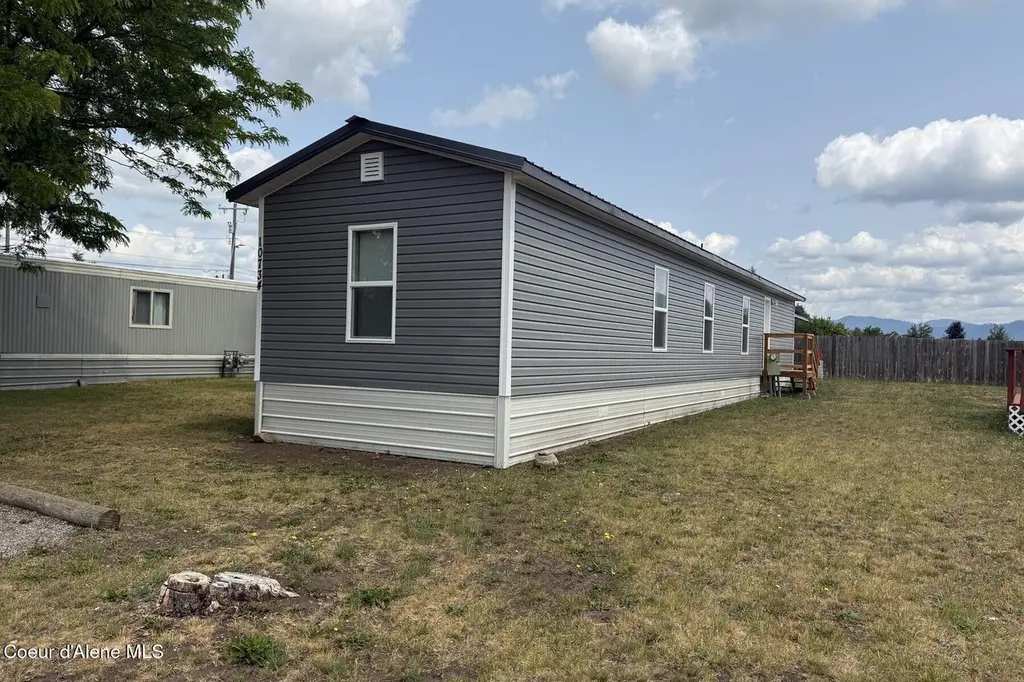
10734 N Benoit St · Hayden, ID
Flood risk 1/10 · Minimal
- FEMA flood zone
- X (unshaded)
- Chance of flooding over 30 yrs
- 0.0%
- Est. flood insurance / yr
- $507 – $1,088
Fire risk 5/10 · Moderate
- Est. fire insurance / yr
- $584 – $1,086
Heat risk 2/10 · Minimal
- Hot days now (above 92°F)
- 7 days/yr
- Hot days in 30 yrs
- 14 days/yr
Wind risk 1/10 · Minimal
- Chance of severe wind over 30 yrs
- —
Air-quality risk 9/10 · Severe
- Unhealthy air days now
- 14 days/yr
- Unhealthy air days in 30 yrs
- 16 days/yr
Risk factors via First Street. Map © Google.
Why this score? — see what drove the B grade
The composite is a weighted blend of 9 inputs, each scored 0–100. Each bar is that input's sub-score; the figure is the points it added to the 100-point composite (weight × sub-score).
- Cash flow +30.0/30.0
- 1% rule +10.0/10.0
- DSCR +10.0/10.0
- ARV discount +7.5/15.0
- Schools +4.4/10.0
- Condition / age +4.0/5.0
- Livability +3.2/5.0
- Rent growth +2.8/5.0
- Appreciation +0.0/10.0
$114,900
🖨 Deal sheet (PDF) 📄 Offer letter ✓ Due diligence
Listing remarks
Gorgeously updated and affordable singlewide home in Hayden! This home feels brand new inside and out, featuring new siding, a durable metal roof, and beautiful new front and back decks. Inside, you'll find a freshly updated kitchen and bathroom, along with stylish new LVP flooring throughout. Nestled in a well-maintained neighborhood on a quiet cul-de-sac, this property offers both comfort and tranquility. Relax on the covered front porch and enjoy the shade while overlooking the spacious yard. With a low space rent of $485/month, this home is truly move-in ready and waiting for its new owner. Easy to show! Additional details: Park deposit is $750, and the park application fee is $95.
Key facts
- Metal roof
- New siding
- Updated kitchen
Tags
Property features AI
Finance
- Other:
- Financial info:
- HOA & community:
Exterior
- Parking:
- Security:
- Utilities: Public water; Shared septic
- Home design: Manufactured home; Metal roof; Vinyl siding
- Construction: Block foundation
- Exterior features: Covered deck; Lawn; Partial fencing; Paved road access; Private maintained road; Open, level lot with southern exposure in a cul-de-sac
Interior
- Kitchen: Electric range; Refrigerator; Dishwasher
- Bedrooms: 3 main-level bedrooms
- Flooring: LVP (luxury vinyl plank)
- Bathrooms: 1 main-level bathroom
- Heating & cooling: Natural gas forced-air furnace
- Interior features: Washer hookup; Crawl space (no finished basement)
- Laundry & utility: Electric dryer hookup
Neighborhood map
What this means for you Summary
Snapshot
- This is a 3-bed/1.0-bath single-family listed at $115k. Condition is rated good.
Deal economics
- At list price, monthly cash flow is $951 ($11k/yr) — positive.
- The deal already cash-flows at list — no discount required.
- Meets the 1% rule at list price ($2k rent vs $115k).
- Recommended offer: $105k (9.0% below list) — sets the bar for market timing.
- Cap rate 16.2% vs local median 2.2% in Hayden — top-decile yield for the area; either an underpriced asset or a hidden risk that comps aren't pricing in. Stress-test before assuming the spread holds.
Location & tenants
- Location reads 64/100 on livability (#150 in ID) — a middle-class / working-renter tenant base. Strengths: crime A+, housing A+; Watch: amenities F, commute F, health & safety F.
- Coeur D'Alene District (urban): math 44% / reading 60% proficiency, ranked #23 of 92 in ID (top 25%) — acceptable for families but not a draw, mixed tenant base, ~2y average lease.
- Zoned schools: Atlas Elementary School (math 51% / reading 58%, grade C, #106 of 357 statewide, top 33%, 438 students, 26% FRL); Canfield Middle School (math 51% / reading 72%, grade B+, #9 of 109 statewide, top 7%, 746 students, 22% FRL); Coeur D'Alene High School (math 47% / reading 80%, grade B-, #14 of 169 statewide, top 8%, 1,548 students, 15% FRL).
- Market conditions: Rents rising (+1.2%/yr); 390 active listings in the ZIP; solid renter incomes; 1,606 units permitted in Kootenai County in 2024 (154 in 5+ unit buildings).
Forward outlook
- Local home prices are declining (-3.0%/yr); year-one equity from $794 of loan paydown is wiped out by about $3k of value loss. Plan a longer hold.
- Kootenai County population projected at +33% by 2050 — long-run rental-demand tailwind backs the buy-and-hold thesis.
- At projected returns (-3.0% appreciation + 1.2% rent growth), your $32k cash investment doubles in ~4 years — after that, you're playing with house money.
Negotiation context
- It's been on market 94 days — a 9% lower offer ($105k) is reasonable based on typical stale-listing flexibility.
- 3 sale attempts with the ask held roughly flat each time — persistent listings suggest the price (not the market) is what's stuck; bring a comps-based counter.
Risks & watch-outs
- Climate carrying-cost: moderate wildfire risk — expect insurance premiums to compound above CPI over the hold.
Questions for the listing agent
- It's been on market 94 days. Have you received any prior offers? Is the seller open to a 9% concession, seller financing, or rate buy-down credit?
- Why hasn't it sold? Are there any deal-killer items the seller is aware of (foundation, flood, title, zoning, code violations)?
- Is there a deadline driving the sale (1031 exchange, divorce, estate, relocation)? That informs how much negotiation room exists.
- Schools are D-rated, which usually means shorter tenancies and higher turnover. Who's the typical renter profile here, and what's been the actual vacancy rate?
- What's the average days-on-market for RENTAL listings here right now (not sales)? A rising rental-DOM trend means longer vacancies and softer asking-rent achievability than the comps imply.
- What's the recent tenant-quality profile in this submarket — average credit score on applications, eviction rate, late-payment / NSF rate, and stable-employment percentage? A property-management company in the area should have these aggregated.
- How much new for-sale + rental construction is in the pipeline within 1–3 miles? Heavy new supply typically softens prices + rents 12–24 months out; constrained supply supports both.
Investment metrics
- 1% rule
- 1.92% ✓
- Cap rate
- 16.23%
- Cash-on-cash
- 35.48%
- DSCR
- 2.58
- GRM
- 4.3
CMA / ARV
- ARV (on-the-fly)
- $314,028
- Comps found
- 7
Show comp detail 7 sales within ~0.75 mi
| Address | Dist | Beds/Ba | Sqft | Sold | Price | $/sf | Match |
|---|---|---|---|---|---|---|---|
| 10660 N Benoit St | 0.03mi | 2/2.0 (-1) | 924 (+8%) | 4mo | $89,950 | $97 | 73 |
| 637 W Texas Ave | 0.39mi | 2/1.0 (-1) | 868 (+1%) | 17mo | $35,000 | $40 | 61 |
| 11221 N Crusader St | 0.30mi | 2/1.0 (-1) | 792 (-8%) | 10mo | $359,900 | $454 | 60 |
| 653 W Wyoming Ave | 0.40mi | 2/2.0 (-1) | 924 (+8%) | 1mo | $40,000 | $43 | 58 |
| 10418 N Camp Ct | 0.43mi | 2/1.0 (-1) | 936 (+9%) | 4mo | $360,000 | $385 | 57 |
| 10545 N Camp Ct | 0.36mi | 2/1.0 (-1) | 954 (+11%) | 4mo | $365,000 | $383 | 56 |
| 861 W Kyler Ave | 0.56mi | 2/1.0 (-1) | 954 (+11%) | 22mo | $349,000 | $366 | 32 |
Match score weights: distance 35% · size 25% · config 20% · recency 20%. Top-matched comps best support the ARV.
Projected returns pro-forma
-3.0% appreciation · 1.16% rent growth · sell at horizon
- IRR
- 29.0%
- Equity multiple
- 2.18×
- Total profit
- $37,986
- Equity at exit
- $17,132
- IRR
- 35.3%
- Equity multiple
- 3.96×
- Total profit
- $95,345
- Equity at exit
- $9,934
Cash invested: $32,172 (down + closing). Projections, not guarantees.
Landlord ↔ Tenant lean methodology
- Overall (STATE)
- 91 Strongly Landlord-Friendly
- State Idaho
- 91 Strongly Landlord-Friendly · R+18
- County
- — inherits STATE
- City
- — inherits STATE
ZIP-level market 83835
- Rents YoY
- 1.2%
- Active inventory
- 390
- Price-to-rent
- 4.3×
Monthly cashflow live
- Estimated rent
- $2,209 medium interval (Pro) →
- Mortgage (P&I)
- −$603
- Tax est. 1.5%
- −$144 /mo · $1,724/yr
- Insurance
- −$48
- HOA
- −$0
- Vacancy / Maint / Mgmt
- −$464
- Net cashflow
- $951
Break-even live
Sensitivity live
| Price | -10% $1,031 | -5% $991 | +0% $951 | +5% $912 | +10% $872 |
|---|---|---|---|---|---|
| Rent | -10% $777 | -5% $864 | +0% $951 | +5% $1,039 | +10% $1,126 |
| Rate | -1.0pp $1,009 | -0.5pp $981 | base $951 | +0.5pp $922 | +1.0pp $891 |
UW: 25.0% down · 7.5% · 30yr · 1.5% tax · 5.0% vac · 8.0% maint · 8.0% mgmt
Financing live
Cash to close
- Down payment
- $28,725
- Closing costs
- $3,447
- Reserves months
- —
- Total cash needed
- —
Loan-product check · same deal, 3 products live
Conventional
25% down · 7.5% · 30yr
- Down + closing
- —
- Monthly P&I
- —
- Monthly cashflow
- —
- DSCR
- —
- Eligible?
- —
Personal DTI + credit; lowest rate.
DSCR
20% down · 8.5% · 30yr
- Down + closing
- —
- Monthly P&I
- —
- Monthly cashflow
- —
- DSCR
- —
- Eligible?
- —
No personal income docs; deal must DSCR.
Hard money
10% down · 12.0% · 12mo
- Down + closing
- —
- Monthly P&I
- —
- Monthly cashflow
- —
- DSCR
- —
- Eligible?
- —
Short-term bridge; refi at stabilization.
Listing history 24 events
-
2026-06-21days on market $114,900 Active 94 DOM
-
2026-06-19days on market $114,900 Active 92 DOM
-
2026-06-18days on market $114,900 Active 91 DOM
-
2026-06-17days on market $114,900 Active 90 DOM
-
2026-06-16days on market $114,900 Active 89 DOM
-
2026-06-15days on market $114,900 Active 88 DOM
-
2026-06-14days on market $114,900 Active 86 DOM
-
2026-06-13days on market $114,900 Active 85 DOM
-
2026-06-10days on market $114,900 Active 83 DOM
-
2026-06-09days on market $114,900 Active 82 DOM
-
2026-06-08days on market $114,900 Active 81 DOM
-
2026-06-07days on market $114,900 Active 80 DOM
-
2026-06-03days on market $114,900 Active 76 DOM
-
2026-06-02days on market $114,900 Active 75 DOM
-
2026-06-01days on market $114,900 Active 74 DOM
-
2026-05-31days on market $114,900 Active 73 DOM
-
2026-05-30days on market $114,900 Active 72 DOM
-
2026-03-19$114,900 Active
-
2026-02-04status Active
-
2026-01-28status Pending
-
2025-11-21price $114,900
-
2025-10-10price $119,000
-
2025-08-21price $121,000
-
2025-06-24$124,900 Active
ⓘ Source: listings_history table (triggers on properties + properties_extension) + one-shot
backfill from property_details.listing_events for pre-trigger history.
Climate risk First Street
- Flood 1/10 Low FEMA zone X (unshaded) · 0% chance over 30 yrs
- Wildfire 5/10 Major
- Heat 2/10 Low 7 d/yr ≥92°F today · 14 d/yr by 30 yrs out
- Wind 1/10 Low
- Air quality 9/10 Extreme 14 unhealthy d/yr today · 16 by 30 yrs out
Nearby sold comps map
Loading sold comps map…
Walkable amenities ~0.75 mi
Loading nearby amenities…
Taxation est. · year 1
- Rental income
- $26,511
- − Mortgage interest
- −$6,436
- − Property taxes
- −$1,724
- − Insurance
- −$574
- − Repairs & maintenance
- −$2,121
- − Management
- −$2,121
- − Depreciation
- −$3,343
- Taxable income
- $10,193
- Est. tax owed @ 24.0%
- −$2,446
- After-tax cash flow
- $8,969/yr
For passive investors: Depreciation is non-cash, so a rental often shows a tax loss while cash-flowing — sheltering income. Rental losses are passive: they offset passive income freely, and up to $25,000/yr can offset ordinary (W-2) income if you actively participate and your MAGI is under $100k (phasing out to $0 by $150k); unused losses carry forward. On sale, claimed depreciation is recaptured at up to 25%, and gains may owe capital-gains tax (a 1031 exchange can defer both). Figures are a year-1 estimate at your 24.0% rate — not tax advice; consult a CPA.
Condition & rehab AI · 12 photos
This singlewide home is in excellent condition with recent updates, making it move-in ready and ideal for both resale and rental.
Value-add opportunities
- Both landscaping — enhances curb appeal and adds value
- Both painting — fresh paint can make a home more appealing
- Both landscaping — improves curb appeal and adds value
Renovation cost estimate screening
Value-add ROI direction
- Both landscaping — enhances curb appeal and adds value ↑
- Both painting — fresh paint can make a home more appealing ↑
- Both landscaping — improves curb appeal and adds value ↑
ⓘ Cost ranges are severity-bucket heuristics (US national rule-of-thumb). Get contractor quotes + a written scope before underwriting a rehab budget.
Schools (NCES district)
- District
- Coeur D'Alene District
- NCES district ID
- 1600780
- Math proficiency
- 44% ▼ -6.00%
- Reading proficiency
- 60% ▼ -2.00%
- Median HH income
- $47,652
- Composite
- 44.16/100
- National rank
- #2858
- State rank
- #23 of 92 in ID
Livability — Hayden
- Score
- 64/100
- State rank
- #150
- US rank
- #14103
Category grades
Schools grade is shown separately in the Schools card above.
Census & demographics
- Census place
- Hayden, ID
- County
- Kootenai County · 146,553 people
- City population
- 24,238
- Metro
- Coeur d'Alene, ID
- Population (ZIP)
- 24,238
- Household income
- $91,316
- Rent vs Own
- Severe rent burden
- 345.0
Population outlook (Kootenai County) Hauer SSP2
- Today (2025)
- 177,692 people
- By 2030
- 190,689 · +7.3%
- By 2040
- 214,704 · +20.8%
- By 2050
- 236,510 · +33.1%
- By 2075
- 285,984 · +60.9%
- By 2100
- 316,459 · +78.1%
Race, ethnicity, and origin ACS 2023
- Neighborhood character
- Predominantly White (91%)
- Race & ethnicity
- White 91% Two or more races 6% Hispanic / Latino 4%
- Common ancestry
- Portuguese 6% Italian 3% Slovak 3%
- Foreign-born
- 3% · Canada
- Languages at home
- 98% English-only · Spanish 1%
Political lean MEDSL · Kootenai
- 2024 margin
- Solid R (+51.9) · D 22.9% · R 74.8% · Other 2.2%
- 2008→2024 swing
- -25.6pp toward R · 2008: -26.3pp · 2024: -51.9pp
- All cycles
- 2024: R+51.9 2020: R+42.9 2016: R+42.5 2012: R+34.3 2008: R+26.3
Not yet ingested
- Civics
- —
Market trends
- HPI YoY
- ▼ -271.03%
- Current HPI
- 256.927
- Rent YoY
- ▲ 1.16%
- Metro
- Coeur d'Alene, ID
- State GDP YoY
- ▲ 4.51%
- F500 in state
- 6
Industry mix (Fortune 500 HQ in ID)
| Industry | F500 HQs | Revenue |
|---|---|---|
| Retail | 1 | $79B |
|
||
| Technology | 1 | $25B |
|
||
| Food / Agriculture | 1 | $6B |
|
||
Price history
-8.0% since first listed7 events — show timeline
- 2026-03-19 Listed $114,900 CDAMLS
- 2026-02-04 Relisted — CDAMLS
- 2026-01-28 Pending — CDAMLS
- 2025-11-21 Price Changed $114,900 CDAMLS
- 2025-10-10 Price Changed $119,000 CDAMLS
- 2025-08-21 Price Changed $121,000 CDAMLS
- 2025-06-24 Listed $124,900 CDAMLS
Cash-flow waterfall
monthlySold comps — $/sqft
last 12 mo · ≤1 miLoading sold comps…