 Triplex
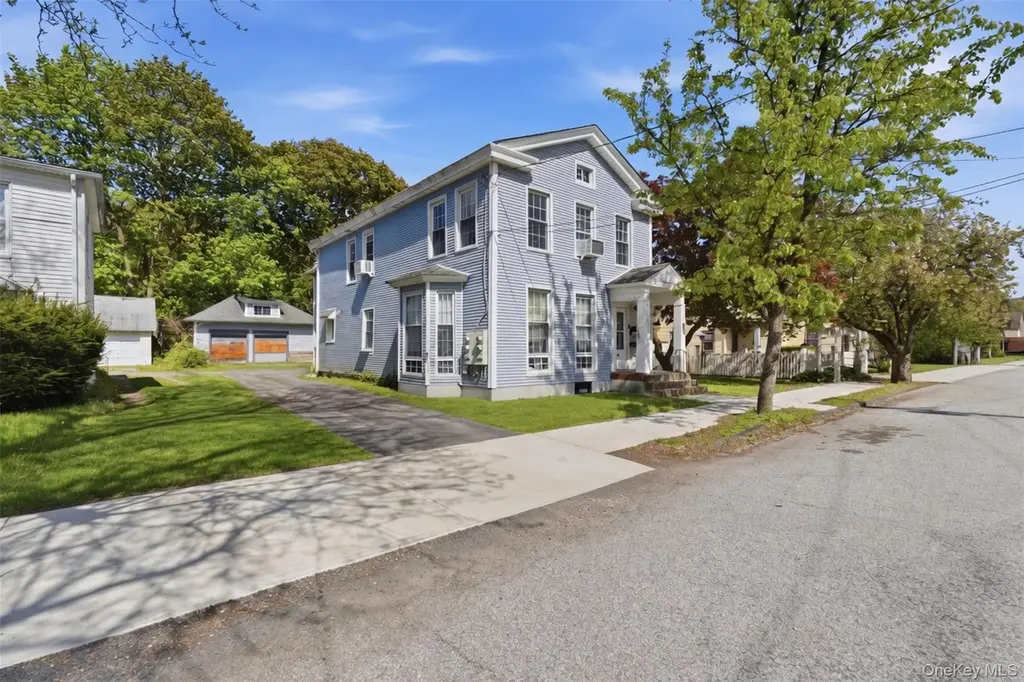
22 E Broome St · Port Jervis, NY
Flood risk 1/10 · Minimal
- FEMA flood zone
- X (unshaded)
- Chance of flooding over 30 yrs
- 0.0%
- Est. flood insurance / yr
- $473 – $860
Fire risk 3/10 · Minor
- Est. fire insurance / yr
- $691 – $1,283
Heat risk 5/10 · Moderate
- Hot days now (above 97°F)
- 8 days/yr
- Hot days in 30 yrs
- 18 days/yr
Wind risk 3/10 · Minor
- Chance of severe wind over 30 yrs
- 6.0%
Air-quality risk 2/10 · Minimal
- Unhealthy air days now
- 1 days/yr
- Unhealthy air days in 30 yrs
- 2 days/yr
Risk factors via First Street. Map © Google.
Why this score? — see what drove the B+ grade
The composite is a weighted blend of 9 inputs, each scored 0–100. Each bar is that input's sub-score; the figure is the points it added to the 100-point composite (weight × sub-score).
- Cash flow +30.0/30.0
- ARV discount +15.0/15.0
- 1% rule +10.0/10.0
- DSCR +10.0/10.0
- Schools +3.9/10.0
- Livability +3.5/5.0
- Rent growth +2.5/5.0
- Condition / age +2.5/5.0
- Appreciation +0.0/10.0
$419,900
🖨 Deal sheet 📄 Offer letter ✓ Due diligence
Multi-family units
County records classify this as Multi-Family (2-4 Unit). Listing-text estimate: 3 units. confirmed
Listing remarks
A/0 No Further showings at this time. PRICE REDUCED BY $40,000 - WAS $460,000 NOW $419,900 FOR QUICK "AS IS" FULL PRICE ONLY OFFERS! HUGE INVESTMENT OPPORTUNITY - EARN 8.3% ROI AFTER ALL EXPENSES $35,000 NET ANNUAL INCOME. Gross Income $55,800!! This Triplex includes a newly restored huge Beautiful 2nd Floor 3BR - 2 Full Bathroom 1560 SF Apartment which we could rent for at least $2200 but have left vacant for new buyer convenience. Two first floor apartments fully rented out along with a Garage which is rented for $3,000 per year. Lots of off street parking and large back yard. Located in the very best residential neighborhood uptown and out of any flood zone. This is a remarkab
Key facts
- Newly restored
- Off street parking
- Large back yard
Tags
Property features AI
Exterior
- Parking: Driveway parking; Garage parking; Total parking for 6 vehicles; 2-car garage
- Utilities: Public sewer; Water connected; Natural gas connected; Electricity connected; Cable connected; Trash collection (public)
- Home design: Triplex; Estimated condition
- Construction: Frame construction; Partial unfinished basement; Crawl attic
- Exterior features: Back yard
Interior
- Kitchen: Eat-in kitchen(s)
- Bedrooms: Two 1-bedroom units; One 3-bedroom unit
- Bathrooms: Four full bathrooms
- Heating & cooling: Natural gas heating; No central cooling
- Interior features: First-floor bedroom; First-floor full bath; Eat-in kitchen; Entrance foyer; Formal dining; Original details; Covered porch; Deck
- Laundry & utility: Common area laundry
Neighborhood map
What this means for you Summary
Snapshot
- This is a 3 × 5-bed/4.0-bath units multifamily listed at $420k.
Deal economics
- At list price, monthly cash flow is $3k ($38k/yr) — positive. Per door: $1k/mo.
- The deal already cash-flows at list — no discount required.
- Meets the 1% rule at list price ($8k rent vs $420k).
- Recommended offer: $407k (3.0% below list) — sets the bar for market timing.
- Cap rate 15.2% vs local median 4.6% in Port Jervis — top-decile yield for the area; either an underpriced asset or a hidden risk that comps aren't pricing in. Stress-test before assuming the spread holds.
Location & tenants
- Location reads 69/100 on livability (#475 in NY) — a middle-class / working-renter tenant base. Strengths: health & safety A+, amenities B+, cost of living B+; Watch: housing C-, crime D+, employment F.
- Port Jervis City School District (rural): math 43% / reading 50% proficiency, ranked #451 of 590 in NY (top 76%) — families likely to look elsewhere, expect single-tenant / working-renter base with shorter leases.
- Zoned schools: Anna S Kuhl Elementary School (math 35% / reading 49%, grade F, #1,361 of 2,108 statewide, top 67%, 755 students, 63% FRL); Port Jervis Middle School (math 22% / reading 35%, grade F, #569 of 729 statewide, top 78%, 379 students, 59% FRL); Port Jervis Senior High School (math 87% / reading 95%, grade A+, #203 of 1,100 statewide, top 20%, 750 students, 55% FRL).
- Market conditions: 107 active listings in the ZIP; 1,746 units permitted in Orange County in 2024 (1,265 in 5+ unit buildings).
- At $7,582/mo this rent would consume 134% of the median local household income ($68k/yr) (locally 792% of renters already pay >50% of income on rent) — very limited rent-growth headroom before tenants either downsize or default.
Forward outlook
- Local home prices are declining (-3.0%/yr); year-one equity from $3k of loan paydown is wiped out by about $13k of value loss. Plan a longer hold.
- At projected returns (-3.0% appreciation + 3.0% rent growth), your $118k cash investment doubles in ~4 years — after that, you're playing with house money.
Negotiation context
- It's been on market 48 days — a 3% lower offer ($407k) is reasonable based on typical stale-listing flexibility.
- 3 sale attempts since 14y ago; this cycle's ask has dropped $40k (9%) from the opening price — seller is motivated, your offer sets the floor, not the list.
- Current owner paid $300k; 40% above their basis — modest negotiation headroom, anchor on the comps not their cost.
Risks & watch-outs
- Watch-outs: built in 1840 — expect roof / HVAC / electrical / plumbing capex.
- Climate carrying-cost: extreme-heat days projected 8→18/yr by 2055 (HVAC capex compounding) — expect insurance premiums to compound above CPI over the hold.
Questions for the listing agent
- It's been on market 48 days. Have you received any prior offers? Is the seller open to a 3% concession, seller financing, or rate buy-down credit?
- Can we see the unit-by-unit rent roll, current vacancy, and any below-market leases? What's the average tenancy length?
- What capital expenditures (roof, boiler, parking lot, exteriors) have been made in the last 5 years, and what's planned in the next 2?
- Built in 1840 — when were the roof, HVAC, electrical panel, plumbing, and water heater last replaced?
- Is there a deadline driving the sale (1031 exchange, divorce, estate, relocation)? That informs how much negotiation room exists.
- Crime grade is D in this area — have there been break-ins, vandalism, or insurance claims at this property in the last 3 years? What carrier currently insures it and at what premium?
- What's the average days-on-market for RENTAL listings here right now (not sales)? A rising rental-DOM trend means longer vacancies and softer asking-rent achievability than the comps imply.
- What's the recent tenant-quality profile in this submarket — average credit score on applications, eviction rate, late-payment / NSF rate, and stable-employment percentage? A property-management company in the area should have these aggregated.
- How much new apartment / multifamily construction is in the pipeline within 1–3 miles? Heavy new supply (>2% of stock underway) typically softens rents 12–24 months out; light construction supports rent growth.
Investment metrics
- 1% rule
- 1.81% ✓
- Cap rate
- 15.24%
- Cash-on-cash
- 31.94%
- DSCR
- 2.42
- GRM
- 4.6
CMA / ARV
- ARV (median comp)
- $652,340
- List price
- $419,900
- Delta
- -35.63%
- Verdict
- UNDERPRICED
- Comps
- 20 within 1.0 mi
Show comp detail 2 sales within ~0.75 mi
| Address | Dist | Beds/Ba | Sqft | Sold | Price | $/sf | Match |
|---|---|---|---|---|---|---|---|
| 20 E Broome St | 0.01mi | 5/3.0 | 3,174 (-9%) | 22mo | $350,000 | $110 | 62 |
| 51 Canal St | 0.34mi | 4/4.0 (-1) | 3,824 (+9%) | 22mo | $475,000 | $124 | 45 |
Match score weights: distance 35% · size 25% · config 20% · recency 20%. Top-matched comps best support the ARV.
Projected returns pro-forma
-3.0% appreciation · 3.0% rent growth · sell at horizon
- IRR
- 26.9%
- Equity multiple
- 2.12×
- Total profit
- $131,382
- Equity at exit
- $62,608
- IRR
- 34.5%
- Equity multiple
- 4.16×
- Total profit
- $371,441
- Equity at exit
- $36,305
Cash invested: $117,572 (down + closing). Projections, not guarantees.
Landlord ↔ Tenant lean methodology
- Overall (STATE)
- 15 Strongly Tenant-Friendly
- State New York
- 15 Strongly Tenant-Friendly · D+10
- County
- — inherits STATE
- City
- — inherits STATE
ZIP-level market 12771
- Home prices YoY
- -20.1%
- Active inventory
- 107
- Price-to-rent
- 13.8×
Monthly cashflow live
- Estimated rent
- $7,582 medium interval (Pro) →
- Mortgage (P&I)
- −$2,202
- Tax from tax record
- −$483 /mo · $5,797/yr
- Insurance
- −$175
- HOA
- −$0
- Vacancy / Maint / Mgmt
- −$1,592
- Net cashflow
- $3,130
Break-even live
3-unit breakdown (identical units grouped — click to expand)
| Units | Beds | Baths | Est. rent |
|---|---|---|---|
| 3× units | 5 | 4 | $7,581 |
| #1 | 5 | 4 | $2,527 |
| #2 | 5 | 4 | $2,527 |
| #3 | 5 | 4 | $2,527 |
| Total (3 units) | $7,582 | ||
UW: 25.0% down · 7.5% · 30yr · 1.5% tax · 5.0% vac · 8.0% maint · 8.0% mgmt
Financing live
Cash to close
- Down payment
- $104,975
- Closing costs
- $12,597
- Reserves months
- —
- Total cash needed
- —
Loan-product check · same deal, 3 products live
Conventional
25% down · 7.5% · 30yr
- Down + closing
- —
- Monthly P&I
- —
- Monthly cashflow
- —
- DSCR
- —
- Eligible?
- —
Personal DTI + credit; lowest rate.
DSCR
20% down · 8.5% · 30yr
- Down + closing
- —
- Monthly P&I
- —
- Monthly cashflow
- —
- DSCR
- —
- Eligible?
- —
No personal income docs; deal must DSCR.
Hard money
10% down · 12.0% · 12mo
- Down + closing
- —
- Monthly P&I
- —
- Monthly cashflow
- —
- DSCR
- —
- Eligible?
- —
Short-term bridge; refi at stabilization.
Listing history 24 events
-
2026-06-18days on market $419,900 Active 48 DOM
-
2026-06-17days on market $419,900 Active 47 DOM
-
2026-06-16days on market $419,900 Active 46 DOM
-
2026-06-15days on market $419,900 Active 45 DOM
-
2026-06-14days on market $419,900 Active 43 DOM
-
2026-06-13days on market $419,900 Active 42 DOM
-
2026-06-10days on market $419,900 Active 40 DOM
-
2026-06-09days on market $419,900 Active 39 DOM
-
2026-06-08days on market $419,900 Active 38 DOM
-
2026-06-07days on market $419,900 Active 37 DOM
-
2026-06-03days on market $419,900 Active 33 DOM
-
2026-06-02days on market $419,900 Active 32 DOM
-
2026-06-01days on market $419,900 Active 31 DOM
-
2026-05-31days on market $419,900 Active 30 DOM
-
2026-05-30days on market $419,900 Active 29 DOM
-
2026-05-01$460,000 Active 598-char remark
-
2024-10-07soldstatus $300,000
-
2015-11-13historical Temporarily off Market
-
2015-10-24Active
-
2012-12-31historical
-
2012-06-04
-
2005-02-07soldstatus $136,740
-
1989-12-29soldstatus $105,000
-
1987-09-18soldstatus $99,500
ⓘ Source: listings_history table (triggers on properties + properties_extension) + one-shot
backfill from property_details.listing_events for pre-trigger history.
Tax reassessment forecast NY · Partial reset (capped growth)
- Current annual tax
- $5,797 · $483/mo
- Projected year-2 tax
- $6,447 · $537/mo
- Expected delta
- +$650/yr (+$54/mo · 11.2%)
ⓘ Screening estimate from a state-policy table — verify with the county assessor before closing.
Climate risk First Street
- Flood 1/10 Low FEMA zone X (unshaded) · 0% chance over 30 yrs
- Wildfire 3/10 Moderate
- Heat 5/10 Major 8 d/yr ≥97°F today · 18 d/yr by 30 yrs out
- Wind 3/10 Moderate 6% chance of damaging wind over 30 yrs
- Air quality 2/10 Low 1 unhealthy d/yr today · 2 by 30 yrs out
Nearby sold comps map
Loading sold comps map…
Walkable amenities ~0.75 mi
Loading nearby amenities…
Taxation est. · year 1
- Rental income
- $90,984
- − Mortgage interest
- −$23,521
- − Property taxes
- −$5,797
- − Insurance
- −$2,100
- − Repairs & maintenance
- −$7,279
- − Management
- −$7,279
- − Depreciation
- −$12,215
- Taxable income
- $32,794
- Est. tax owed @ 24.0%
- −$7,871
- After-tax cash flow
- $29,686/yr
For passive investors: Depreciation is non-cash, so a rental often shows a tax loss while cash-flowing — sheltering income. Rental losses are passive: they offset passive income freely, and up to $25,000/yr can offset ordinary (W-2) income if you actively participate and your MAGI is under $100k (phasing out to $0 by $150k); unused losses carry forward. On sale, claimed depreciation is recaptured at up to 25%, and gains may owe capital-gains tax (a 1031 exchange can defer both). Figures are a year-1 estimate at your 24.0% rate — not tax advice; consult a CPA.
Schools (NCES district)
- District
- Port Jervis City School District
- NCES district ID
- 3623520
- Math proficiency
- 43% ▼ -7.00%
- Reading proficiency
- 50% ▲ 5.00%
- Median HH income
- $44,506
- Composite
- 39.33/100
- National rank
- #3984
- State rank
- #451 of 590 in NY
Livability — Port Jervis
- Score
- 69/100
- State rank
- #475
- US rank
- #8376
Category grades
Schools grade is shown separately in the Schools card above.
Census & demographics
- Census place
- Port Jervis, NY
- County
- Orange County · 267,004 people
- City population
- 14,049
- Metro
- Poughkeepsie-Newburgh-Middletown, NY
- Population (ZIP)
- 14,049
- Household income
- $68,136
- Rent vs Own
- Severe rent burden
- 792.0
Population outlook (Orange County) Hauer SSP2
- Today (2025)
- 379,830 people
- By 2030
- 378,955 · -0.2%
- By 2040
- 375,444 · -1.2%
- By 2050
- 369,311 · -2.8%
- By 2075
- 354,233 · -6.7%
- By 2100
- 318,150 · -16.2%
Race, ethnicity, and origin ACS 2023
- Neighborhood character
- Predominantly White (67%)
- Race & ethnicity
- White 67% Hispanic / Latino 18% Two or more races 11% Black 6% Asian 3% Native American 3%
- Hispanic origin (detail)
- Mexican 3% Puerto Rican 8% Dominican 2%
- Common ancestry
- Romanian 5% Iranian 4% Lithuanian 3%
- Foreign-born
- 10% · Canada, China, Jamaica
- Languages at home
- 84% English-only · Spanish 10% Other Indo-European 3% Chinese 2%
Political lean MEDSL · Orange
- 2024 margin
- Lean R (+8.4) · D 45.8% · R 54.2%
- 2008→2024 swing
- -12.5pp toward R · 2008: 4.1pp · 2024: -8.4pp
- All cycles
- 2024: R+8.4 2020: R+0.2 2016: R+6.5 2012: D+5.2 2008: D+4.1
Not yet ingested
- Civics
- —
Market trends
- HPI YoY
- ▼ -75.78%
- Current HPI
- 301.5132
- Rent YoY
- —
- Metro
- Poughkeepsie-Newburgh-Middletown, NY
- State GDP YoY
- ▲ 2.60%
- F500 in state
- 92
Industry mix (Fortune 500 HQ in NY)
| Industry | F500 HQs | Revenue |
|---|---|---|
| Financial Services | 10 | $950B |
|
||
| Consumer Goods | 9 | $162B |
|
||
| Insurance | 4 | $225B |
|
||
| Telecommunications | 2 | $144B |
|
||
| Pharmaceuticals | 2 | $112B |
|
||
| Media / Entertainment | 2 | $69B |
|
||
Price history
+322.0% since first listed10 events — show timeline
- 2026-05-28 Price Changed $419,900 OneKey® MLS as Distributed by MLS Grid
- 2026-05-01 Listed $460,000 OneKey® MLS as Distributed by MLS Grid
- 2024-10-07 Sold (Public Records) $300,000 Public Records
- 2015-11-13 Delisted — HGMLS
- 2015-10-24 Listed — HGMLS
- 2012-12-31 Delisted — HGMLS
- 2012-06-04 Listed — HGMLS
- 2005-02-07 Sold (Public Records) $136,740 Public Records
- 1989-12-29 Sold (Public Records) $105,000 Public Records
- 1987-09-18 Sold (Public Records) $99,500 Public Records
Property tax history
+0.2%/yrLatest (2025): $5,797 · +6.3% YoY. Source: county tax records.
Cash-flow waterfall
monthlySold comps — $/sqft
last 12 mo · ≤1 miLoading sold comps…