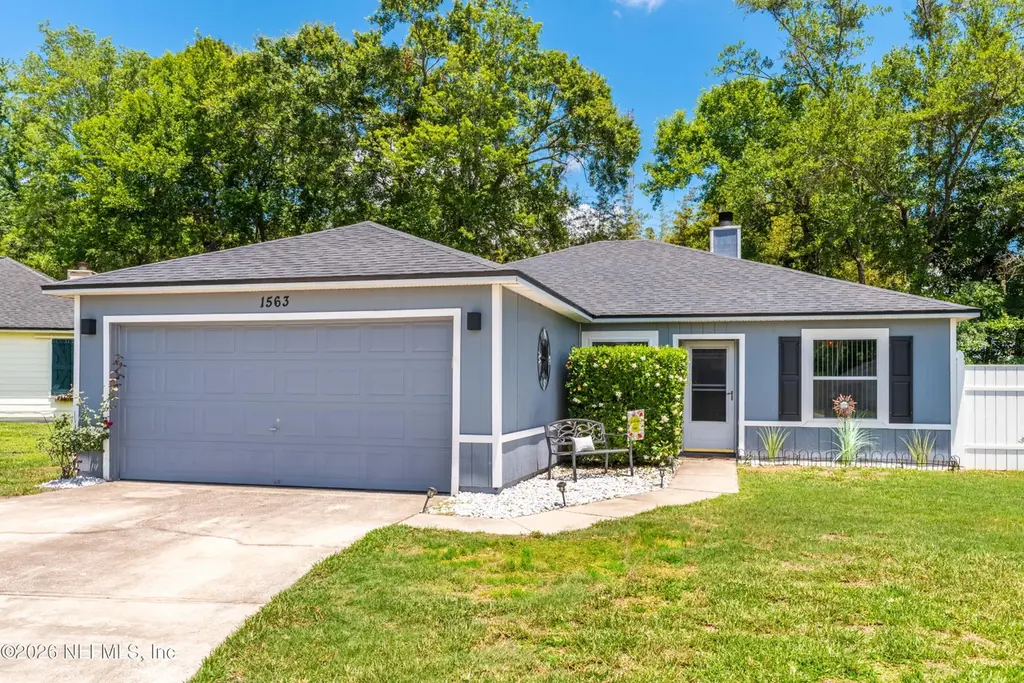
1563 Graduation Ln · Lakeside, FL
Flood risk 1/10 · Minimal
- FEMA flood zone
- X (unshaded)
- Chance of flooding over 30 yrs
- 0.0%
- Est. flood insurance / yr
- $507 – $1,088
Fire risk 4/10 · Minor
- Est. fire insurance / yr
- $947 – $1,759
Heat risk 9/10 · Severe
- Hot days now (above 107°F)
- 7 days/yr
- Hot days in 30 yrs
- 19 days/yr
Wind risk 9/10 · Severe
- Chance of severe wind over 30 yrs
- 99.0%
Air-quality risk 3/10 · Minor
- Unhealthy air days now
- 3 days/yr
- Unhealthy air days in 30 yrs
- 3 days/yr
Risk factors via First Street. Map © Google.
Why this score? — see what drove the D grade
The composite is a weighted blend of 9 inputs, each scored 0–100. Each bar is that input's sub-score; the figure is the points it added to the 100-point composite (weight × sub-score).
- ARV discount +12.1/15.0
- Cash flow +12.0/30.0
- Schools +5.1/10.0
- DSCR +3.6/10.0
- Livability +3.4/5.0
- Rent growth +3.3/5.0
- Condition / age +2.5/5.0
- 1% rule +2.4/10.0
- Appreciation +0.0/10.0
$255,000
🖨 Deal sheet 📄 Offer letter ✓ Due diligence
Listing remarks
Beautifully updated and exceptionally maintained, this move-in ready home in the established College Park community offers incredible value. Featuring 3 bedrooms, 2 bathrooms, and over 1,350 sq ft of living space, the home showcases numerous updates including brand new windows with lifetime warranty and Smart Green certification, fresh paint in the kitchen and spare bathroom, retiled kitchen, new LVP flooring installed in 2025, and a roof replaced in 2020. The HVAC received a new motor in 2024, and all 2020 GE appliances convey, along with a brand new washer and dryer. Additional upgrades include a 2023 garbage disposal and a fully fenced backyard perfect for entertaining, pets, or relaxing
Key facts
- 6,969 sq ft lot
- Garage
- Built 1997
Property features AI
Finance
- HOA & community: Not a senior community
Exterior
- Parking: Garage; 1-car garage
- Security: Smoke detector(s)
- Utilities: Public sewer; Water available; Electricity connected; Sewer connected; Cable available; Energy-efficient windows
- Home design: Single family residence; One level
- Construction: Stucco and wood siding exterior; Shingle roof
- Exterior features: Full fencing; Smoke detectors; Sidewalks (community)
Interior
- Kitchen: Convection oven; Electric oven; Gas oven; Gas range; Dishwasher; Microwave; Refrigerator
- Bedrooms: 3 bedrooms
- Bathrooms: 2 full bathrooms
- Heating & cooling: Central heating; Central air conditioning
- Interior features: Breakfast bar; Ceiling fans; Smart thermostat; Fireplace (1)
- Laundry & utility: Washer
Neighborhood map
What this means for you Summary
Snapshot
- This is a 3-bed/2.0-bath single-family listed at $255k.
Deal economics
- At list price, monthly cash flow is $-60 ($-715/yr) — negative.
- To cash-flow at today's rent, offer at most $244k (4.1% below list).
- To meet the 1% rule (rent ≥ 1% of price), the offer needs to be $189k (26.1% below list).
- Recommended offer: $189k (26.1% below list) — sets the bar for 1% rule.
- Cap rate 6.0% vs local median 4.7% in Lakeside — meaningfully above typical; check what's discounted (condition, days-on-market, listing class) to confirm the premium yield is real.
Location & tenants
- Location reads 68/100 on livability (#505 in FL) — a middle-class / working-renter tenant base. Strengths: cost of living A+, housing A+, crime B; Watch: amenities F, commute F, health & safety F.
- Clay (suburban): math 58% / reading 59% proficiency, ranked #14 of 73 in FL (top 19%) — acceptable for families but not a draw, mixed tenant base, ~2y average lease.
- Zoned schools: Middleburg Elementary School (math 65% / reading 61%, grade B, #582 of 2,144 statewide, top 28%, 559 students, 100% FRL); Wilkinson Junior High School (math 54% / reading 49%, grade C, #232 of 571 statewide, top 41%, 752 students, 100% FRL); Middleburg High School (math 41% / reading 52%, grade D-, #216 of 667 statewide, top 33%, 1,852 students, 47% FRL) — zoned schools average 82% FRL vs 35% district-wide (47 pts higher); higher-poverty schools than district average — tighter screening recommended.
- Market conditions: Rents rising (+3.4%/yr); 601 active listings in the ZIP; 24 comparable units currently listed for rent nearby; rentals at typical pace (median 20d on market — plan ~3-4 weeks tenant-placement turnaround); solid renter incomes; 1,876 units permitted in Clay County in 2024 (14 in 5+ unit buildings).
Forward outlook
- Local home prices are declining (-3.0%/yr); year-one equity from $2k of loan paydown is wiped out by about $8k of value loss. Plan a longer hold.
- Clay County population projected at +19% by 2050 — long-run rental-demand tailwind backs the buy-and-hold thesis.
Negotiation context
- Only 1 days on market — expect competitive offers; lowballing is unlikely to land.
- Current owner paid $37k; list at $255k implies a 597% gain — meaningful room to come down on a strong offer.
Risks & watch-outs
- Climate carrying-cost: severe wind risk, 99% chance of damaging wind over 30y; extreme-heat days projected 7→19/yr by 2055 (HVAC capex compounding) — expect insurance premiums to compound above CPI over the hold.
Questions for the listing agent
- What do current leases actually rent for vs. the listed asking? Can we see a recent rent roll and the last 12 months of T-12 income?
- Is there a deadline driving the sale (1031 exchange, divorce, estate, relocation)? That informs how much negotiation room exists.
- Schools are B-rated — typically a magnet for longer-tenancy family renters. What's the average tenant stay here, and is there a school-zone premium baked into asking?
- The area grade is low — what's the realistic commute time and amenity access for the typical tenant pool here? Any planned neighborhood developments (good or bad) we should know about?
- What's the average days-on-market for RENTAL listings here right now (not sales)? A rising rental-DOM trend means longer vacancies and softer asking-rent achievability than the comps imply.
- What's the recent tenant-quality profile in this submarket — average credit score on applications, eviction rate, late-payment / NSF rate, and stable-employment percentage? A property-management company in the area should have these aggregated.
- How much new for-sale + rental construction is in the pipeline within 1–3 miles? Heavy new supply typically softens prices + rents 12–24 months out; constrained supply supports both.
Investment metrics
- 1% rule
- 0.74% ✗
- Cap rate
- 6.01%
- Cash-on-cash
- -1.00%
- DSCR
- 0.96
- GRM
- 11.3
CMA / ARV
- ARV (on-the-fly)
- $284,340
- Comps found
- 12
Show comp detail 12 sales within ~0.75 mi
| Address | Dist | Beds/Ba | Sqft | Sold | Price | $/sf | Match |
|---|---|---|---|---|---|---|---|
| 1626 Sandy Hollow Loop | 0.22mi | 3/2.0 | 1,317 (-3%) | 6mo | $278,000 | $211 | 80 |
| 1672 Sandy Hollow Loop | 0.31mi | 3/2.0 | 1,252 (-8%) | 4mo | $285,000 | $228 | 70 |
| 1499 Pawnee St | 0.67mi | 3/2.0 | 1,338 (-1%) | 1mo | $237,000 | $177 | 66 |
| 1490 Sekani Ct | 0.67mi | 3/2.0 | 1,338 (-1%) | 8mo | $225,000 | $168 | 60 |
| 2705 Pinewood Blvd N | 0.58mi | 3/2.0 | 1,262 (-7%) | 4mo | $226,500 | $179 | 59 |
| 2715 Pinewood Blvd N | 0.60mi | 3/2.0 | 1,252 (-8%) | 2mo | $275,000 | $220 | 58 |
| 1652 E Evergreen Ln | 0.35mi | 3/2.0 | 1,172 (-13%) | 7mo | $259,000 | $221 | 55 |
| 3071 Wavering Ln | 0.69mi | 3/2.0 | 1,234 (-9%) | 1mo | $259,100 | $210 | 53 |
| 133 McVickers Rd | 0.67mi | 3/2.0 | 1,488 (+10%) | 1mo | $285,000 | $192 | 51 |
| 1784 Northglen Cir | 0.47mi | 3/2.0 | 1,538 (+14%) | 7mo | $280,000 | $182 | 50 |
| 2772 Commanche Ave | 0.59mi | 3/2.0 | 1,200 (-11%) | 5mo | $218,000 | $182 | 49 |
| 1653 Mary Beth Dr | 0.62mi | 4/2.0 (+1) | 1,176 (-13%) | 1mo | $275,000 | $234 | 43 |
Match score weights: distance 35% · size 25% · config 20% · recency 20%. Top-matched comps best support the ARV.
Projected returns pro-forma
-3.0% appreciation · 3.35% rent growth · sell at horizon
- IRR
- -17.7%
- Equity multiple
- 0.38×
- Total profit
- $-44,555
- Equity at exit
- $38,021
- IRR
- -9.3%
- Equity multiple
- 0.42×
- Total profit
- $-41,352
- Equity at exit
- $22,048
Cash invested: $71,400 (down + closing). Projections, not guarantees.
Landlord ↔ Tenant lean methodology
- Overall (STATE)
- 87 Strongly Landlord-Friendly
- State Florida
- 87 Strongly Landlord-Friendly · R+3
- County
- — inherits STATE
- City
- — inherits STATE
ZIP-level market 32068
- Home prices YoY
- -27.5%
- Rents YoY
- 3.4%
- Active inventory
- 601
- Price-to-rent
- 11.3×
Monthly cashflow live
- Estimated rent
- $1,885 high interval (Pro) →
- Mortgage (P&I)
- −$1,337
- Tax from tax record
- −$105 /mo · $1,264/yr
- Insurance
- −$106
- HOA
- −$0
- Vacancy / Maint / Mgmt
- −$396
- Net cashflow
- $-60
Break-even live
UW: 25.0% down · 7.5% · 30yr · 1.5% tax · 5.0% vac · 8.0% maint · 8.0% mgmt
Financing live
Cash to close
- Down payment
- $63,750
- Closing costs
- $7,650
- Reserves months
- —
- Total cash needed
- —
Loan-product check · same deal, 3 products live
Conventional
25% down · 7.5% · 30yr
- Down + closing
- —
- Monthly P&I
- —
- Monthly cashflow
- —
- DSCR
- —
- Eligible?
- —
Personal DTI + credit; lowest rate.
DSCR
20% down · 8.5% · 30yr
- Down + closing
- —
- Monthly P&I
- —
- Monthly cashflow
- —
- DSCR
- —
- Eligible?
- —
No personal income docs; deal must DSCR.
Hard money
10% down · 12.0% · 12mo
- Down + closing
- —
- Monthly P&I
- —
- Monthly cashflow
- —
- DSCR
- —
- Eligible?
- —
Short-term bridge; refi at stabilization.
Rent comps 24 comps
| Address | Beds | Baths | Sqft | Rent | $/sqft | DOM | Units | Dist |
|---|---|---|---|---|---|---|---|---|
| 1809 Dartmouth Dr Middleburg, FL | 3.0 | 2.0 | 1702 | $1,750 | $1.03 | 23d | 1 | 0.33mi |
| 1338 Pawnee St Orange Park, FL | 3.0 | 2.0 | 1324 | $1,905 | $1.44 | 19d | 1 | 0.51mi |
| 2718 Pinewood Blvd N Middleburg, FL | 3.0 | 2.0 | 1096 | $1,739 | $1.59 | 3d | 1 | 0.57mi |
| 1559 Irishwood Ct Middleburg, FL | 3.0 | 2.0 | 1449 | $1,800 | $1.24 | 19d | 1 | 0.68mi |
| 2796 Kiowa Ave Orange Park, FL | 3.0 | 2.0 | 1274 | $1,915 | $1.50 | 2d | 1 | 0.68mi |
| 3255 Hammock Cove Ct Middleburg, FL | 3.0 | 2.0 | 1441 | $1,750 | $1.21 | 23d | 1 | 0.70mi |
| 1504 Pawnee St Orange Park, FL | 3.0 | 2.0 | 1338 | $1,795 | $1.34 | 20d | 1 | 0.72mi |
| 1752 Glen Laurel Dr Middleburg, FL | 3.0 | 2.0 | 1788 | $2,000 | $1.12 | 23d | 1 | 0.82mi |
| 2897 Gatling Blvd Orange Park, FL | 3.0 | 2.0 | 1338 | $1,650 | $1.23 | 7d | 1 | 0.83mi |
| 2804 Canyon Ct Orange Park, FL | 3.0 | 2.0 | 1367 | $1,824 | $1.33 | 14d | 1 | 0.92mi |
| 1248 Ticonderoga Trl Unit C Orange Park, FL | 2.0 | 2.0 | 922 | $1,195 | $1.30 | 7d | 1 | 1.03mi |
| 1281 Independence Dr Orange Park, FL | 3.0 | 2.0 | 1087 | $1,695 | $1.56 | 23d | 1 | 1.03mi |
| 1333 Jefferson Ave Unit D Orange Park, FL | 2.0 | 2.0 | 922 | $1,325 | $1.44 | 23d | 1 | 1.06mi |
| 1330 Jefferson Ave Orange Park, FL | 2.0 | 2.0 | 922 | $1,250 | $1.36 | 16d | 1 | 1.07mi |
| 2716 Secret Harbor Dr Orange Park, FL | 3.0 | 2.0 | 1388 | $1,695 | $1.22 | 4d | 1 | 1.09mi |
| 2716 Secret Harbor Dr Orange Park, FL | 3.0 | 2.0 | 1268 | $1,695 | $1.34 | 7d | 1 | 1.09mi |
| 1324 Jefferson Ave Orange Park, FL | 2.0 | 2.0 | 926 | $1,245 | $1.34 | 23d | 1 | 1.10mi |
| 1324 Jefferson Ave Orange Park, FL | 2.0 | 2.0 | 922 | $1,245 | $1.35 | 2d | 1 | 1.10mi |
| 1270 Ticonderoga Trl Unit C Orange Park, FL | 2.0 | 2.0 | 922 | $1,300 | $1.41 | 23d | 1 | 1.13mi |
| 25 Knight Boxx Rd Orange Park, FL | 1.0–3.0 | 1.0–2.0 | 1109 | $1,863 | $1.68 | 2d | 18 | 1.14mi |
| 3296 Isabella Ct Unit 1 Orange Park, FL | 3.0 | 2.5 | 1800 | $2,050 | $1.14 | 3d | 1 | 1.26mi |
| 3296 Isabella Ct Orange Park, FL | 3.0 | 2.5 | 1800 | $2,050 | $1.14 | 4d | 1 | 1.26mi |
| 3296 Isabella Ct Unit 3296 Orange Park, FL | 3.0 | 2.5 | 1714 | $2,050 | $1.20 | 23d | 1 | 1.26mi |
| 3223 Merganzer Trl Orange Park, FL | 3.0 | 2.0 | 1155 | $1,755 | $1.52 | 23d | 1 | 1.45mi |
Listing history 3 events
-
2026-06-03status $255,000 Pending 1 DOM
-
2026-06-02remarks 699-char remark
-
2026-06-02$255,000 Active 1 DOM
ⓘ Source: listings_history table (triggers on properties + properties_extension) + one-shot
backfill from property_details.listing_events for pre-trigger history.
Tax reassessment forecast FL · Resets to sale price
- Current annual tax
- $1,264 · $105/mo
- Projected year-2 tax
- $2,116 · $176/mo
- Expected delta
- +$853/yr (+$71/mo · 67.5%)
ⓘ Screening estimate from a state-policy table — verify with the county assessor before closing.
Climate risk First Street
- Flood 1/10 Low FEMA zone X (unshaded) · 0% chance over 30 yrs
- Wildfire 4/10 Moderate
- Heat 9/10 Extreme 7 d/yr ≥107°F today · 19 d/yr by 30 yrs out
- Wind 9/10 Extreme 99% chance of damaging wind over 30 yrs
- Air quality 3/10 Moderate 3 unhealthy d/yr today · 3 by 30 yrs out
Nearby sold comps map
Loading sold comps map…
Walkable amenities ~0.75 mi
Loading nearby amenities…
Taxation est. · year 1
- Rental income
- $22,620
- − Mortgage interest
- −$14,284
- − Property taxes
- −$1,264
- − Insurance
- −$1,275
- − Repairs & maintenance
- −$1,810
- − Management
- −$1,810
- − Depreciation
- −$7,418
- Taxable loss
- −$5,240
- Est. tax savings @ 24.0%
- +$1,258
- After-tax cash flow
- $542/yr
For passive investors: Depreciation is non-cash, so a rental often shows a tax loss while cash-flowing — sheltering income. Rental losses are passive: they offset passive income freely, and up to $25,000/yr can offset ordinary (W-2) income if you actively participate and your MAGI is under $100k (phasing out to $0 by $150k); unused losses carry forward. On sale, claimed depreciation is recaptured at up to 25%, and gains may owe capital-gains tax (a 1031 exchange can defer both). Figures are a year-1 estimate at your 24.0% rate — not tax advice; consult a CPA.
Schools (NCES district)
- District
- Clay
- NCES district ID
- 1200300
- Math proficiency
- 58% ▼ -8.00%
- Reading proficiency
- 59% ▼ -3.00%
- Median HH income
- $59,379
- Composite
- 50.73/100
- National rank
- #1815
- State rank
- #14 of 73 in FL
Livability — Lakeside
- Score
- 68/100
- State rank
- #505
- US rank
- #9341
Category grades
Schools grade is shown separately in the Schools card above.
Census & demographics
- Census place
- Lakeside, FL
- County
- Clay County · 208,450 people
- Metro
- Jacksonville, FL
- Population (ZIP)
- 58,983
- Household income
- $84,431
- Rent vs Own
- Severe rent burden
- 975.0
Population outlook (Clay County) Hauer SSP2
- Today (2025)
- 230,495 people
- By 2030
- 242,427 · +5.2%
- By 2040
- 262,244 · +13.8%
- By 2050
- 275,148 · +19.4%
- By 2075
- 295,397 · +28.2%
- By 2100
- 287,592 · +24.8%
Race, ethnicity, and origin ACS 2023
- Neighborhood character
- Predominantly White (74%)
- Race & ethnicity
- White 74% Hispanic / Latino 13% Two or more races 10% Black 7%
- Hispanic origin (detail)
- Mexican 2% Puerto Rican 5%
- Common ancestry
- Slovak 2% Romanian 2% Lithuanian 2%
- Foreign-born
- 7% · Canada, Jamaica
- Languages at home
- 87% English-only · Spanish 9% Arabic 1% German/W. Germanic 1%
Political lean MEDSL · Clay
- 2024 margin
- Solid R (+39.3) · D 29.9% · R 69.2%
- 2008→2024 swing
- +3.6pp toward D · 2008: -42.8pp · 2024: -39.3pp
- All cycles
- 2024: R+39.3 2020: R+37.1 2016: R+44.3 2012: R+45.8 2008: R+42.8
Not yet ingested
- Civics
- —
Market trends
- HPI YoY
- ▼ -115.99%
- Current HPI
- 305.2531
- Rent YoY
- ▲ 3.35%
- Metro
- Jacksonville, FL
- State GDP YoY
- ▲ 3.28%
- F500 in state
- 36
Industry mix (Fortune 500 HQ in FL)
| Industry | F500 HQs | Revenue |
|---|---|---|
| Industrial Technology | 2 | $29B |
|
||
| Insurance | 2 | $17B |
|
||
| Retail | 1 | $60B |
|
||
| Technology Distribution | 1 | $58B |
|
||
| Homebuilding | 1 | $35B |
|
||
| Technology Manufacturing | 1 | $35B |
|
||
Price history
+596.7% since first listed3 events — show timeline
- 2026-06-03 Pending — realMLS
- 2026-06-02 Listed $255,000 realMLS
- 1997-07-02 Sold (Public Records) $36,600 Public Records
Property tax history
+3.5%/yrLatest (2025): $1,264 · +4.0% YoY. Source: county tax records.
Cash-flow waterfall
monthlySold comps — $/sqft
last 12 mo · ≤1 miLoading sold comps…