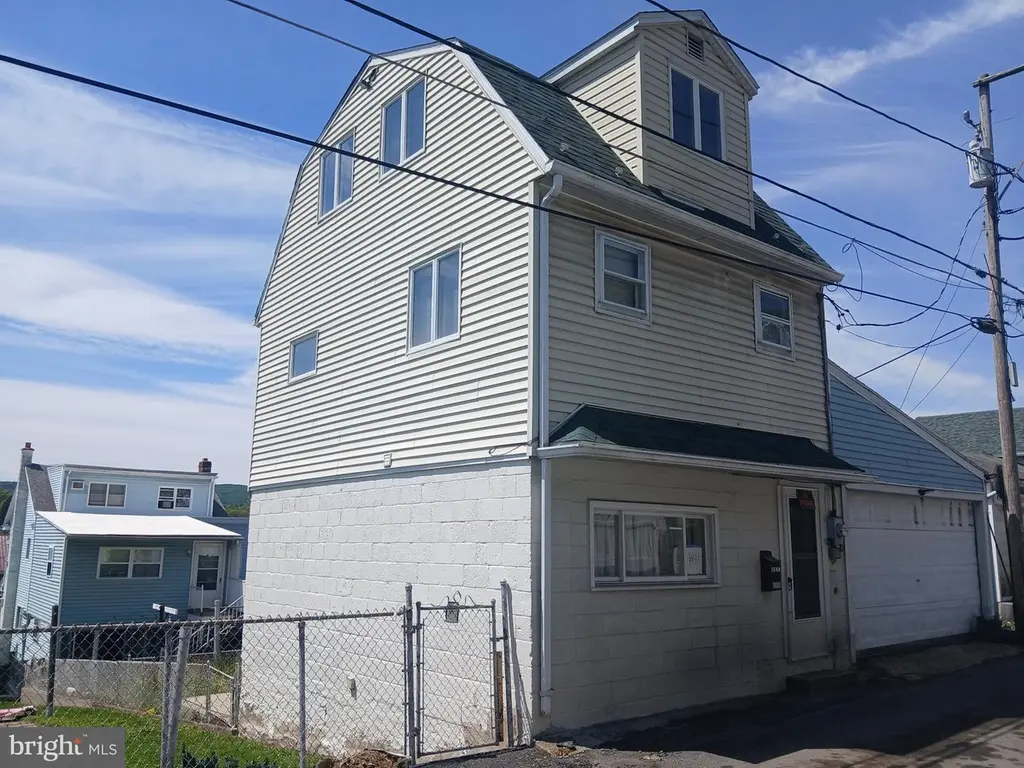
1548 W Independence St · Edgewood, PA
Flood risk 1/10 · Minimal
- FEMA flood zone
- X (unshaded)
- Chance of flooding over 30 yrs
- 0.0%
- Est. flood insurance / yr
- $473 – $860
Fire risk 3/10 · Minor
- Est. fire insurance / yr
- $511 – $949
Heat risk 4/10 · Minor
- Hot days now (above 95°F)
- 7 days/yr
- Hot days in 30 yrs
- 16 days/yr
Wind risk 2/10 · Minimal
- Chance of severe wind over 30 yrs
- 4.0%
Air-quality risk 2/10 · Minimal
- Unhealthy air days now
- 1 days/yr
- Unhealthy air days in 30 yrs
- 2 days/yr
Risk factors via First Street. Map © Google.
Why this score? — see what drove the B grade
The composite is a weighted blend of 9 inputs, each scored 0–100. Each bar is that input's sub-score; the figure is the points it added to the 100-point composite (weight × sub-score).
- Cash flow +30.0/30.0
- DSCR +10.0/10.0
- 1% rule +9.9/10.0
- ARV discount +7.5/15.0
- Livability +4.5/5.0
- Appreciation +4.4/10.0
- Rent growth +2.5/5.0
- Condition / age +2.5/5.0
- Schools +2.4/10.0
$63,900
🖨 Deal sheet 📄 Offer letter ✓ Due diligence
Listing remarks MLS
This Tri level home is situated in the West end of Coal Township and is buyer ready. Spacious living room on first floor with laundry room. Second floor has eat in kitchen another room that was previously used as a bedroom. Upper level has a full bath and bedroom. Home has wall to wall carpeting, along with chair lifts on stair ways. Washer, Dryer, range, and refrigerator are included. Newly cement patio with fenced in yard to rear.
Key facts
- Built 1920
- Listed 19 days
Tags
Property features AI
Exterior
- Parking: On-street parking
- Utilities: Public water; Public sewer; Electric service
- Home design: Semi-detached property; Fee simple ownership; Year built estimated
- Construction: Vinyl siding; Permanent foundation
- Exterior features: Lot dimensions approximately 16 x 44; Not in a federal flood zone; Above grade and below grade other structures noted
Interior
- Bedrooms: 3 bedrooms on main level
- Bathrooms: 1 full bathroom on main level; 1 full bathroom total
- Heating & cooling: Baseboard electric heat; Electric hot water
- Interior features: Estimated living area; No basement
Neighborhood map
What this means for you Summary
Snapshot
- This is a 3-bed/1.0-bath townhouse listed at $64k.
Deal economics
- At list price, monthly cash flow is $362 ($4k/yr) — positive.
- The deal already cash-flows at list — no discount required.
- Meets the 1% rule at list price ($954 rent vs $64k).
- Recommended offer: $63k (1.5% below list) — sets the bar for market timing.
Location & tenants
- Location reads 91/100 on livability (#14 in PA, #64 nationally) — a professional / high-income tenant draw. Strengths: schools A+, commute A+, employment A+; Watch: health & safety D+.
- Shamokin Area SD (town): math 19% / reading 40% proficiency, ranked #450 of 539 in PA (top 84%) — low school quality limits family demand, transient renter base, plan for 1-2y turnover.
- Market conditions: 30 active listings in the ZIP; 2 comparable units currently listed for rent nearby; 81 units permitted in Northumberland County in 2024 (0 in 5+ unit buildings).
Forward outlook
- Local home prices are declining (-1.3%/yr); year-one equity from $442 of loan paydown is wiped out by about $826 of value loss. Plan a longer hold.
- Northumberland County population projected at -11% by 2050 — secular population decline; favor cash flow + early exit over multi-decade hold.
- At projected returns (-1.3% appreciation + 3.0% rent growth), your $18k cash investment doubles in ~5 years — after that, you're playing with house money.
Negotiation context
- It's been on market 20 days — a 2% lower offer ($63k) is reasonable based on typical stale-listing flexibility.
- 4 sale attempts since 2y ago with the ask held roughly flat each time — persistent listings suggest the price (not the market) is what's stuck; bring a comps-based counter.
- Current owner paid $55k; 16% above their basis — modest negotiation headroom, anchor on the comps not their cost.
Risks & watch-outs
- Watch-outs: built in 1920 — expect roof / HVAC / electrical / plumbing capex.
Questions for the listing agent
- Built in 1920 — when were the roof, HVAC, electrical panel, plumbing, and water heater last replaced?
- Is there a deadline driving the sale (1031 exchange, divorce, estate, relocation)? That informs how much negotiation room exists.
- Schools are A-rated — typically a magnet for longer-tenancy family renters. What's the average tenant stay here, and is there a school-zone premium baked into asking?
- What's the average days-on-market for RENTAL listings here right now (not sales)? A rising rental-DOM trend means longer vacancies and softer asking-rent achievability than the comps imply.
- What's the recent tenant-quality profile in this submarket — average credit score on applications, eviction rate, late-payment / NSF rate, and stable-employment percentage? A property-management company in the area should have these aggregated.
- How much new for-sale + rental construction is in the pipeline within 1–3 miles? Heavy new supply typically softens prices + rents 12–24 months out; constrained supply supports both.
Investment metrics
- 1% rule
- 1.49% ✓
- Cap rate
- 13.10%
- Cash-on-cash
- 24.31%
- DSCR
- 2.08
- GRM
- 5.6
CMA / ARV
- ARV (on-the-fly)
- $40,467
- Comps found
- 6
Show comp detail 6 sales within ~0.75 mi
| Address | Dist | Beds/Ba | Sqft | Sold | Price | $/sf | Match |
|---|---|---|---|---|---|---|---|
| 1219 W Walnut St | 0.26mi | 3/1.0 | 960 (+12%) | 4mo | $45,000 | $47 | 66 |
| 1030 W Lynn St | 0.41mi | 3/1.0 | 952 (+11%) | 3mo | $31,000 | $33 | 61 |
| 1316 W Walnut St W | 0.19mi | 3/1.0 | 980 (+14%) | 11mo | $64,500 | $66 | 59 |
| 117 - 119 N Oak St | 0.52mi | 3/1.0 | 961 (+12%) | 6mo | $140,000 | $146 | 52 |
| 1042 W Water St | 0.38mi | 2/2.0 (-1) | 990 (+15%) | 3mo | $29,000 | $29 | 46 |
| 1026 W Lynn St | 0.41mi | 2/1.0 (-1) | 952 (+11%) | 15mo | $35,000 | $37 | 45 |
Match score weights: distance 35% · size 25% · config 20% · recency 20%. Top-matched comps best support the ARV.
Projected returns pro-forma
-1.29% appreciation · 3.0% rent growth · sell at horizon
- IRR
- 21.6%
- Equity multiple
- 1.97×
- Total profit
- $17,418
- Equity at exit
- $14,532
- IRR
- 27.4%
- Equity multiple
- 3.75×
- Total profit
- $49,176
- Equity at exit
- $14,511
Cash invested: $17,892 (down + closing). Projections, not guarantees.
Landlord ↔ Tenant lean methodology
- Overall (STATE)
- 62 Landlord-Friendly
- State Pennsylvania
- 62 Landlord-Friendly · EVEN
- County
- — inherits STATE
- City
- — inherits STATE
ZIP-level market 17866
- Home prices YoY
- -1.1%
- Active inventory
- 30
- Price-to-rent
- 5.6×
Monthly cashflow live
- Estimated rent
- $954 medium interval (Pro) →
- Mortgage (P&I)
- −$335
- Tax from tax record
- −$29 /mo · $350/yr
- Insurance
- −$27
- HOA
- −$0
- Vacancy / Maint / Mgmt
- −$200
- Net cashflow
- $362
Break-even live
UW: 25.0% down · 7.5% · 30yr · 1.5% tax · 5.0% vac · 8.0% maint · 8.0% mgmt
Financing live
Cash to close
- Down payment
- $15,975
- Closing costs
- $1,917
- Reserves months
- —
- Total cash needed
- —
Loan-product check · same deal, 3 products live
Conventional
25% down · 7.5% · 30yr
- Down + closing
- —
- Monthly P&I
- —
- Monthly cashflow
- —
- DSCR
- —
- Eligible?
- —
Personal DTI + credit; lowest rate.
DSCR
20% down · 8.5% · 30yr
- Down + closing
- —
- Monthly P&I
- —
- Monthly cashflow
- —
- DSCR
- —
- Eligible?
- —
No personal income docs; deal must DSCR.
Hard money
10% down · 12.0% · 12mo
- Down + closing
- —
- Monthly P&I
- —
- Monthly cashflow
- —
- DSCR
- —
- Eligible?
- —
Short-term bridge; refi at stabilization.
Rent comps 2 comps
| Address | Beds | Baths | Sqft | Rent | $/sqft | DOM | Units | Dist |
|---|---|---|---|---|---|---|---|---|
| 11 S Market St Fl Rear Shamokin, PA | 3.0 | 1.0 | 950 | $1,000 | $1.05 | 43d | 1 | 1.00mi |
| 11 S Market St Apt B Rear Shamokin, PA | 2.0 | 1.0 | 1100 | $900 | $0.82 | 43d | 1 | 1.00mi |
Listing history 15 events
-
2026-06-19days on market $63,900 Active 20 DOM
-
2026-06-18days on market $63,900 Active 19 DOM
-
2026-06-17days on market $63,900 Active 18 DOM
-
2026-06-16days on market $63,900 Active 17 DOM
-
2026-06-15days on market $63,900 Active 16 DOM
-
2026-06-14days on market $63,900 Active 14 DOM
-
2026-06-12days on market $63,900 Active 13 DOM
-
2026-06-09days on market $63,900 Active 10 DOM
-
2026-06-08days on market $63,900 Active 9 DOM
-
2026-06-07days on market $63,900 Active 8 DOM
-
2026-06-03days on market $63,900 Active 4 DOM
-
2026-06-02days on market $63,900 Active 3 DOM
-
2026-06-01days on market $63,900 Active 2 DOM
-
2026-05-31remarks 272-char remark
-
2026-05-31$63,900 Active 1 DOM
ⓘ Source: listings_history table (triggers on properties + properties_extension) + one-shot
backfill from property_details.listing_events for pre-trigger history.
Tax reassessment forecast PA · Partial reset (capped growth)
- Current annual tax
- $350 · $29/mo
- Projected year-2 tax
- $680 · $57/mo
- Expected delta
- +$330/yr (+$27/mo · 94.0%)
ⓘ Screening estimate from a state-policy table — verify with the county assessor before closing.
Climate risk First Street
- Flood 1/10 Low FEMA zone X (unshaded) · 0% chance over 30 yrs
- Wildfire 3/10 Moderate
- Heat 4/10 Moderate 7 d/yr ≥95°F today · 16 d/yr by 30 yrs out
- Wind 2/10 Low 4% chance of damaging wind over 30 yrs
- Air quality 2/10 Low 1 unhealthy d/yr today · 2 by 30 yrs out
Nearby sold comps map
Loading sold comps map…
Walkable amenities ~0.75 mi
Loading nearby amenities…
Taxation est. · year 1
- Rental income
- $11,444
- − Mortgage interest
- −$3,579
- − Property taxes
- −$350
- − Insurance
- −$320
- − Repairs & maintenance
- −$916
- − Management
- −$916
- − Depreciation
- −$1,859
- Taxable income
- $3,505
- Est. tax owed @ 24.0%
- −$841
- After-tax cash flow
- $3,508/yr
For passive investors: Depreciation is non-cash, so a rental often shows a tax loss while cash-flowing — sheltering income. Rental losses are passive: they offset passive income freely, and up to $25,000/yr can offset ordinary (W-2) income if you actively participate and your MAGI is under $100k (phasing out to $0 by $150k); unused losses carry forward. On sale, claimed depreciation is recaptured at up to 25%, and gains may owe capital-gains tax (a 1031 exchange can defer both). Figures are a year-1 estimate at your 24.0% rate — not tax advice; consult a CPA.
Schools (NCES district)
- District
- Shamokin Area SD
- NCES district ID
- 4221240
- Math proficiency
- 19% ▼ -13.00%
- Reading proficiency
- 40% ▼ -11.00%
- Median HH income
- $35,380
- Composite
- 24.31/100
- National rank
- #7709
- State rank
- #450 of 539 in PA
Livability — Edgewood
- Score
- 91/100
- State rank
- #14
- US rank
- #64
Category grades
Schools grade is shown separately in the Schools card above.
Census & demographics
- Census place
- Edgewood, PA
- Population (ZIP)
- 9,808
Population outlook (Northumberland County) Hauer SSP2
- Today (2025)
- 90,896 people
- By 2030
- 89,084 · -2.0%
- By 2040
- 84,822 · -6.7%
- By 2050
- 80,521 · -11.4%
- By 2075
- 72,152 · -20.6%
- By 2100
- 62,257 · -31.5%
Race, ethnicity, and origin ACS 2023
- Neighborhood character
- Predominantly White (79%)
- Race & ethnicity
- White 79% Black 15% Hispanic / Latino 4% Two or more races 2%
- Common ancestry
- Romanian 12% Iranian 4% Subsaharan African 2%
- Foreign-born
- 1%
- Languages at home
- 97% English-only · Spanish 3%
Political lean MEDSL · Northumberland
- 2024 margin
- Solid R (+39.9) · D 29.6% · R 69.5%
- 2008→2024 swing
- -26.1pp toward R · 2008: -13.8pp · 2024: -39.9pp
- All cycles
- 2024: R+39.9 2020: R+38.5 2016: R+43.6 2012: R+19.4 2008: R+13.8
Not yet ingested
- Civics
- —
Market trends
- HPI YoY
- ▼ -1.29%
- Current HPI
- 111.3788
- Rent YoY
- —
- Metro
- —
- State GDP YoY
- ▲ 1.68%
- F500 in state
- 34
Industry mix (Fortune 500 HQ in PA)
| Industry | F500 HQs | Revenue |
|---|---|---|
| Healthcare | 2 | $309B |
|
||
| Insurance | 2 | $27B |
|
||
| Telecommunications / Media | 1 | $124B |
|
||
| Industrial Distribution | 1 | $22B |
|
||
| Financial Services | 1 | $20B |
|
||
| Chemicals / Materials | 1 | $18B |
|
||
Price history
-19.1% since first listed11 events — show timeline
- 2026-05-30 Listed $63,900 BRIGHT MLS
- 2026-01-09 Relisted — CSVBR
- 2026-01-09 Price Changed $65,000 CSVBR
- 2025-07-29 Price Changed $69,000 CSVBR
- 2025-07-10 Price Changed $72,000 CSVBR
- 2025-06-10 Listed $79,900 CSVBR
- 2024-07-02 Sold (Public Records) $55,000 Public Records
- 2024-06-24 Sold (MLS) $55,000 CSVBR
- 2024-06-04 Pending — CSVBR
- 2024-05-12 Price Changed $68,000 CSVBR
- 2024-04-27 Listed $79,000 CSVBR
Property tax history
+3.9%/yrLatest (2026): $350 · +2.2% YoY. Source: county tax records.
Cash-flow waterfall
monthlySold comps — $/sqft
last 12 mo · ≤1 miLoading sold comps…