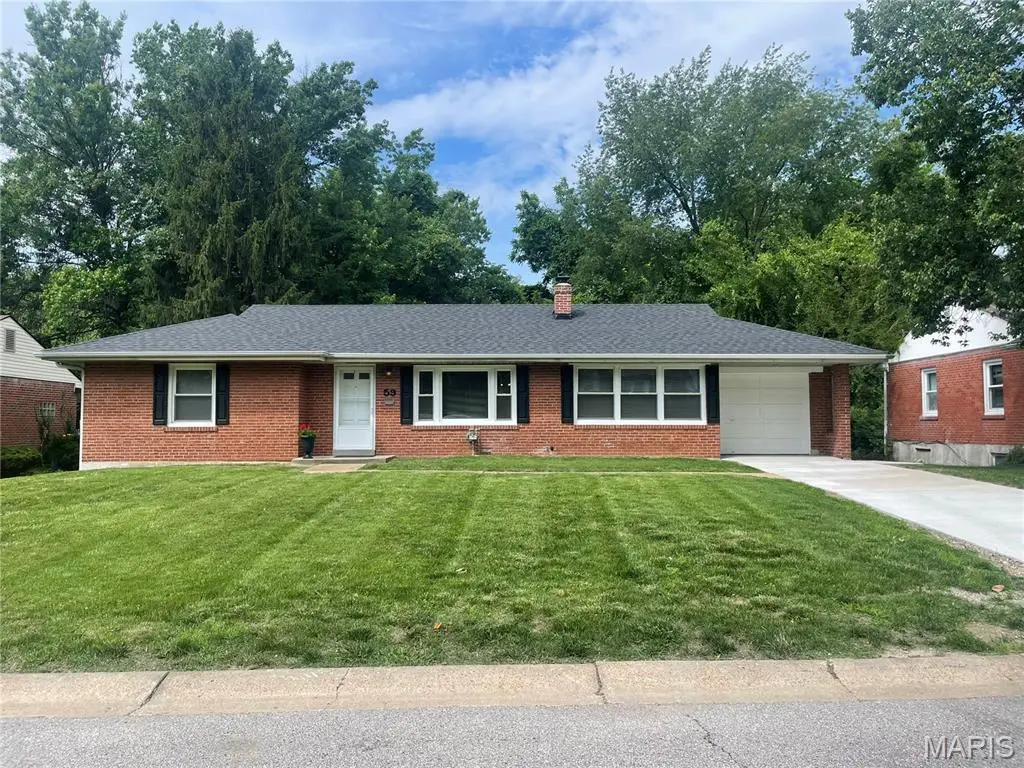
59 S Floridale Dr · Dellwood, MO
Flood risk 1/10 · Minimal
- FEMA flood zone
- X (unshaded)
- Chance of flooding over 30 yrs
- 0.0%
- Est. flood insurance / yr
- $473 – $860
Fire risk 1/10 · Minimal
- Est. fire insurance / yr
- $1,054 – $1,958
Heat risk 5/10 · Moderate
- Hot days now (above 106°F)
- 7 days/yr
- Hot days in 30 yrs
- 20 days/yr
Wind risk 2/10 · Minimal
- Chance of severe wind over 30 yrs
- 1.0%
Air-quality risk 4/10 · Minor
- Unhealthy air days now
- 4 days/yr
- Unhealthy air days in 30 yrs
- 5 days/yr
Risk factors via First Street. Map © Google.
Why this score? — see what drove the D- grade
The composite is a weighted blend of 9 inputs, each scored 0–100. Each bar is that input's sub-score; the figure is the points it added to the 100-point composite (weight × sub-score).
- Cash flow +15.1/30.0
- Rent growth +4.8/5.0
- DSCR +4.6/10.0
- 1% rule +4.1/10.0
- ARV discount +3.9/15.0
- Livability +3.3/5.0
- Condition / age +2.5/5.0
- Schools +1.2/10.0
- Appreciation +0.0/10.0
$142,500
🖨 Deal sheet (PDF) 📄 Offer letter ✓ Due diligence
Listing remarks
NO SIGN IN YARD! DELLWOOD BEAUTY!! OCCUPANCY INSPECTION COMPLETE! NEW UPGRADED ARCHITECTUAL SHINGLED ROOF WITH EXTRA VENTS, NEW CONCRETE DRIVEWAY, FULL BRICK WITH EXTERIOR UPGRADES, LARGE LEVEL FENCED YARD WITH TWO GATES AND OVERSIZED CONCRETE PATIO BACKING TO COMMON GROUND, NEWER CONCRETE GARAGE FLOOR, PROPERTY SHOWS AS TRUE THREE BEDROOM (TAX RECORDS SAYS TWO), REFINISHED PRETTY WOOD FLOORS, NEW VINYL IN ENTRY AND KITCHEN, FRESHLY PAINTED AND MOVE-IN READY, UPDATED BATH, CLEAN BASEMENT WITH NO ISSUES, SPEPARATE DINING ROOM, VINYL WINDOWS, NUMEROUS NEW BLINDS THRUOUT! GREAT LOCATION AND QUIET, LOW TRAFFIC STREET! AGENT OWNED
Key facts
- 9,975 sq ft lot
- 11 garage spots
- Built 1952
Tags
Property features AI
Finance
- Other: Living area reported as 1,282 (estimated / public records)
- Financial info: Lease not considered; Seller may consider concessions
Exterior
- Parking: Detached/attached private garage; Garage faces front; Concrete driveway; 11 garage spaces
- Security: Carbon monoxide detector(s)
- Utilities: Public water; Public sewer; Ameren electric; Cable available; Electricity connected; Natural gas connected; Water connected; Sewer connected
- Home design: Single family residence; Updated/remodeled condition; One level (ranch); Private ownership; Brick exterior
- Construction: Brick construction; Architectural shingle roof; Shingle roof; Concrete perimeter foundation; Built (year source: public records)
- Exterior features: Patio; Back yard and front yard; Level, open, rectangular lot; Chain link and perimeter fencing; Storm door(s); Shed(s)
Interior
- Kitchen: Electric oven; Electric range; Pantry
- Bedrooms: Three bedrooms on the main level
- Flooring: Carpet; Vinyl; Wood
- Bathrooms: One full bathroom on the main level
- Heating & cooling: Forced air heating (natural gas); Central air conditioning (electric)
- Interior features: Pantry; Storage; Insulated windows; Shutters; Window treatments; Electric oven; Electric range; Gas water heater; Water heater
- Laundry & utility: Water heater; Gas water heater
Neighborhood map
What this means for you Summary
Snapshot
- This is a 2-bed/1.0-bath single-family listed at $142k.
Deal economics
- At list price, monthly cash flow is $46 ($549/yr) — positive.
- The deal already cash-flows at list — no discount required.
- To meet the 1% rule (rent ≥ 1% of price), the offer needs to be $129k (9.2% below list).
- Recommended offer: $129k (9.2% below list) — sets the bar for 1% rule.
- Cap rate 6.7% vs local median 10.3% in Dellwood — below-typical yield; the buyer is paying a premium for something (appreciation thesis, condition, location) that the cap rate doesn't capture.
Location & tenants
- Location reads 66/100 on livability (#239 in MO) — a middle-class / working-renter tenant base. Strengths: cost of living A+, housing A+; Watch: health & safety C-, crime D-, amenities F.
- Ferguson-Florissant R-II (suburban): math 7% / reading 20% proficiency, ranked #311 of 324 in MO (top 96%) — low school quality limits family demand, transient renter base, plan for 1-2y turnover; 70% free/reduced lunch — lower-income household profile, screen leases tightly.
- Zoned schools: Griffith Elementary (math 3% / reading 9%, grade F, #1,069 of 1,115 statewide, top 96%, 282 students, 99% FRL); Ferguson Middle (math 3% / reading 14%, grade F, #376 of 391 statewide, top 96%, 615 students, 100% FRL); Mccluer High (math 0% / reading 17%, grade F, #511 of 521 statewide, top 98%, 1,181 students, 100% FRL) — zoned schools average 99% FRL vs 70% district-wide (30 pts higher); higher-poverty schools than district average — tighter screening recommended.
- Market conditions: Rents rising fast (+9.0%/yr); 165 active listings in the ZIP; 40 comparable units currently listed for rent nearby; rentals lingering (median 46d on market — plan ~5-8 weeks vacancy on turnover, expect pricing pressure); 50% of comp listings sitting > 30 days — soft ceiling on asking rent; 920 units permitted in St. Louis County in 2024 (250 in 5+ unit buildings).
Forward outlook
- Local home prices are declining (-3.0%/yr); year-one equity from $985 of loan paydown is wiped out by about $4k of value loss. Plan a longer hold.
Negotiation context
- Only 2 days on market — expect competitive offers; lowballing is unlikely to land.
Risks & watch-outs
- Watch-outs: built in 1952 — expect roof / HVAC / electrical / plumbing capex.
- Climate carrying-cost: extreme-heat days projected 7→20/yr by 2055 (HVAC capex compounding) — expect insurance premiums to compound above CPI over the hold.
Questions for the listing agent
- Built in 1952 — when were the roof, HVAC, electrical panel, plumbing, and water heater last replaced?
- Is there a deadline driving the sale (1031 exchange, divorce, estate, relocation)? That informs how much negotiation room exists.
- Schools are D-rated, which usually means shorter tenancies and higher turnover. Who's the typical renter profile here, and what's been the actual vacancy rate?
- Crime grade is D in this area — have there been break-ins, vandalism, or insurance claims at this property in the last 3 years? What carrier currently insures it and at what premium?
- The area grade is low — what's the realistic commute time and amenity access for the typical tenant pool here? Any planned neighborhood developments (good or bad) we should know about?
- What's the average days-on-market for RENTAL listings here right now (not sales)? A rising rental-DOM trend means longer vacancies and softer asking-rent achievability than the comps imply.
- What's the recent tenant-quality profile in this submarket — average credit score on applications, eviction rate, late-payment / NSF rate, and stable-employment percentage? A property-management company in the area should have these aggregated.
- How much new for-sale + rental construction is in the pipeline within 1–3 miles? Heavy new supply typically softens prices + rents 12–24 months out; constrained supply supports both.
Investment metrics
- 1% rule
- 0.91% ✗
- Cap rate
- 6.68%
- Cash-on-cash
- 1.38%
- DSCR
- 1.06
- GRM
- 9.2
CMA / ARV
- ARV (on-the-fly)
- $132,046
- Comps found
- 12
Show comp detail 12 sales within ~0.75 mi
| Address | Dist | Beds/Ba | Sqft | Sold | Price | $/sf | Match |
|---|---|---|---|---|---|---|---|
| 1330 Chambers Rd | 0.22mi | 3/2.0 (+1) | 1,339 (+4%) | 3mo | $139,900 | $104 | 70 |
| 9820 Lorna Ln | 0.43mi | 2/1.0 | 1,338 (+4%) | 3mo | $119,900 | $90 | 70 |
| 1325 Kappel Dr | 0.14mi | 3/1.0 (+1) | 1,414 (+10%) | 2mo | $139,000 | $98 | 70 |
| 9863 Eastdell Dr | 0.24mi | 3/1.0 (+1) | 1,126 (-12%) | 1mo | $139,900 | $124 | 63 |
| 1523 Fir Dr | 0.28mi | 3/1.0 (+1) | 1,144 (-11%) | 2mo | $45,000 | $39 | 62 |
| 312 Ward Dr | 0.42mi | 3/2.0 (+1) | 1,375 (+7%) | 1mo | $145,000 | $105 | 59 |
| 1102 Thatcher Ave | 0.68mi | 2/1.0 | 1,202 (-6%) | 2mo | $145,000 | $121 | 56 |
| 1007 Hutton Pl | 0.73mi | 2/2.0 | 1,214 (-5%) | 2mo | $36,000 | $30 | 51 |
| 38 Bayview Ct | 0.42mi | 3/1.0 (+1) | 1,472 (+15%) | 4mo | $124,900 | $85 | 47 |
| 945 Edgehill Dr | 0.51mi | 3/1.0 (+1) | 1,110 (-13%) | 3mo | $114,900 | $104 | 46 |
| 10114 Saffron Dr | 0.72mi | 3/1.5 (+1) | 1,445 (+13%) | 0mo | $149,500 | $103 | 38 |
| 9701 Glen Owen Dr | 0.72mi | 3/1.5 (+1) | 1,120 (-13%) | 3mo | $69,900 | $62 | 36 |
Match score weights: distance 35% · size 25% · config 20% · recency 20%. Top-matched comps best support the ARV.
Projected returns pro-forma
-3.0% appreciation · 8.0% rent growth · sell at horizon
- IRR
- -8.7%
- Equity multiple
- 0.67×
- Total profit
- $-13,320
- Equity at exit
- $21,247
- IRR
- 6.4%
- Equity multiple
- 1.59×
- Total profit
- $23,350
- Equity at exit
- $12,321
Cash invested: $39,900 (down + closing). Projections, not guarantees.
Landlord ↔ Tenant lean methodology
- Overall (STATE)
- 81 Strongly Landlord-Friendly
- State Missouri
- 81 Strongly Landlord-Friendly · R+10
- County
- — inherits STATE
- City
- — inherits STATE
ZIP-level market 63135
- Rents YoY
- 9.0%
- Active inventory
- 165
- Price-to-rent
- 9.2×
Monthly cashflow live
- Estimated rent
- $1,294 high interval (Pro) →
- Mortgage (P&I)
- −$747
- Tax from tax record
- −$170 /mo · $2,041/yr
- Insurance
- −$59
- HOA
- −$0
- Vacancy / Maint / Mgmt
- −$272
- Net cashflow
- $46
Break-even live
Sensitivity live
| Price | -10% $126 | -5% $86 | +0% $46 | +5% $5 | +10% $-35 |
|---|---|---|---|---|---|
| Rent | -10% $-56 | -5% $-5 | +0% $46 | +5% $97 | +10% $148 |
| Rate | -1.0pp $118 | -0.5pp $82 | base $46 | +0.5pp $9 | +1.0pp $-29 |
UW: 25.0% down · 7.5% · 30yr · 1.5% tax · 5.0% vac · 8.0% maint · 8.0% mgmt
Financing live
Cash to close
- Down payment
- $35,625
- Closing costs
- $4,275
- Reserves months
- —
- Total cash needed
- —
Loan-product check · same deal, 3 products live
Conventional
25% down · 7.5% · 30yr
- Down + closing
- —
- Monthly P&I
- —
- Monthly cashflow
- —
- DSCR
- —
- Eligible?
- —
Personal DTI + credit; lowest rate.
DSCR
20% down · 8.5% · 30yr
- Down + closing
- —
- Monthly P&I
- —
- Monthly cashflow
- —
- DSCR
- —
- Eligible?
- —
No personal income docs; deal must DSCR.
Hard money
10% down · 12.0% · 12mo
- Down + closing
- —
- Monthly P&I
- —
- Monthly cashflow
- —
- DSCR
- —
- Eligible?
- —
Short-term bridge; refi at stabilization.
Rent comps 40 comps
| Address | Beds | Baths | Sqft | Rent | $/sqft | DOM | Units | Dist |
|---|---|---|---|---|---|---|---|---|
| 9845 Dennis Dr Saint Louis, MO | 3.0 | 1.0 | 960 | $1,550 | $1.61 | 14d | 1 | 0.31mi |
| 9845 Dennis Dr Saint Louis, MO | 3.0 | 1.0 | 1251 | $1,200 | $0.96 | 0d | 1 | 0.31mi |
| 104 Fenwick Dr Saint Louis, MO | 3.0 | 1.0 | 960 | $1,250 | $1.30 | 25d | 1 | 0.33mi |
| 9850 Dennis Dr Saint Louis, MO | 2.0 | 1.0 | 1032 | $1,175 | $1.14 | 45d | 1 | 0.33mi |
| 9868 Lorna Ln Saint Louis, MO | 3.0 | 1.0 | 1032 | $1,175 | $1.14 | 45d | 1 | 0.45mi |
| 9717 Dennis Dr Saint Louis, MO | 3.0 | 1.0 | 1056 | $1,323 | $1.25 | 45d | 1 | 0.47mi |
| 9839 Medford Dr Saint Louis, MO | 3.0 | 1.0 | 912 | $1,095 | $1.20 | 45d | 1 | 0.48mi |
| 9750 Lorna Ln Saint Louis, MO | 3.0 | 1.0 | 1032 | $1,100 | $1.07 | 45d | 1 | 0.49mi |
| 945 Edgehill Dr Saint Louis, MO | 3.0 | 1.0 | 1110 | $1,575 | $1.42 | 45d | 1 | 0.49mi |
| 9840 Medford Dr Saint Louis, MO | 3.0 | 1.0 | 912 | $1,095 | $1.20 | 45d | 1 | 0.51mi |
| 9725 Medford Dr Saint Louis, MO | 3.0 | 1.0 | 912 | $1,485 | $1.63 | 45d | 1 | 0.54mi |
| 1550 Northwinds Estates Dr St. Louis, MO | 1.0–2.0 | 1.0–1.5 | 877 | $1,050 | $1.20 | 45d | 1 | 0.57mi |
| 1733 Kappel Ave Saint Louis, MO | 3.0 | 1.0 | 912 | $1,250 | $1.37 | 25d | 1 | 0.60mi |
| 227 Meadowcrest Dr Saint Louis, MO | 3.0 | 1.0 | 960 | $1,500 | $1.56 | 45d | 1 | 0.62mi |
| 1654 Mowbry Ln Saint Louis, MO | 3.0 | 1.0 | 936 | $1,300 | $1.39 | 25d | 1 | 0.62mi |
| 338 La Motte Ln Saint Louis, MO | 2.0 | 1.0 | 904 | $1,150 | $1.27 | 45d | 1 | 0.64mi |
| 338 La Motte Ln Saint Louis, MO | 2.0 | 1.0 | 904 | $1,150 | $1.27 | 0d | 1 | 0.64mi |
| 13 N Hartnett Ave Saint Louis, MO | 3.0 | 1.0 | 1140 | $1,400 | $1.23 | 12d | 1 | 0.66mi |
| 307 Coppinger Dr Saint Louis, MO | 3.0 | 1.0 | 960 | $1,095 | $1.14 | 19d | 1 | 0.69mi |
| 296 Meadowcrest Dr Saint Louis, MO | 3.0 | 1.0 | 960 | $1,550 | $1.61 | 16d | 1 | 0.69mi |
| 249 S Hartnett Ave Saint Louis, MO | 3.0 | 1.0 | 960 | $1,220 | $1.27 | 25d | 1 | 0.71mi |
| 35 S Barat Ave Saint Louis, MO | 2.0 | 1.0 | 984 | $1,150 | $1.17 | 0d | 1 | 0.72mi |
| 920 Hutton Pl Saint Louis, MO | 3.0 | 1.0 | 912 | $1,195 | $1.31 | 45d | 1 | 0.72mi |
| 1547 Babcock Dr Saint Louis, MO | 3.0 | 1.0 | 1014 | $1,480 | $1.46 | 45d | 1 | 0.85mi |
| 9547 Glen Owen Dr Saint Louis, MO | 2.0 | 1.0 | 923 | $985 | $1.07 | 25d | 1 | 0.86mi |
| 10329 Chesley Dr Saint Louis, MO | 3.0 | 1.0 | 1014 | $1,350 | $1.33 | 25d | 1 | 0.91mi |
| 401 Millman Dr Saint Louis, MO | 3.0 | 1.0 | 1008 | $1,450 | $1.44 | 18d | 1 | 0.93mi |
| 9709 Balboa Dr Saint Louis, MO | 3.0 | 1.0 | 1000 | $1,600 | $1.60 | 45d | 1 | 0.93mi |
| 10304 Bon Oak Dr Saint Louis, MO | 3.0 | 1.5 | 1500 | $1,250 | $0.83 | 45d | 1 | 1.03mi |
| 338 Saint Louis Ave Saint Louis, MO | 3.0 | 1.0 | 1200 | $1,200 | $1.00 | 45d | 1 | 1.06mi |
| 6188 Dupree Ave Saint Louis, MO | 3.0 | 1.5 | 972 | $1,300 | $1.34 | 45d | 1 | 1.06mi |
| 6170 Emerald Ave Saint Louis, MO | 3.0 | 1.0 | 1286 | $1,500 | $1.17 | 16d | 1 | 1.10mi |
| 6170 Emerald Ave Saint Louis, MO | 3.0 | 1.0 | 1286 | $1,425 | $1.11 | 3d | 1 | 1.10mi |
| 10078 Green Valley Dr Saint Louis, MO | 3.0 | 1.0 | 900 | $1,325 | $1.47 | 9d | 1 | 1.10mi |
| 110 Paul Ave Saint Louis, MO | 3.0 | 1.0 | 875 | $1,025 | $1.17 | 0d | 1 | 1.15mi |
| 10239 Green Valley Dr Saint Louis, MO | 3.0 | 1.0 | 1014 | $1,395 | $1.38 | 25d | 1 | 1.21mi |
| 419 S Florissant Rd Ferguson, MO | 2.0 | 1.0 | 1100 | $1,200 | $1.09 | 45d | 1 | 1.27mi |
| 10129 Cavalier Ct Saint Louis, MO | 3.0 | 1.5 | 912 | $1,250 | $1.37 | 25d | 1 | 1.32mi |
| 62 Capitol Hill Dr Saint Louis, MO | 3.0 | 2.0 | 1239 | $1,250 | $1.01 | 45d | 1 | 1.36mi |
| 617 Tesmore Pl Saint Louis, MO | 2.0 | 1.0 | 877 | $1,200 | $1.37 | 45d | 1 | 1.36mi |
Listing history 3 events
-
2026-06-08status $142,500 Pending 2 DOM
-
2026-06-07remarks 633-char remark
-
2026-06-07$142,500 Active 2 DOM
ⓘ Source: listings_history table (triggers on properties + properties_extension) + one-shot
backfill from property_details.listing_events for pre-trigger history.
Tax reassessment forecast MO · Resets to sale price
- Current annual tax
- $2,041 · $170/mo
- Projected year-2 tax
- $2,041 · $170/mo
- Expected delta
- $0/yr ($0/mo · 0.0%)
ⓘ Screening estimate from a state-policy table — verify with the county assessor before closing.
Climate risk First Street
- Flood 1/10 Low FEMA zone X (unshaded) · 0% chance over 30 yrs
- Wildfire 1/10 Low
- Heat 5/10 Major 7 d/yr ≥106°F today · 20 d/yr by 30 yrs out
- Wind 2/10 Low 100% chance of damaging wind over 30 yrs
- Air quality 4/10 Moderate 4 unhealthy d/yr today · 5 by 30 yrs out
Nearby sold comps map
Loading sold comps map…
Walkable amenities ~0.75 mi
Loading nearby amenities…
Taxation est. · year 1
- Rental income
- $15,533
- − Mortgage interest
- −$7,982
- − Property taxes
- −$2,041
- − Insurance
- −$712
- − Repairs & maintenance
- −$1,243
- − Management
- −$1,243
- − Depreciation
- −$4,145
- Taxable loss
- −$1,834
- Est. tax savings @ 24.0%
- +$440
- After-tax cash flow
- $990/yr
For passive investors: Depreciation is non-cash, so a rental often shows a tax loss while cash-flowing — sheltering income. Rental losses are passive: they offset passive income freely, and up to $25,000/yr can offset ordinary (W-2) income if you actively participate and your MAGI is under $100k (phasing out to $0 by $150k); unused losses carry forward. On sale, claimed depreciation is recaptured at up to 25%, and gains may owe capital-gains tax (a 1031 exchange can defer both). Figures are a year-1 estimate at your 24.0% rate — not tax advice; consult a CPA.
Schools (NCES district)
- District
- Ferguson-Florissant R-II
- NCES district ID
- 2912010
- Math proficiency
- 7% ▼ -9.00%
- Reading proficiency
- 20% ▼ -6.00%
- Median HH income
- $44,610
- Composite
- 11.96/100
- National rank
- #9666
- State rank
- #311 of 324 in MO
Livability — Dellwood
- Score
- 66/100
- State rank
- #239
- US rank
- #11618
Category grades
Schools grade is shown separately in the Schools card above.
Census & demographics
- Census place
- Dellwood, MO
- County
- Saint Louis County · 888,823 people
- Metro
- St. Louis, MO-IL
- Population (ZIP)
- 18,381
- Household income
- $52,328
- Rent vs Own
- Severe rent burden
- 957.0
Population outlook (St. Louis County) Hauer SSP2
- Today (2025)
- 1,025,227 people
- By 2030
- 1,028,023 · +0.3%
- By 2040
- 1,020,940 · -0.4%
- By 2050
- 1,007,280 · -1.8%
- By 2075
- 987,277 · -3.7%
- By 2100
- 921,984 · -10.1%
Race, ethnicity, and origin ACS 2023
- Neighborhood character
- Predominantly Black (66%)
- Race & ethnicity
- Black 66% White 28% Two or more races 3% Hispanic / Latino 2%
- Common ancestry
- Lithuanian 1% Iranian 1% Romanian 1%
- Foreign-born
- 1% · Canada
- Languages at home
- 95% English-only · Spanish 4%
Political lean MEDSL · St. Louis
- 2024 margin
- Strong D (+23.4) · D 60.8% · R 37.4% · Other 1.7%
- 2008→2024 swing
- +3.5pp toward D · 2008: 19.9pp · 2024: 23.4pp
- All cycles
- 2024: D+23.4 2020: D+24.0 2016: D+16.2 2012: D+13.7 2008: D+19.9
Not yet ingested
- Civics
- —
Market trends
- HPI YoY
- ▼ -152.56%
- Current HPI
- 138.6781
- Rent YoY
- ▲ 9.03%
- Metro
- St. Louis, MO-IL
- State GDP YoY
- ▲ 1.84%
- F500 in state
- 20
Industry mix (Fortune 500 HQ in MO)
| Industry | F500 HQs | Revenue |
|---|---|---|
| Healthcare | 1 | $163B |
|
||
| Insurance | 1 | $21B |
|
||
| Industrial Technology | 1 | $17B |
|
||
| Retail | 1 | $16B |
|
||
| Industrial Distribution | 1 | $10B |
|
||
| Utilities | 1 | $9B |
|
||
Price history
1 event — show timeline
- 2026-06-05 Listed $142,500 MARIS as Distributed by MLS Grid
Property tax history
+5.4%/yrLatest (2022): $2,041 · +0.5% YoY. Source: county tax records.
Cash-flow waterfall
monthlySold comps — $/sqft
last 12 mo · ≤1 miLoading sold comps…