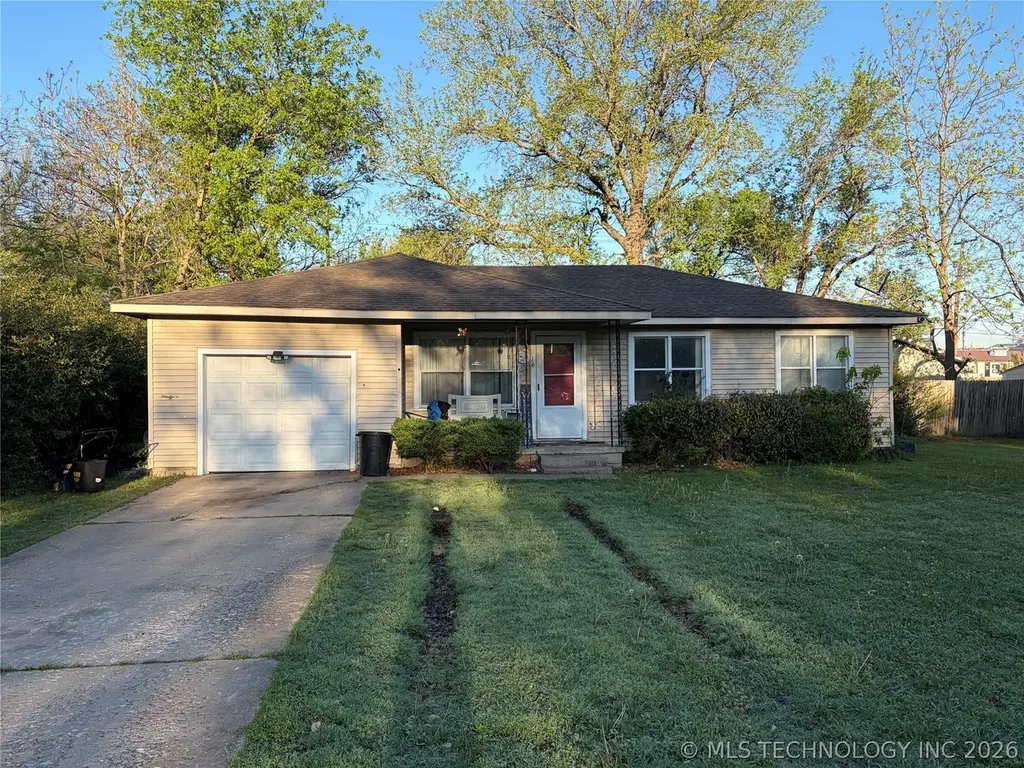
16 S Indianola St · Pryor Creek, OK
Flood risk 1/10 · Minimal
- FEMA flood zone
- X (unshaded)
- Chance of flooding over 30 yrs
- 0.0%
- Est. flood insurance / yr
- $507 – $1,088
Fire risk 5/10 · Moderate
- Est. fire insurance / yr
- $2,463 – $4,575
Heat risk 7/10 · Major
- Hot days now (above 112°F)
- 7 days/yr
- Hot days in 30 yrs
- 20 days/yr
Wind risk 2/10 · Minimal
- Chance of severe wind over 30 yrs
- 3.0%
Air-quality risk 2/10 · Minimal
- Unhealthy air days now
- 1 days/yr
- Unhealthy air days in 30 yrs
- 1 days/yr
Risk factors via First Street. Map © Google.
Why this score? — see what drove the D grade
The composite is a weighted blend of 9 inputs, each scored 0–100. Each bar is that input's sub-score; the figure is the points it added to the 100-point composite (weight × sub-score).
- Cash flow +16.4/30.0
- ARV discount +9.2/15.0
- DSCR +5.1/10.0
- 1% rule +3.7/10.0
- Livability +3.5/5.0
- Rent growth +2.5/5.0
- Condition / age +2.5/5.0
- Schools +1.9/10.0
- Appreciation +0.0/10.0
$155,000
🖨 Deal sheet (PDF) 📄 Offer letter ✓ Due diligence
Listing remarks
Good little starter home in town close to everything with a large master suite and a fenced-in yard out back.
Key facts
- 0.24 acre lot
- Garage
- Built 1960
Property features AI
Exterior
- Parking: Attached garage (1 car)
- Security: Smoke detector(s)
- Utilities: Electricity available; Phone service available; Public water; Public sewer
- Home design: Single-story; Faces east; Slab foundation
- Construction: Wood frame construction; Asphalt/fiberglass roof; Built according to public records
- Exterior features: Covered porch; Chain link fencing; Mature trees on the lot
Interior
- Kitchen: Microwave; Oven; Range
- Flooring: Hardwood floors
- Bathrooms: 2 full bathrooms
- Heating & cooling: Central heating (electric); Central air conditioning
- Interior features: High-speed internet available; Wired for data; Ceiling fan(s); Electric oven and range connections
- Laundry & utility: Washer hookup; Electric dryer hookup; Electric water heater
Neighborhood map
What this means for you Summary
Snapshot
- This is a 3-bed/2.0-bath single-family listed at $155k.
Deal economics
- At list price, monthly cash flow is $89 ($1k/yr) — positive.
- The deal already cash-flows at list — no discount required.
- To meet the 1% rule (rent ≥ 1% of price), the offer needs to be $134k (13.5% below list).
- Recommended offer: $134k (13.5% below list) — sets the bar for 1% rule.
- Cap rate 7.0% vs local median 3.8% in Pryor Creek — top-decile yield for the area; either an underpriced asset or a hidden risk that comps aren't pricing in. Stress-test before assuming the spread holds.
Location & tenants
- Location reads 69/100 on livability (#51 in OK) — a middle-class / working-renter tenant base. Strengths: cost of living A+, housing A+, health & safety A+; Watch: crime D-, amenities F, commute F.
- Pryor (town): math 24% / reading 21% proficiency, ranked #143 of 270 in OK (top 53%) — low school quality limits family demand, transient renter base, plan for 1-2y turnover.
- Zoned schools: Jefferson Es (math 27% / reading 27%, grade F, #311 of 845 statewide, top 40%, 281 students, 0% FRL); Pryor Ms (math 19% / reading 21%, grade F, #158 of 345 statewide, top 47%, 650 students, 0% FRL); Pryor Hs (math 27% / reading 32%, grade F, #96 of 447 statewide, top 26%, 800 students, 0% FRL) — zoned schools average 0% FRL vs 51% district-wide (51 pts lower); this property's tenant base skews higher-income than the district average.
- Market conditions: 162 active listings in the ZIP; 5 comparable units currently listed for rent nearby; rentals leasing fast (median 0d on market — plan ~1-2 weeks tenant-placement turnaround); 23 units permitted in Mayes County in 2024 (0 in 5+ unit buildings).
Forward outlook
- Local home prices are declining (-3.0%/yr); year-one equity from $1k of loan paydown is wiped out by about $5k of value loss. Plan a longer hold.
- Mayes County population projected at -10% by 2050 — secular population decline; favor cash flow + early exit over multi-decade hold.
Negotiation context
- It's been on market 74 days — a 6% lower offer ($146k) is reasonable based on typical stale-listing flexibility.
- Current owner paid $42k; list at $155k implies a 265% gain — meaningful room to come down on a strong offer.
Risks & watch-outs
- Climate carrying-cost: moderate wildfire risk; extreme-heat days projected 7→20/yr by 2055 (HVAC capex compounding) — expect insurance premiums to compound above CPI over the hold.
Questions for the listing agent
- It's been on market 74 days. Have you received any prior offers? Is the seller open to a 13% concession, seller financing, or rate buy-down credit?
- Built in 1960 — when were the roof, HVAC, electrical panel, plumbing, and water heater last replaced?
- Why hasn't it sold? Are there any deal-killer items the seller is aware of (foundation, flood, title, zoning, code violations)?
- Is there a deadline driving the sale (1031 exchange, divorce, estate, relocation)? That informs how much negotiation room exists.
- Schools are D-rated, which usually means shorter tenancies and higher turnover. Who's the typical renter profile here, and what's been the actual vacancy rate?
- Crime grade is D in this area — have there been break-ins, vandalism, or insurance claims at this property in the last 3 years? What carrier currently insures it and at what premium?
- The area grade is low — what's the realistic commute time and amenity access for the typical tenant pool here? Any planned neighborhood developments (good or bad) we should know about?
- What's the average days-on-market for RENTAL listings here right now (not sales)? A rising rental-DOM trend means longer vacancies and softer asking-rent achievability than the comps imply.
- What's the recent tenant-quality profile in this submarket — average credit score on applications, eviction rate, late-payment / NSF rate, and stable-employment percentage? A property-management company in the area should have these aggregated.
- How much new for-sale + rental construction is in the pipeline within 1–3 miles? Heavy new supply typically softens prices + rents 12–24 months out; constrained supply supports both.
Investment metrics
- 1% rule
- 0.87% ✗
- Cap rate
- 6.98%
- Cash-on-cash
- 2.45%
- DSCR
- 1.11
- GRM
- 9.6
CMA / ARV
- ARV (on-the-fly)
- $161,024
- Comps found
- 12
Show comp detail 12 sales within ~0.75 mi
| Address | Dist | Beds/Ba | Sqft | Sold | Price | $/sf | Match |
|---|---|---|---|---|---|---|---|
| 7 S Orphan St | 0.10mi | 2/2.0 (-1) | 1,068 (-10%) | 3mo | $43,000 | $40 | 71 |
| 403 N Ora St | 0.62mi | 3/1.0 | 1,176 (-1%) | 1mo | $88,750 | $75 | 65 |
| 15 Irving St | 0.42mi | 3/1.0 | 1,152 (-3%) | 9mo | $140,000 | $122 | 64 |
| 107 S Coo-y-yah St Unit B | 0.28mi | 3/2.0 | 1,334 (+13%) | 3mo | $239,000 | $179 | 64 |
| 1400 Damon Dr | 0.57mi | 3/2.0 | 1,252 (+6%) | 2mo | $150,000 | $120 | 62 |
| 320 N Hogan St | 0.57mi | 2/1.0 (-1) | 1,209 (+2%) | 4mo | $137,000 | $113 | 58 |
| 309 N Fairland St | 0.60mi | 3/1.0 | 1,116 (-6%) | 2mo | $179,900 | $161 | 57 |
| 404 N Oklahoma St | 0.73mi | 4/2.0 (+1) | 1,158 (-2%) | 6mo | $182,000 | $157 | 52 |
| 232 Eastmanor Cir | 0.62mi | 3/1.0 | 1,070 (-10%) | 6mo | $182,000 | $170 | 46 |
| 415 N Orphan St | 0.67mi | 3/1.0 | 1,080 (-9%) | 5mo | $87,500 | $81 | 46 |
| 223 E Manor Cir | 0.63mi | 3/1.0 | 1,085 (-8%) | 9mo | $175,000 | $161 | 45 |
| 27 Payne St | 0.57mi | 3/1.0 | 1,056 (-11%) | 10mo | $144,000 | $136 | 43 |
Match score weights: distance 35% · size 25% · config 20% · recency 20%. Top-matched comps best support the ARV.
Projected returns pro-forma
-3.0% appreciation · 3.0% rent growth · sell at horizon
- IRR
- -12.5%
- Equity multiple
- 0.55×
- Total profit
- $-19,519
- Equity at exit
- $23,111
- IRR
- -3.4%
- Equity multiple
- 0.77×
- Total profit
- $-9,903
- Equity at exit
- $13,402
Cash invested: $43,400 (down + closing). Projections, not guarantees.
Landlord ↔ Tenant lean methodology
- Overall (STATE)
- 83 Strongly Landlord-Friendly
- State Oklahoma
- 83 Strongly Landlord-Friendly · R+20
- County
- — inherits STATE
- City
- — inherits STATE
ZIP-level market 74361
- Active inventory
- 162
- Price-to-rent
- 9.6×
Monthly cashflow live
- Estimated rent
- $1,341 high interval (Pro) →
- Mortgage (P&I)
- −$813
- Tax from tax record
- −$93 /mo · $1,119/yr
- Insurance
- −$65
- HOA
- −$0
- Vacancy / Maint / Mgmt
- −$282
- Net cashflow
- $89
Break-even live
Sensitivity live
| Price | -10% $176 | -5% $132 | +0% $89 | +5% $45 | +10% $1 |
|---|---|---|---|---|---|
| Rent | -10% $-17 | -5% $36 | +0% $89 | +5% $142 | +10% $194 |
| Rate | -1.0pp $167 | -0.5pp $128 | base $89 | +0.5pp $48 | +1.0pp $8 |
UW: 25.0% down · 7.5% · 30yr · 1.5% tax · 5.0% vac · 8.0% maint · 8.0% mgmt
Financing live
Cash to close
- Down payment
- $38,750
- Closing costs
- $4,650
- Reserves months
- —
- Total cash needed
- —
Loan-product check · same deal, 3 products live
Conventional
25% down · 7.5% · 30yr
- Down + closing
- —
- Monthly P&I
- —
- Monthly cashflow
- —
- DSCR
- —
- Eligible?
- —
Personal DTI + credit; lowest rate.
DSCR
20% down · 8.5% · 30yr
- Down + closing
- —
- Monthly P&I
- —
- Monthly cashflow
- —
- DSCR
- —
- Eligible?
- —
No personal income docs; deal must DSCR.
Hard money
10% down · 12.0% · 12mo
- Down + closing
- —
- Monthly P&I
- —
- Monthly cashflow
- —
- DSCR
- —
- Eligible?
- —
Short-term bridge; refi at stabilization.
Rent comps 5 comps
| Address | Beds | Baths | Sqft | Rent | $/sqft | DOM | Units | Dist |
|---|---|---|---|---|---|---|---|---|
| 111 N Elliott St Unit A Pryor, OK | 2.0 | 1.0 | 1000 | $1,250 | $1.25 | 16d | 1 | 0.22mi |
| 202 N Ora St Pryor, OK | 3.0 | 2.0 | 1291 | $1,600 | $1.24 | 21d | 1 | 0.33mi |
| 1220 SE 9th St Pryor, OK | 2.0–3.0 | 1.0–1.5 | 909 | $1,469 | $1.62 | 0d | 6 | 1.01mi |
| 1501 Meadow Trace Dr Unit 1 Pryor, OK | 2.0 | 1.5 | 1000 | $1,029 | $1.03 | 0d | 4 | 1.24mi |
| 1707 S Elliott St Pryor, OK | 1.0–2.0 | 1.0–2.0 | 870 | $1,275 | $1.47 | 0d | 1 | 1.40mi |
Listing history 21 events
-
2026-06-21days on market $155,000 Active 74 DOM
-
2026-06-18days on market $155,000 Active 71 DOM
-
2026-06-17days on market $155,000 Active 70 DOM
-
2026-06-16days on market $155,000 Active 69 DOM
-
2026-06-15days on market $155,000 Active 68 DOM
-
2026-06-14days on market $155,000 Active 66 DOM
-
2026-06-13days on market $155,000 Active 65 DOM
-
2026-06-10days on market $155,000 Active 63 DOM
-
2026-06-09days on market $155,000 Active 62 DOM
-
2026-06-08days on market $155,000 Active 61 DOM
-
2026-06-07days on market $155,000 Active 60 DOM
-
2026-06-05days on market $155,000 Active 57 DOM
-
2026-06-03days on market $155,000 Active 56 DOM
-
2026-06-02days on market $155,000 Active 55 DOM
-
2026-06-01days on market $155,000 Active 54 DOM
-
2026-05-31days on market $155,000 Active 53 DOM
-
2026-05-31days on market $155,000 Active 52 DOM
-
2026-05-17price $155,000
-
2026-04-21price $166,000
-
2026-04-08$171,500 Active
-
2000-07-14soldstatus $42,500
ⓘ Source: listings_history table (triggers on properties + properties_extension) + one-shot
backfill from property_details.listing_events for pre-trigger history.
Tax reassessment forecast OK · Resets to sale price
- Current annual tax
- $1,119 · $93/mo
- Projected year-2 tax
- $1,395 · $116/mo
- Expected delta
- +$276/yr (+$23/mo · 24.7%)
ⓘ Screening estimate from a state-policy table — verify with the county assessor before closing.
Climate risk First Street
- Flood 1/10 Low FEMA zone X (unshaded) · 0% chance over 30 yrs
- Wildfire 5/10 Major
- Heat 7/10 Severe 7 d/yr ≥112°F today · 20 d/yr by 30 yrs out
- Wind 2/10 Low 3% chance of damaging wind over 30 yrs
- Air quality 2/10 Low 1 unhealthy d/yr today · 1 by 30 yrs out
Nearby sold comps map
Loading sold comps map…
Walkable amenities ~0.75 mi
Loading nearby amenities…
Taxation est. · year 1
- Rental income
- $16,089
- − Mortgage interest
- −$8,682
- − Property taxes
- −$1,119
- − Insurance
- −$775
- − Repairs & maintenance
- −$1,287
- − Management
- −$1,287
- − Depreciation
- −$4,509
- Taxable loss
- −$1,570
- Est. tax savings @ 24.0%
- +$377
- After-tax cash flow
- $1,439/yr
For passive investors: Depreciation is non-cash, so a rental often shows a tax loss while cash-flowing — sheltering income. Rental losses are passive: they offset passive income freely, and up to $25,000/yr can offset ordinary (W-2) income if you actively participate and your MAGI is under $100k (phasing out to $0 by $150k); unused losses carry forward. On sale, claimed depreciation is recaptured at up to 25%, and gains may owe capital-gains tax (a 1031 exchange can defer both). Figures are a year-1 estimate at your 24.0% rate — not tax advice; consult a CPA.
Schools (NCES district)
- District
- Pryor
- NCES district ID
- 4025200
- Math proficiency
- 24% ▼ -13.00%
- Reading proficiency
- 21% ▼ -13.00%
- Median HH income
- $44,306
- Composite
- 19.46/100
- National rank
- #8774
- State rank
- #143 of 270 in OK
Livability — Pryor Creek
- Score
- 69/100
- State rank
- #51
- US rank
- #8653
Category grades
Schools grade is shown separately in the Schools card above.
Census & demographics
- Census place
- Pryor Creek, OK
- County
- Mayes County · 17,612 people
- City population
- 17,582
- Metro
- nan
- Population (ZIP)
- 17,612
- Household income
- $58,681
- Rent vs Own
- Severe rent burden
- 326.0
Population outlook (Mayes County) Hauer SSP2
- Today (2025)
- 39,941 people
- By 2030
- 39,172 · -1.9%
- By 2040
- 37,540 · -6.0%
- By 2050
- 35,854 · -10.2%
- By 2075
- 32,361 · -19.0%
- By 2100
- 28,054 · -29.8%
Race, ethnicity, and origin ACS 2023
- Neighborhood character
- Diverse neighborhood (Simpson 0.58)
- Race & ethnicity
- White 65% Native American 18% Two or more races 13% Hispanic / Latino 5%
- Common ancestry
- Slovak 3% Romanian 1% Serbian 1%
- Foreign-born
- 2% · Canada
- Languages at home
- 96% English-only · Spanish 2%
Political lean MEDSL · Mayes
- 2024 margin
- Solid R (+57.5) · D 20.3% · R 77.8% · Other 1.9%
- 2008→2024 swing
- -29.4pp toward R · 2008: -28.1pp · 2024: -57.5pp
- All cycles
- 2024: R+57.5 2020: R+55.1 2016: R+51.7 2012: R+33.3 2008: R+28.1
Not yet ingested
- Civics
- —
Market trends
- HPI YoY
- ▼ -145.81%
- Current HPI
- 247.7737
- Rent YoY
- —
- Metro
- nan
- State GDP YoY
- ▲ 1.55%
- F500 in state
- 6
Industry mix (Fortune 500 HQ in OK)
| Industry | F500 HQs | Revenue |
|---|---|---|
| Energy | 3 | $48B |
|
||
Price history
+264.7% since first listed4 events — show timeline
- 2026-05-17 Price Changed $155,000 MLS Technology, Inc.
- 2026-04-21 Price Changed $166,000 MLS Technology, Inc.
- 2026-04-08 Listed $171,500 MLS Technology, Inc.
- 2000-07-14 Sold (Public Records) $42,500 Public Records
Property tax history
+7.4%/yrLatest (2025): $1,119 · -4.2% YoY. Source: county tax records.
Cash-flow waterfall
monthlySold comps — $/sqft
last 12 mo · ≤1 miLoading sold comps…