710 E Booth St · Centralia, MO
Flood risk 1/10 · Minimal
- FEMA flood zone
- X (unshaded)
- Chance of flooding over 30 yrs
- 0.0%
- Est. flood insurance / yr
- $473 – $860
Fire risk 1/10 · Minimal
- Est. fire insurance / yr
- $1,054 – $1,958
Heat risk 3/10 · Minor
- Hot days now (above 106°F)
- 7 days/yr
- Hot days in 30 yrs
- 18 days/yr
Wind risk 2/10 · Minimal
- Chance of severe wind over 30 yrs
- —
Air-quality risk 2/10 · Minimal
- Unhealthy air days now
- 1 days/yr
- Unhealthy air days in 30 yrs
- 1 days/yr
Risk factors via First Street. Map © Google.
Why this score? — see what drove the B- grade
The composite is a weighted blend of 9 inputs, each scored 0–100. Each bar is that input's sub-score; the figure is the points it added to the 100-point composite (weight × sub-score).
- Cash flow +30.0/30.0
- 1% rule +10.0/10.0
- DSCR +10.0/10.0
- ARV discount +7.5/15.0
- Schools +3.9/10.0
- Livability +3.5/5.0
- Rent growth +2.5/5.0
- Condition / age +2.5/5.0
- Appreciation +0.0/10.0
$44,500
🖨 Deal sheet 📄 Offer letter ✓ Due diligence
Listing remarks MLS
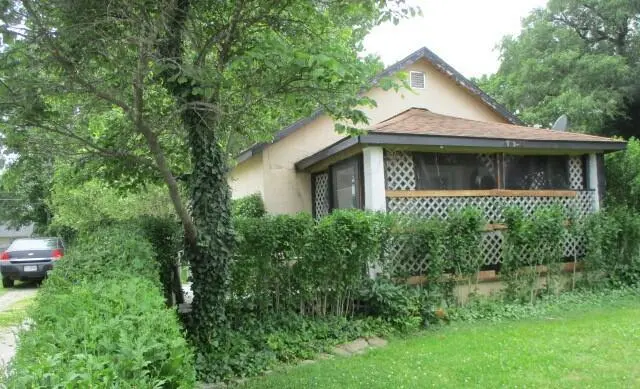
Opportunities like this don't last long. Roll up your sleeves and transform this diamond in the into your profitable investment!! Great location within walking distance to schools, library and city park. This is a home with a exterior located on a VERY large lot with large trees for shade and bushes for privacy. This home is being sold as.
Key facts
- Large trees
- Bushes for privacy
- Large lot
Tags
Property features AI
Exterior
- Parking: Attached garage and carport; 2 garage spaces
- Utilities: Public water
- Home design: Single-family residence; Residential property
- Exterior features: Screened, covered porch; Front porch; Rear porch; Deck; Shed(s); Partially wooded yard; Paved road access; Lot dimensions approximately 67 x 162.5
Interior
- Kitchen: Refrigerator
- Bedrooms: 1 room total
- Flooring: Vinyl flooring
- Bathrooms: 1 full bathroom
- Heating & cooling: Natural gas heating; Window air conditioning units
- Interior features: Accessible entrance; Crawl space basement
Neighborhood map
What this means for you Summary
Snapshot
- This is a 2-bed/1.0-bath single-family listed at $44k.
Deal economics
- At list price, monthly cash flow is $368 ($4k/yr) — positive.
- The deal already cash-flows at list — no discount required.
- Meets the 1% rule at list price ($833 rent vs $44k).
- Cap rate 16.2% vs local median 2.8% in Centralia — top-decile yield for the area; either an underpriced asset or a hidden risk that comps aren't pricing in. Stress-test before assuming the spread holds.
Location & tenants
- Location reads 70/100 on livability (#127 in MO) — a middle-class / working-renter tenant base. Strengths: crime A+, cost of living A+, housing A+; Watch: amenities F, commute F, health & safety F.
- Centralia R-VI (town): math 43% / reading 48% proficiency, ranked #82 of 324 in MO (top 25%) — families likely to look elsewhere, expect single-tenant / working-renter base with shorter leases.
- Zoned schools: Centralia Intermediate (math 40% / reading 50%, grade D-, #410 of 1,115 statewide, top 37%, 305 students, 32% FRL); Centralia High (math 52% / reading 62%, grade C, #51 of 521 statewide, top 11%, 406 students, 26% FRL) — zoned schools at 29% FRL track the district average.
- Market conditions: 71 active listings in the ZIP; 1,303 units permitted in Boone County in 2024 (549 in 5+ unit buildings).
Forward outlook
- Local home prices are declining (-3.0%/yr); year-one equity from $308 of loan paydown is wiped out by about $1k of value loss. Plan a longer hold.
- Boone County population projected at +36% by 2050 — long-run rental-demand tailwind backs the buy-and-hold thesis.
- At projected returns (-3.0% appreciation + 3.0% rent growth), your $12k cash investment doubles in ~4 years — after that, you're playing with house money.
Negotiation context
- Only 5 days on market — expect competitive offers; lowballing is unlikely to land.
- 2 sale attempts with the ask held roughly flat each time — persistent listings suggest the price (not the market) is what's stuck; bring a comps-based counter.
Risks & watch-outs
- Watch-outs: built in 1940 — expect roof / HVAC / electrical / plumbing capex.
Questions for the listing agent
- Built in 1940 — when were the roof, HVAC, electrical panel, plumbing, and water heater last replaced?
- Is there a deadline driving the sale (1031 exchange, divorce, estate, relocation)? That informs how much negotiation room exists.
- Schools are B-rated — typically a magnet for longer-tenancy family renters. What's the average tenant stay here, and is there a school-zone premium baked into asking?
- What's the average days-on-market for RENTAL listings here right now (not sales)? A rising rental-DOM trend means longer vacancies and softer asking-rent achievability than the comps imply.
- What's the recent tenant-quality profile in this submarket — average credit score on applications, eviction rate, late-payment / NSF rate, and stable-employment percentage? A property-management company in the area should have these aggregated.
- How much new for-sale + rental construction is in the pipeline within 1–3 miles? Heavy new supply typically softens prices + rents 12–24 months out; constrained supply supports both.
Investment metrics
- 1% rule
- 1.87% ✓
- Cap rate
- 16.22%
- Cash-on-cash
- 35.46%
- DSCR
- 2.58
- GRM
- 4.4
CMA / ARV
- ARV (on-the-fly)
- $144,800
- Comps found
- 10
Show comp detail 10 sales within ~0.75 mi
| Address | Dist | Beds/Ba | Sqft | Sold | Price | $/sf | Match |
|---|---|---|---|---|---|---|---|
| 719 Rodemyre St | 0.25mi | 2/1.0 | 840 (+5%) | 19mo | $146,900 | $175 | 64 |
| 445 S Rollins St | 0.40mi | 2/1.0 | 896 (+12%) | 1mo | $167,500 | $187 | 60 |
| 616 E Booth St | 0.06mi | 2/1.0 | 902 (+13%) | 23mo | $147,500 | $164 | 57 |
| 614 S Rollins St | 0.48mi | 2/1.0 | 896 (+12%) | 2mo | $35,000 | $39 | 56 |
| 214 E Singleton St | 0.36mi | 1/1.0 (-1) | 816 (+2%) | 22mo | $150,000 | $184 | 56 |
| 401 S Coulter St | 0.57mi | 3/1.0 (+1) | 768 (-4%) | 12mo | $149,900 | $195 | 52 |
| 610 E Brick St | 0.64mi | 2/1.0 | 800 (0%) | 23mo | $155,000 | $194 | 51 |
| 615 S Central St | 0.67mi | 2/1.0 | 832 (+4%) | 23mo | $139,500 | $168 | 43 |
| 707 S Green St | 0.66mi | 3/1.0 (+1) | 884 (+10%) | 11mo | $160,000 | $181 | 38 |
| 601 S Green St | 0.59mi | 2/1.0 | 694 (-13%) | 20mo | $85,000 | $122 | 33 |
Match score weights: distance 35% · size 25% · config 20% · recency 20%. Top-matched comps best support the ARV.
Projected returns pro-forma
-3.0% appreciation · 3.0% rent growth · sell at horizon
- IRR
- 31.1%
- Equity multiple
- 2.30×
- Total profit
- $16,239
- Equity at exit
- $6,635
- IRR
- 38.2%
- Equity multiple
- 4.56×
- Total profit
- $44,341
- Equity at exit
- $3,848
Cash invested: $12,460 (down + closing). Projections, not guarantees.
Landlord ↔ Tenant lean methodology
- Overall (STATE)
- 81 Strongly Landlord-Friendly
- State Missouri
- 81 Strongly Landlord-Friendly · R+10
- County
- — inherits STATE
- City
- — inherits STATE
ZIP-level market 65240
- Home prices YoY
- -20.6%
- Active inventory
- 71
- Price-to-rent
- 4.4×
Monthly cashflow live
- Estimated rent
- $833 medium interval (Pro) →
- Mortgage (P&I)
- −$233
- Tax from tax record
- −$38 /mo · $460/yr
- Insurance
- −$19
- HOA
- −$0
- Vacancy / Maint / Mgmt
- −$175
- Net cashflow
- $368
Break-even live
UW: 25.0% down · 7.5% · 30yr · 1.5% tax · 5.0% vac · 8.0% maint · 8.0% mgmt
Financing live
Cash to close
- Down payment
- $11,125
- Closing costs
- $1,335
- Reserves months
- —
- Total cash needed
- —
Loan-product check · same deal, 3 products live
Conventional
25% down · 7.5% · 30yr
- Down + closing
- —
- Monthly P&I
- —
- Monthly cashflow
- —
- DSCR
- —
- Eligible?
- —
Personal DTI + credit; lowest rate.
DSCR
20% down · 8.5% · 30yr
- Down + closing
- —
- Monthly P&I
- —
- Monthly cashflow
- —
- DSCR
- —
- Eligible?
- —
No personal income docs; deal must DSCR.
Hard money
10% down · 12.0% · 12mo
- Down + closing
- —
- Monthly P&I
- —
- Monthly cashflow
- —
- DSCR
- —
- Eligible?
- —
Short-term bridge; refi at stabilization.
Listing history 6 events
-
2026-06-03days on market $44,500 Active 5 DOM
-
2026-06-02days on market $44,500 Active 4 DOM
-
2026-06-01days on market $44,500 Active 3 DOM
-
2026-05-31days on market $44,500 Active 2 DOM
-
2026-05-30remarks 341-char remark
-
2026-05-30$44,500 Active 1 DOM
ⓘ Source: listings_history table (triggers on properties + properties_extension) + one-shot
backfill from property_details.listing_events for pre-trigger history.
Tax reassessment forecast MO · Resets to sale price
- Current annual tax
- $460 · $38/mo
- Projected year-2 tax
- $460 · $38/mo
- Expected delta
- $0/yr ($0/mo · 0.0%)
ⓘ Screening estimate from a state-policy table — verify with the county assessor before closing.
Climate risk First Street
- Flood 1/10 Low FEMA zone X (unshaded) · 0% chance over 30 yrs
- Wildfire 1/10 Low
- Heat 3/10 Moderate 7 d/yr ≥106°F today · 18 d/yr by 30 yrs out
- Wind 2/10 Low
- Air quality 2/10 Low 1 unhealthy d/yr today · 1 by 30 yrs out
Nearby sold comps map
Loading sold comps map…
Walkable amenities ~0.75 mi
Loading nearby amenities…
Taxation est. · year 1
- Rental income
- $10,001
- − Mortgage interest
- −$2,493
- − Property taxes
- −$460
- − Insurance
- −$222
- − Repairs & maintenance
- −$800
- − Management
- −$800
- − Depreciation
- −$1,295
- Taxable income
- $3,931
- Est. tax owed @ 24.0%
- −$943
- After-tax cash flow
- $3,474/yr
For passive investors: Depreciation is non-cash, so a rental often shows a tax loss while cash-flowing — sheltering income. Rental losses are passive: they offset passive income freely, and up to $25,000/yr can offset ordinary (W-2) income if you actively participate and your MAGI is under $100k (phasing out to $0 by $150k); unused losses carry forward. On sale, claimed depreciation is recaptured at up to 25%, and gains may owe capital-gains tax (a 1031 exchange can defer both). Figures are a year-1 estimate at your 24.0% rate — not tax advice; consult a CPA.
Schools (NCES district)
- District
- Centralia R-VI
- NCES district ID
- 2908400
- Math proficiency
- 43% ▼ -7.00%
- Reading proficiency
- 48% ▼ -8.00%
- Median HH income
- $50,465
- Composite
- 39.08/100
- National rank
- #4048
- State rank
- #82 of 324 in MO
Livability — Centralia
- Score
- 70/100
- State rank
- #127
- US rank
- #7477
Category grades
Schools grade is shown separately in the Schools card above.
Census & demographics
- Census place
- Centralia, MO
- City population
- 8,740
- Population (ZIP)
- 8,740
Population outlook (Boone County) Hauer SSP2
- Today (2025)
- 202,891 people
- By 2030
- 217,799 · +7.3%
- By 2040
- 246,789 · +21.6%
- By 2050
- 276,116 · +36.1%
- By 2075
- 348,426 · +71.7%
- By 2100
- 400,856 · +97.6%
Race, ethnicity, and origin ACS 2023
- Neighborhood character
- Predominantly White (92%)
- Race & ethnicity
- White 92% Two or more races 7% Hispanic / Latino 2%
- Common ancestry
- Italian 4% Slovak 2% Lithuanian 2%
- Foreign-born
- 1%
Political lean MEDSL · Boone
- 2024 margin
- Lean D (+9.8) · D 53.9% · R 44.1% · Other 2.1%
- 2008→2024 swing
- -2.2pp toward R · 2008: 12.0pp · 2024: 9.8pp
- All cycles
- 2024: D+9.8 2020: D+12.5 2016: D+5.9 2012: D+3.1 2008: D+12.0
Not yet ingested
- Civics
- —
Market trends
- HPI YoY
- ▼ -65.18%
- Current HPI
- 251.817
- Rent YoY
- —
- Metro
- —
- State GDP YoY
- ▲ 1.84%
- F500 in state
- 20
Industry mix (Fortune 500 HQ in MO)
| Industry | F500 HQs | Revenue |
|---|---|---|
| Healthcare | 1 | $163B |
|
||
| Insurance | 1 | $21B |
|
||
| Industrial Technology | 1 | $17B |
|
||
| Retail | 1 | $16B |
|
||
| Industrial Distribution | 1 | $10B |
|
||
| Utilities | 1 | $9B |
|
||
Price history
+0.0% since first listed2 events — show timeline
- 2026-05-28 Listed $44,500 CBORMLS
- 2026-05-28 Listed $44,500 HMMLS
Property tax history
+3.2%/yrLatest (2025): $460 · +14.3% YoY. Source: county tax records.
Cash-flow waterfall
monthlySold comps — $/sqft
last 12 mo · ≤1 miLoading sold comps…