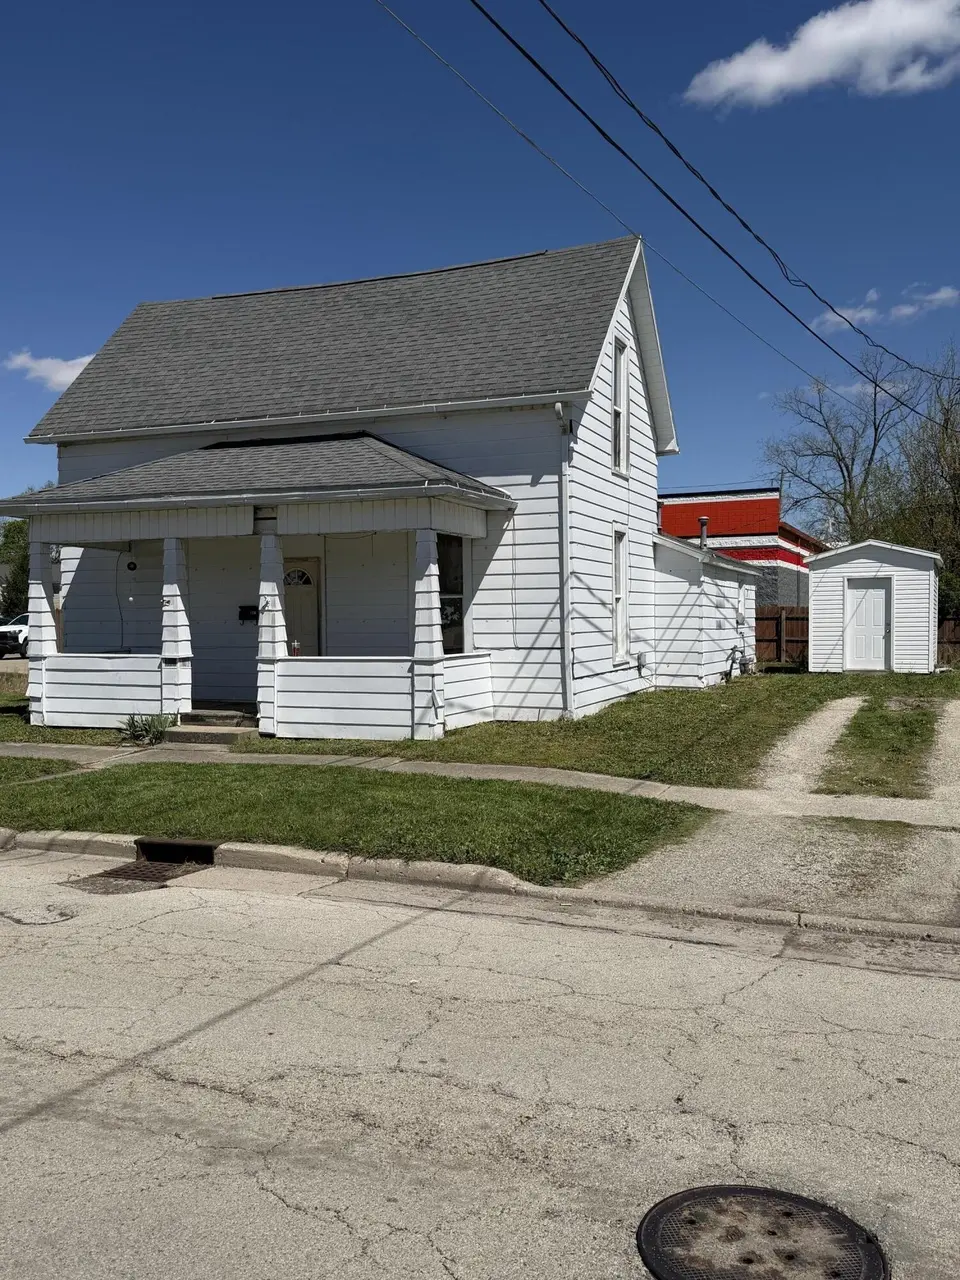
116 S Buckeye St · Celina, OH
Flood risk 7/10 · Major
- FEMA flood zone
- X (unshaded)
- Chance of flooding over 30 yrs
- 0.95%
- Est. flood insurance / yr
- $507 – $1,088
Fire risk 1/10 · Minimal
- Est. fire insurance / yr
- $713 – $1,323
Heat risk 3/10 · Minor
- Hot days now (above 100°F)
- 7 days/yr
- Hot days in 30 yrs
- 18 days/yr
Wind risk 2/10 · Minimal
- Chance of severe wind over 30 yrs
- —
Air-quality risk 2/10 · Minimal
- Unhealthy air days now
- 1 days/yr
- Unhealthy air days in 30 yrs
- 3 days/yr
Risk factors via First Street. Map © Google.
Why this score? — see what drove the B+ grade
The composite is a weighted blend of 9 inputs, each scored 0–100. Each bar is that input's sub-score; the figure is the points it added to the 100-point composite (weight × sub-score).
- Cash flow +29.1/30.0
- ARV discount +15.0/15.0
- DSCR +10.0/10.0
- 1% rule +7.7/10.0
- Schools +5.0/10.0
- Livability +3.6/5.0
- Rent growth +2.5/5.0
- Condition / age +2.5/5.0
- Appreciation +0.0/10.0
$124,900
🖨 Deal sheet (PDF) 📄 Offer letter ✓ Due diligence
Listing remarks
Welcome Home to this 3 bedroom, 1 bath property offering comfort and convenience. Inside, you'll find fresh paint throughout, new drop ceiling, and inviting space ready for your personal touch. Outside you can enjoy the fenced in yard. With a newer roof already in place, you can move in with peace of mind knowing a major update has been taken care of. Whether you're a first time buyer, looking for an investment or looking to downsize, this home is full of potential and ready for its next owner! Seller is offering a home warranty to the buyer. Call for a private showing today!
Key facts
- Fresh paint
- Newer roof
- Fenced in yard
Tags
Property features AI
Exterior
- Utilities: Public sewer; Supplied water; Natural gas connected; Sewer connected
- Home design: Single-family residence; Residential property; Built in 1937
- Construction: Aluminum siding; Block foundation
- Exterior features: Porch
Interior
- Flooring: Carpet; Linoleum; Vinyl
- Bathrooms: 1 full bathroom
- Heating & cooling: Forced air heating
- Interior features: Attic; Ceiling fan(s); No window coverings
Neighborhood map
What this means for you Summary
Snapshot
- This is a 3-bed/1.0-bath single-family listed at $125k.
Deal economics
- At list price, monthly cash flow is $366 ($4k/yr) — positive.
- The deal already cash-flows at list — no discount required.
- Meets the 1% rule at list price ($2k rent vs $125k).
- Recommended offer: $121k (3.0% below list) — sets the bar for market timing.
- Cap rate 10.4% vs local median 4.9% in Celina — top-decile yield for the area; either an underpriced asset or a hidden risk that comps aren't pricing in. Stress-test before assuming the spread holds.
Location & tenants
- Location reads 71/100 on livability (#397 in OH) — a middle-class / working-renter tenant base. Strengths: crime A+, cost of living A+, housing A+; Watch: amenities F, commute F, health & safety F.
- Celina City (town): math 64% / reading 55% proficiency, ranked #299 of 656 in OH (top 46%) — acceptable for families but not a draw, mixed tenant base, ~2y average lease.
- Market conditions: 67 active listings in the ZIP; 92 units permitted in Mercer County in 2024 (0 in 5+ unit buildings).
Forward outlook
- Local home prices are declining (-3.0%/yr); year-one equity from $864 of loan paydown is wiped out by about $4k of value loss. Plan a longer hold.
- Mercer County population projected at -13% by 2050 — secular population decline; favor cash flow + early exit over multi-decade hold.
- At projected returns (-3.0% appreciation + 3.0% rent growth), your $35k cash investment doubles in ~9 years — after that, you're playing with house money.
Negotiation context
- It's been on market 59 days — a 3% lower offer ($121k) is reasonable based on typical stale-listing flexibility.
- 2 sale attempts since 20y ago with the ask held roughly flat each time — persistent listings suggest the price (not the market) is what's stuck; bring a comps-based counter.
Risks & watch-outs
- Watch-outs: flood insurance adds $66/mo; built in 1937 — expect roof / HVAC / electrical / plumbing capex.
- Climate carrying-cost: major flood risk — expect insurance premiums to compound above CPI over the hold.
Questions for the listing agent
- It's been on market 59 days. Have you received any prior offers? Is the seller open to a 3% concession, seller financing, or rate buy-down credit?
- Built in 1937 — when were the roof, HVAC, electrical panel, plumbing, and water heater last replaced?
- What's the actual annual flood-insurance premium (NFIP or private), and is the property in a SFHA with mandatory coverage?
- Is there a deadline driving the sale (1031 exchange, divorce, estate, relocation)? That informs how much negotiation room exists.
- Schools are A-rated — typically a magnet for longer-tenancy family renters. What's the average tenant stay here, and is there a school-zone premium baked into asking?
- What's the average days-on-market for RENTAL listings here right now (not sales)? A rising rental-DOM trend means longer vacancies and softer asking-rent achievability than the comps imply.
- What's the recent tenant-quality profile in this submarket — average credit score on applications, eviction rate, late-payment / NSF rate, and stable-employment percentage? A property-management company in the area should have these aggregated.
- How much new for-sale + rental construction is in the pipeline within 1–3 miles? Heavy new supply typically softens prices + rents 12–24 months out; constrained supply supports both.
Investment metrics
- 1% rule
- 1.27% ✓
- Cap rate
- 10.45%
- Cash-on-cash
- 14.84%
- DSCR
- 1.66
- GRM
- 6.6
CMA / ARV
- ARV (on-the-fly)
- $162,944
- Comps found
- 12
Show comp detail 12 sales within ~0.75 mi
| Address | Dist | Beds/Ba | Sqft | Sold | Price | $/sf | Match |
|---|---|---|---|---|---|---|---|
| 120 E Blake St | 0.41mi | 2/1.0 (-1) | 1,056 (-2%) | 2mo | $160,000 | $152 | 72 |
| 320 S Walnut St | 0.36mi | 2/1.5 (-1) | 1,051 (-2%) | 16mo | $110,000 | $105 | 60 |
| 619 N Sugar St | 0.59mi | 3/1.0 | 1,026 (-4%) | 7mo | $128,500 | $125 | 60 |
| 319 E Wayne St | 0.32mi | 3/2.0 | 1,200 (+12%) | 7mo | $254,900 | $212 | 56 |
| 627 N Sugar St | 0.61mi | 2/1.5 (-1) | 1,044 (-3%) | 6mo | $135,000 | $129 | 55 |
| 509 S Sugar St | 0.51mi | 2/1.0 (-1) | 1,117 (+4%) | 14mo | $59,000 | $53 | 52 |
| 618 W Livingston St | 0.71mi | 2/1.0 (-1) | 1,040 (-3%) | 6mo | $145,000 | $139 | 52 |
| 524 N Buckeye St | 0.38mi | 3/2.0 | 1,215 (+13%) | 6mo | $244,900 | $202 | 51 |
| 116 S Elm St | 0.71mi | 3/1.0 | 960 (-10%) | 2mo | $216,000 | $225 | 48 |
| 419 S Mill St | 0.54mi | 3/1.0 | 1,192 (+11%) | 13mo | $90,000 | $76 | 45 |
| 210 S Elm St | 0.71mi | 3/1.0 | 1,186 (+11%) | 7mo | $205,000 | $173 | 43 |
| 308 Dogwood Dr | 0.72mi | 4/2.0 (+1) | 1,228 (+15%) | 3mo | $270,000 | $220 | 31 |
Match score weights: distance 35% · size 25% · config 20% · recency 20%. Top-matched comps best support the ARV.
Projected returns pro-forma
-3.0% appreciation · 3.0% rent growth · sell at horizon
- IRR
- 2.3%
- Equity multiple
- 1.09×
- Total profit
- $3,107
- Equity at exit
- $18,623
- IRR
- 11.9%
- Equity multiple
- 1.94×
- Total profit
- $32,878
- Equity at exit
- $10,799
Cash invested: $34,972 (down + closing). Projections, not guarantees.
Landlord ↔ Tenant lean methodology
- Overall (STATE)
- 73 Landlord-Friendly
- State Ohio
- 73 Landlord-Friendly · R+6
- County
- — inherits STATE
- City
- — inherits STATE
ZIP-level market 45822
- Active inventory
- 67
- Price-to-rent
- 6.6×
Monthly cashflow live
- Estimated rent
- $1,588 medium interval (Pro) →
- Mortgage (P&I)
- −$655
- Tax from tax record
- −$115 /mo · $1,383/yr
- Insurance
- −$52
- Flood insurance flood zone
- −$66 /mo · $798/yr
- HOA
- −$0
- Vacancy / Maint / Mgmt
- −$334
- Net cashflow
- $366
Break-even live
Sensitivity live
| Price | -10% $437 | -5% $401 | +0% $366 | +5% $331 | +10% $295 |
|---|---|---|---|---|---|
| Rent | -10% $240 | -5% $303 | +0% $366 | +5% $429 | +10% $491 |
| Rate | -1.0pp $429 | -0.5pp $398 | base $366 | +0.5pp $334 | +1.0pp $301 |
UW: 25.0% down · 7.5% · 30yr · 1.5% tax · 5.0% vac · 8.0% maint · 8.0% mgmt
Financing live
Cash to close
- Down payment
- $31,225
- Closing costs
- $3,747
- Reserves months
- —
- Total cash needed
- —
Loan-product check · same deal, 3 products live
Conventional
25% down · 7.5% · 30yr
- Down + closing
- —
- Monthly P&I
- —
- Monthly cashflow
- —
- DSCR
- —
- Eligible?
- —
Personal DTI + credit; lowest rate.
DSCR
20% down · 8.5% · 30yr
- Down + closing
- —
- Monthly P&I
- —
- Monthly cashflow
- —
- DSCR
- —
- Eligible?
- —
No personal income docs; deal must DSCR.
Hard money
10% down · 12.0% · 12mo
- Down + closing
- —
- Monthly P&I
- —
- Monthly cashflow
- —
- DSCR
- —
- Eligible?
- —
Short-term bridge; refi at stabilization.
Listing history 19 events
-
2026-06-18days on market $124,900 Active 59 DOM
-
2026-06-18price $124,900 Active 58 DOM
-
2026-06-17days on market $129,900 Active 58 DOM
-
2026-06-16days on market $129,900 Active 57 DOM
-
2026-06-15days on market $129,900 Active 56 DOM
-
2026-06-13days on market $129,900 Active 54 DOM
-
2026-06-12days on market $129,900 Active 53 DOM
-
2026-06-09days on market $129,900 Active 50 DOM
-
2026-06-08days on market $129,900 Active 49 DOM
-
2026-06-08days on market $129,900 Active 48 DOM
-
2026-06-07days on market $129,900 Active 47 DOM
-
2026-06-04days on market $129,900 Active 44 DOM
-
2026-06-02days on market $129,900 Active 43 DOM
-
2026-06-01days on market $129,900 Active 42 DOM
-
2026-05-31days on market $129,900 Active 41 DOM
-
2026-04-29historical Contingency - Finance and Inspections
-
2026-04-20$129,900 Active
-
2016-11-04historical
-
2006-09-24$64,900
ⓘ Source: listings_history table (triggers on properties + properties_extension) + one-shot
backfill from property_details.listing_events for pre-trigger history.
Tax reassessment forecast OH · Partial reset (capped growth)
- Current annual tax
- $1,383 · $115/mo
- Projected year-2 tax
- $1,666 · $139/mo
- Expected delta
- +$283/yr (+$24/mo · 20.4%)
ⓘ Screening estimate from a state-policy table — verify with the county assessor before closing.
Climate risk First Street
- Flood 7/10 Severe FEMA zone X (unshaded) · 95% chance over 30 yrs
- Wildfire 1/10 Low
- Heat 3/10 Moderate 7 d/yr ≥100°F today · 18 d/yr by 30 yrs out
- Wind 2/10 Low
- Air quality 2/10 Low 1 unhealthy d/yr today · 3 by 30 yrs out
Nearby sold comps map
Loading sold comps map…
Walkable amenities ~0.75 mi
Loading nearby amenities…
Taxation est. · year 1
- Rental income
- $19,059
- − Mortgage interest
- −$6,996
- − Property taxes
- −$1,383
- − Insurance
- −$1,422
- − Repairs & maintenance
- −$1,525
- − Management
- −$1,525
- − Depreciation
- −$3,633
- Taxable income
- $2,574
- Est. tax owed @ 24.0%
- −$618
- After-tax cash flow
- $3,773/yr
For passive investors: Depreciation is non-cash, so a rental often shows a tax loss while cash-flowing — sheltering income. Rental losses are passive: they offset passive income freely, and up to $25,000/yr can offset ordinary (W-2) income if you actively participate and your MAGI is under $100k (phasing out to $0 by $150k); unused losses carry forward. On sale, claimed depreciation is recaptured at up to 25%, and gains may owe capital-gains tax (a 1031 exchange can defer both). Figures are a year-1 estimate at your 24.0% rate — not tax advice; consult a CPA.
Schools (NCES district)
- District
- Celina City
- NCES district ID
- 3910030
- Math proficiency
- 64% ▼ -9.00%
- Reading proficiency
- 55% ▼ -9.00%
- Median HH income
- $47,168
- Composite
- 50.44/100
- National rank
- #1864
- State rank
- #299 of 656 in OH
Livability — Celina
- Score
- 71/100
- State rank
- #397
- US rank
- #6556
Category grades
Schools grade is shown separately in the Schools card above.
Census & demographics
- Census place
- Celina, OH
- County
- Mercer · 42,068 people
- Population (ZIP)
- 20,170
- Household income
- $72,106
- Rent vs Own
- Severe rent burden
- 15.9
Population outlook (Mercer County) Hauer SSP2
- Today (2025)
- 40,163 people
- By 2030
- 39,367 · -2.0%
- By 2040
- 37,406 · -6.9%
- By 2050
- 34,917 · -13.1%
- By 2075
- 28,969 · -27.9%
- By 2100
- 21,338 · -46.9%
Race, ethnicity, and origin ACS 2023
- Neighborhood character
- Predominantly White (93%)
- Race & ethnicity
- White 93% Two or more races 4% Hispanic / Latino 2% Black 1%
- Common ancestry
- Lithuanian 3% Slovak 1% Iranian 1%
- Foreign-born
- 1% · Canada, Vietnam
- Languages at home
- 98% English-only · German/W. Germanic 1%
Political lean MEDSL · Mercer
- 2024 margin
- Solid R (+66.7) · D 16.3% · R 83.0%
- 2008→2024 swing
- -23.2pp toward R · 2008: -43.5pp · 2024: -66.7pp
- All cycles
- 2024: R+66.7 2020: R+64.9 2016: R+65.0 2012: R+54.8 2008: R+43.5
Not yet ingested
- Civics
- —
Market trends
- HPI YoY
- ▼ -211.25%
- Current HPI
- 204.0486
- Rent YoY
- —
- Metro
- —
- State GDP YoY
- ▲ 1.98%
- F500 in state
- 48
Industry mix (Fortune 500 HQ in OH)
| Industry | F500 HQs | Revenue |
|---|---|---|
| Insurance | 3 | $145B |
|
||
| Industrial Machinery | 3 | $49B |
|
||
| Financial Services | 3 | $24B |
|
||
| Consumer Goods | 2 | $93B |
|
||
| Aerospace / Defense | 2 | $47B |
|
||
| Utilities | 2 | $33B |
|
||
Price history
+100.2% since first listed4 events — show timeline
- 2026-04-29 Contingent — WRIST
- 2026-04-20 Listed $129,900 WRIST
- 2016-11-04 Listing Removed — WRIST
- 2006-09-24 Listed $64,900 WRIST
Property tax history
+6.6%/yrLatest (2024): $1,383 · -0.1% YoY. Source: county tax records.
Cash-flow waterfall
monthlySold comps — $/sqft
last 12 mo · ≤1 miLoading sold comps…