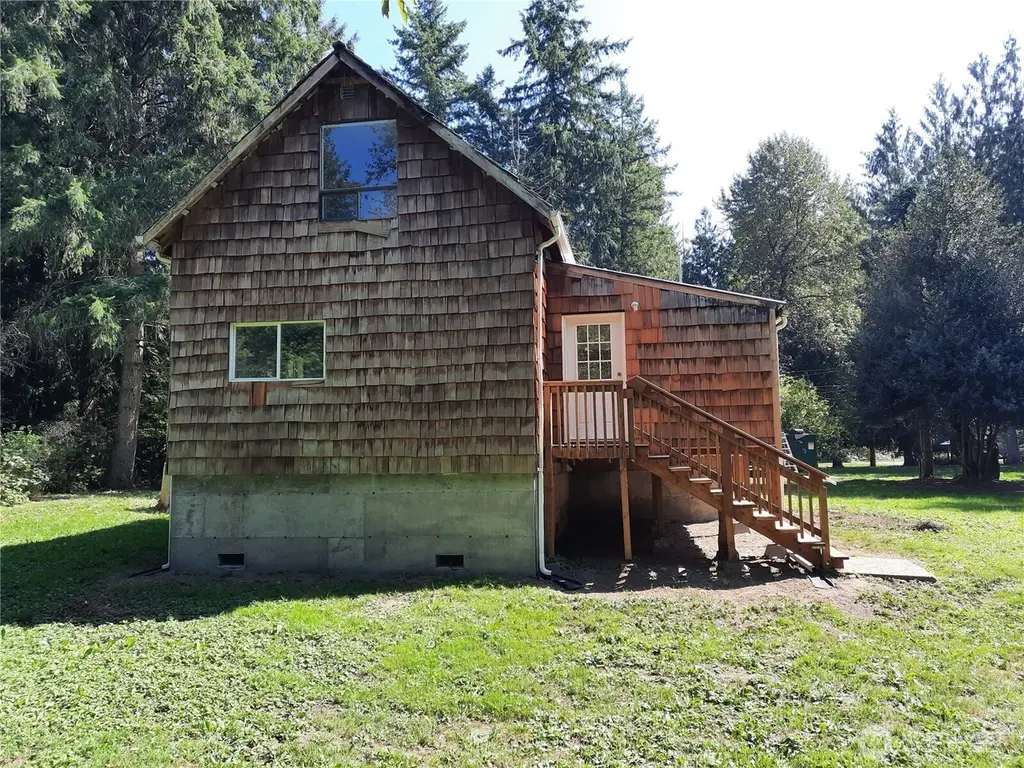
41498 Cape Horn Dr · Concrete, WA
Flood risk 10/10 · Severe
- FEMA flood zone
- AE
- Chance of flooding over 30 yrs
- 0.99%
- Est. flood insurance / yr
- $1,737 – $8,500
Fire risk 3/10 · Minor
- Est. fire insurance / yr
- $604 – $1,122
Heat risk 2/10 · Minimal
- Hot days now (above 87°F)
- 9 days/yr
- Hot days in 30 yrs
- 20 days/yr
Wind risk 1/10 · Minimal
- Chance of severe wind over 30 yrs
- —
Air-quality risk 7/10 · Major
- Unhealthy air days now
- 11 days/yr
- Unhealthy air days in 30 yrs
- 11 days/yr
Risk factors via First Street. Map © Google.
Why this score? — see what drove the D+ grade
The composite is a weighted blend of 9 inputs, each scored 0–100. Each bar is that input's sub-score; the figure is the points it added to the 100-point composite (weight × sub-score).
- ARV discount +15.0/15.0
- Appreciation +10.0/10.0
- Cash flow +6.4/30.0
- Livability +3.8/5.0
- Schools +3.2/10.0
- Rent growth +2.5/5.0
- Condition / age +2.5/5.0
- 1% rule +1.0/10.0
- DSCR +0.7/10.0
$314,000
🖨 Deal sheet (PDF) 📄 Offer letter ✓ Due diligence
Listing remarks
2 spacious lots already divided. Live on one and put another dwelling on spare lot. Comes with 50 amp RV hook up. Parklike setting with fruit trees garden space. Newly renovated bathroom. New cabinets, countertops and sink in kitchen. New septic system. Motivated seller!
Key facts
- Parklike setting
- New cabinets
- New countertops
Tags
Neighborhood map
What this means for you Summary
Snapshot
- This is a 4-bed/2.0-bath single-family listed at $314k.
Deal economics
- At list price, monthly cash flow is $-974 ($-12k/yr) — negative.
- To cash-flow at today's rent, offer at most $142k (54.8% below list).
- To meet the 1% rule (rent ≥ 1% of price), the offer needs to be $190k (39.6% below list).
- Recommended offer: $142k (54.8% below list) — sets the bar for cash-flow.
- Cap rate 4.2% vs local median 2.1% in Concrete — top-decile yield for the area; either an underpriced asset or a hidden risk that comps aren't pricing in. Stress-test before assuming the spread holds.
Location & tenants
- Location reads 76/100 on livability (#157 in WA, #3,709 nationally) — a middle-class / working-renter tenant base. Strengths: housing A+, health & safety A+, cost of living A; Watch: crime F, amenities F.
- Concrete School District (rural): math 24% / reading 45% proficiency, ranked #255 of 291 in WA (top 88%) — families likely to look elsewhere, expect single-tenant / working-renter base with shorter leases.
- Zoned schools: Concrete Elementary (301 students, 41% FRL); Concrete High School (193 students, 43% FRL) — zoned schools average 42% FRL vs 60% district-wide (17 pts lower); this property's tenant base skews higher-income than the district average.
- Market conditions: 96 active listings in the ZIP; 561 units permitted in Skagit County in 2024 (270 in 5+ unit buildings).
Forward outlook
- In year one you build about $34k of equity ($2k loan paydown + $31k appreciation (10.0% local appreciation)).
- Skagit County population projected at +11% by 2050 — modest demand growth; plan on rents tracking national, not racing it.
- By year 2, paydown + projected appreciation supports a ~$54k cash-out refi (75% LTV) — recoverable capital for the next deal without selling this one.
Negotiation context
- It's been on market 263 days — a 12% lower offer ($276k) is reasonable based on typical stale-listing flexibility.
- 3 sale attempts since 20y ago; this cycle's ask has dropped $161k (34%) from the opening price — seller is motivated, your offer sets the floor, not the list.
- Current owner paid $39k; list at $314k implies a 707% gain — meaningful room to come down on a strong offer.
Risks & watch-outs
- Watch-outs: flood insurance adds $427/mo.
- Climate carrying-cost: in FEMA flood zone AE (mandatory federal flood insurance) — expect insurance premiums to compound above CPI over the hold.
Questions for the listing agent
- What do current leases actually rent for vs. the listed asking? Can we see a recent rent roll and the last 12 months of T-12 income?
- It's been on market 263 days. Have you received any prior offers? Is the seller open to a 55% concession, seller financing, or rate buy-down credit?
- Built in 1967 — when were the roof, HVAC, electrical panel, plumbing, and water heater last replaced?
- What's the actual annual flood-insurance premium (NFIP or private), and is the property in a SFHA with mandatory coverage?
- What does the HOA fee cover, when was the last increase, and are there any pending special assessments or reserve-fund shortfalls?
- Why hasn't it sold? Are there any deal-killer items the seller is aware of (foundation, flood, title, zoning, code violations)?
- Is there a deadline driving the sale (1031 exchange, divorce, estate, relocation)? That informs how much negotiation room exists.
- Schools are D-rated, which usually means shorter tenancies and higher turnover. Who's the typical renter profile here, and what's been the actual vacancy rate?
- Crime grade is F in this area — have there been break-ins, vandalism, or insurance claims at this property in the last 3 years? What carrier currently insures it and at what premium?
- The area grade is low — what's the realistic commute time and amenity access for the typical tenant pool here? Any planned neighborhood developments (good or bad) we should know about?
- What's the average days-on-market for RENTAL listings here right now (not sales)? A rising rental-DOM trend means longer vacancies and softer asking-rent achievability than the comps imply.
- What's the recent tenant-quality profile in this submarket — average credit score on applications, eviction rate, late-payment / NSF rate, and stable-employment percentage? A property-management company in the area should have these aggregated.
- How much new for-sale + rental construction is in the pipeline within 1–3 miles? Heavy new supply typically softens prices + rents 12–24 months out; constrained supply supports both.
Investment metrics
- 1% rule
- 0.60% ✗
- Cap rate
- 4.20%
- Cash-on-cash
- -7.48%
- DSCR
- 0.67
- GRM
- 13.8
CMA / ARV
- ARV (median comp)
- $451,830
- List price
- $314,000
- Delta
- -30.50%
- Verdict
- UNDERPRICED
- Comps
- 4 within 1.0 mi
Projected returns pro-forma
10.0% appreciation · 3.0% rent growth · sell at horizon
- IRR
- 15.0%
- Equity multiple
- 2.24×
- Total profit
- $109,169
- Equity at exit
- $282,876
- IRR
- 14.8%
- Equity multiple
- 5.22×
- Total profit
- $370,713
- Equity at exit
- $610,033
Cash invested: $87,920 (down + closing). Projections, not guarantees.
Landlord ↔ Tenant lean methodology
- Overall (STATE)
- 28 Tenant-Leaning
- State Washington
- 28 Tenant-Leaning · D+8
- County
- — inherits STATE
- City
- — inherits STATE
ZIP-level market 98237
- Home prices YoY
- 18.6%
- Active inventory
- 96
- Price-to-rent
- 13.8×
Monthly cashflow live
- Estimated rent
- $1,896 medium interval (Pro) →
- Mortgage (P&I)
- −$1,647
- Tax from tax record
- −$182 /mo · $2,178/yr
- Insurance
- −$131
- Flood insurance flood zone
- −$427 /mo · $5,118/yr
- HOA
- −$87
- Vacancy / Maint / Mgmt
- −$398
- Net cashflow
- $-974
Break-even live
Sensitivity live
| Price | -10% $-797 | -5% $-885 | +0% $-974 | +5% $-1,063 | +10% $-1,152 |
|---|---|---|---|---|---|
| Rent | -10% $-1,124 | -5% $-1,049 | +0% $-974 | +5% $-899 | +10% $-825 |
| Rate | -1.0pp $-816 | -0.5pp $-895 | base $-974 | +0.5pp $-1,056 | +1.0pp $-1,139 |
UW: 25.0% down · 7.5% · 30yr · 1.5% tax · 5.0% vac · 8.0% maint · 8.0% mgmt
Financing live
Cash to close
- Down payment
- $78,500
- Closing costs
- $9,420
- Reserves months
- —
- Total cash needed
- —
Loan-product check · same deal, 3 products live
Conventional
25% down · 7.5% · 30yr
- Down + closing
- —
- Monthly P&I
- —
- Monthly cashflow
- —
- DSCR
- —
- Eligible?
- —
Personal DTI + credit; lowest rate.
DSCR
20% down · 8.5% · 30yr
- Down + closing
- —
- Monthly P&I
- —
- Monthly cashflow
- —
- DSCR
- —
- Eligible?
- —
No personal income docs; deal must DSCR.
Hard money
10% down · 12.0% · 12mo
- Down + closing
- —
- Monthly P&I
- —
- Monthly cashflow
- —
- DSCR
- —
- Eligible?
- —
Short-term bridge; refi at stabilization.
HOA detail
- Monthly dues
- $87 · $1,044/yr
Listing history 16 events
-
2026-05-18price $314,000
-
2025-12-06price $349,000
-
2025-10-14price $394,000
-
2025-09-15price $425,000
-
2025-09-04$475,000 Active
-
2014-07-24soldstatus $38,900 Sold
-
2014-05-23price $38,900
-
2014-05-23status Pending Inspection
-
2014-05-23status Pending
-
2014-04-18price $42,900
-
2014-03-10price $46,900
-
2014-02-07$51,900 Active
-
2006-06-12soldstatus $119,000
-
2006-06-09soldstatus $118,719
-
2006-05-19$119,000
-
2000-02-03soldstatus $59,000
ⓘ Source: listings_history table (triggers on properties + properties_extension) + one-shot
backfill from property_details.listing_events for pre-trigger history.
Tax reassessment forecast WA · Resets to sale price
- Current annual tax
- $2,178 · $182/mo
- Projected year-2 tax
- $3,077 · $256/mo
- Expected delta
- +$899/yr (+$75/mo · 41.3%)
ⓘ Screening estimate from a state-policy table — verify with the county assessor before closing.
Climate risk First Street
- Flood 10/10 Extreme FEMA zone AE · 99% chance over 30 yrs
- Wildfire 3/10 Moderate
- Heat 2/10 Low 9 d/yr ≥87°F today · 20 d/yr by 30 yrs out
- Wind 1/10 Low
- Air quality 7/10 Severe 11 unhealthy d/yr today · 11 by 30 yrs out
Nearby sold comps map
Loading sold comps map…
Walkable amenities ~0.75 mi
Loading nearby amenities…
Taxation est. · year 1
- Rental income
- $22,757
- − Mortgage interest
- −$17,589
- − Property taxes
- −$2,178
- − Insurance
- −$6,688
- − Repairs & maintenance
- −$1,821
- − Management
- −$1,821
- − HOA
- −$1,044
- − Depreciation
- −$9,135
- Taxable loss
- −$17,518
- Est. tax savings @ 24.0%
- +$4,204
- After-tax cash flow
- $-7,488/yr
For passive investors: Depreciation is non-cash, so a rental often shows a tax loss while cash-flowing — sheltering income. Rental losses are passive: they offset passive income freely, and up to $25,000/yr can offset ordinary (W-2) income if you actively participate and your MAGI is under $100k (phasing out to $0 by $150k); unused losses carry forward. On sale, claimed depreciation is recaptured at up to 25%, and gains may owe capital-gains tax (a 1031 exchange can defer both). Figures are a year-1 estimate at your 24.0% rate — not tax advice; consult a CPA.
Schools (NCES district)
- District
- Concrete School District
- NCES district ID
- 5301660
- Math proficiency
- 24% ▼ -1.00%
- Reading proficiency
- 45% ▲ 7.00%
- Median HH income
- $43,849
- Composite
- 31.96/100
- National rank
- #11033
- State rank
- #255 of 291 in WA
Livability — Concrete
- Score
- 76/100
- State rank
- #157
- US rank
- #3709
Category grades
Schools grade is shown separately in the Schools card above.
Census & demographics
- Population (ZIP)
- 5,110
Population outlook (Skagit County) Hauer SSP2
- Today (2025)
- 131,498 people
- By 2030
- 135,556 · +3.1%
- By 2040
- 141,717 · +7.8%
- By 2050
- 145,714 · +10.8%
- By 2075
- 152,201 · +15.7%
- By 2100
- 147,980 · +12.5%
Race, ethnicity, and origin ACS 2023
- Neighborhood character
- Predominantly White (79%)
- Race & ethnicity
- White 79% Hispanic / Latino 12% Two or more races 8% Native American 1%
- Hispanic origin (detail)
- Mexican 3% Puerto Rican 2%
- Common ancestry
- Portuguese 5% Iranian 4% Slovak 3%
- Foreign-born
- 3% · Canada
- Languages at home
- 94% English-only · Spanish 4% French/Haitian/Cajun 1% Russian/Polish/Slavic 1%
Political lean MEDSL · Skagit
- 2024 margin
- Lean D (+8.9) · D 52.9% · R 44.0% · Other 3.0%
- 2008→2024 swing
- -0.7pp no change · 2008: 9.6pp · 2024: 8.9pp
- All cycles
- 2024: D+8.9 2020: D+7.5 2016: D+3.2 2012: D+5.8 2008: D+9.6
Not yet ingested
- Civics
- —
Market trends
- HPI YoY
- ▲ 83.52%
- Current HPI
- 533.5113
- Rent YoY
- —
- Metro
- —
- State GDP YoY
- ▲ 4.65%
- F500 in state
- 22
Industry mix (Fortune 500 HQ in WA)
| Industry | F500 HQs | Revenue |
|---|---|---|
| Retail | 2 | $269B |
|
||
| Technology / Retail | 1 | $638B |
|
||
| Technology | 1 | $245B |
|
||
| Telecommunications | 1 | $38B |
|
||
| Food / Beverage | 1 | $36B |
|
||
| Automotive / Trucks | 1 | $34B |
|
||
Price history
+432.2% since first listed16 events — show timeline
- 2026-05-18 Price Changed $314,000 NWMLS as Distributed by MLS Grid
- 2025-12-06 Price Changed $349,000 NWMLS as Distributed by MLS Grid
- 2025-10-14 Price Changed $394,000 NWMLS as Distributed by MLS Grid
- 2025-09-15 Price Changed $425,000 NWMLS as Distributed by MLS Grid
- 2025-09-04 Listed $475,000 NWMLS as Distributed by MLS Grid
- 2014-07-24 Sold (MLS) $38,900 NWMLS as Distributed by MLS Grid
- 2014-05-23 Pending — NWMLS as Distributed by MLS Grid
- 2014-05-23 Pending — NWMLS as Distributed by MLS Grid
- 2014-05-23 Price Changed $38,900 NWMLS as Distributed by MLS Grid
- 2014-04-18 Price Changed $42,900 NWMLS as Distributed by MLS Grid
- 2014-03-10 Price Changed $46,900 NWMLS as Distributed by MLS Grid
- 2014-02-07 Listed $51,900 NWMLS as Distributed by MLS Grid
- 2006-06-12 Sold (MLS) $119,000 NWMLS as Distributed by MLS Grid
- 2006-06-09 Sold (Public Records) $118,719 Public Records
- 2006-05-19 Listed $119,000 NWMLS as Distributed by MLS Grid
- 2000-02-03 Sold (Public Records) $59,000 Public Records
Property tax history
+5.0%/yrLatest (2026): $2,178 · -6.3% YoY. Source: county tax records.
Cash-flow waterfall
monthlySold comps — $/sqft
last 12 mo · ≤1 miLoading sold comps…