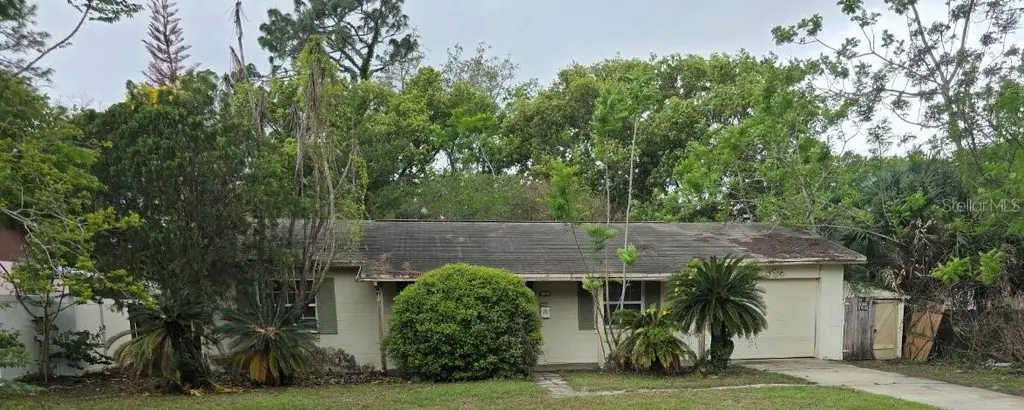
1434 Lake Dr · Casselberry, FL
Flood risk 1/10 · Minimal
- FEMA flood zone
- X (unshaded)
- Chance of flooding over 30 yrs
- 0.0%
- Est. flood insurance / yr
- $507 – $1,088
Fire risk 1/10 · Minimal
- Est. fire insurance / yr
- $947 – $1,759
Heat risk 8/10 · Major
- Hot days now (above 108°F)
- 7 days/yr
- Hot days in 30 yrs
- 22 days/yr
Wind risk 9/10 · Severe
- Chance of severe wind over 30 yrs
- 99.0%
Air-quality risk 2/10 · Minimal
- Unhealthy air days now
- 1 days/yr
- Unhealthy air days in 30 yrs
- 2 days/yr
Risk factors via First Street. Map © Google.
Why this score? — see what drove the D+ grade
The composite is a weighted blend of 9 inputs, each scored 0–100. Each bar is that input's sub-score; the figure is the points it added to the 100-point composite (weight × sub-score).
- ARV discount +15.0/15.0
- Cash flow +12.2/30.0
- Schools +5.1/10.0
- Livability +3.7/5.0
- DSCR +3.6/10.0
- 1% rule +3.5/10.0
- Rent growth +3.0/5.0
- Condition / age +2.5/5.0
- Appreciation +0.0/10.0
$230,000
🖨 Deal sheet (PDF) 📄 Offer letter ✓ Due diligence
Listing remarks
3BR/2BA Block home with updated kitchen.
Key facts
- 8,801 sq ft lot
- Garage
- Built 1971
Property features AI
Finance
- Other: Property zoned R-8; Property type: Residential — Single Family Residence; Lot has paved road access
- HOA & community: No association
Exterior
- Parking: Attached garage (1 car)
- Utilities: Public water; Public sewer; Cable available
- Home design: Single family residence; One-story home; Faces north
- Construction: Block construction; Shingle roof; Slab foundation; Built on a 0.2-acre lot
- Exterior features: Other exterior features
Interior
- Kitchen: No appliances included
- Bedrooms: 3 bedrooms
- Flooring: Ceramic tile
- Bathrooms: 2 full bathrooms
- Heating & cooling: Central heating; Central air conditioning
- Interior features: Solid wood cabinets
- Laundry & utility: Laundry located in the garage
Neighborhood map
What this means for you Summary
Snapshot
- This is a 2-bed/2.0-bath single-family listed at $230k.
Deal economics
- At list price, monthly cash flow is $-45 ($-543/yr) — negative.
- To cash-flow at today's rent, offer at most $222k (3.5% below list).
- To meet the 1% rule (rent ≥ 1% of price), the offer needs to be $196k (14.7% below list).
- Recommended offer: $196k (14.7% below list) — sets the bar for 1% rule.
- Cap rate 6.1% vs local median 4.1% in Casselberry — top-decile yield for the area; either an underpriced asset or a hidden risk that comps aren't pricing in. Stress-test before assuming the spread holds.
Location & tenants
- Location reads 73/100 on livability (#314 in FL) — a middle-class / working-renter tenant base. Strengths: cost of living A+, housing A+, health & safety A-; Watch: crime C-, employment C-, amenities F.
- Seminole (suburban): math 57% / reading 61% proficiency, ranked #13 of 73 in FL (top 18%) — acceptable for families but not a draw, mixed tenant base, ~2y average lease.
- Market conditions: Rents rising (+2.1%/yr); 189 active listings in the ZIP; 18 comparable units currently listed for rent nearby; rentals leasing fast (median 14d on market — plan ~1-2 weeks tenant-placement turnaround); 1,979 units permitted in Seminole County in 2024 (1,191 in 5+ unit buildings).
- This rent runs 34% of the median local income ($69k/yr) — at the standard rent-burdened threshold; future hikes will face affordability resistance.
Forward outlook
- Local home prices are declining (-3.0%/yr); year-one equity from $2k of loan paydown is wiped out by about $7k of value loss. Plan a longer hold.
- Seminole County population projected at +24% by 2050 — long-run rental-demand tailwind backs the buy-and-hold thesis.
Negotiation context
- It's been on market 30 days — a 2% lower offer ($227k) is reasonable based on typical stale-listing flexibility.
- Current owner paid $52k; list at $230k implies a 342% gain — meaningful room to come down on a strong offer.
Risks & watch-outs
- Climate carrying-cost: severe wind risk, 99% chance of damaging wind over 30y; extreme-heat days projected 7→22/yr by 2055 (HVAC capex compounding) — expect insurance premiums to compound above CPI over the hold.
Questions for the listing agent
- What do current leases actually rent for vs. the listed asking? Can we see a recent rent roll and the last 12 months of T-12 income?
- Built in 1971 — when were the roof, HVAC, electrical panel, plumbing, and water heater last replaced?
- Is there a deadline driving the sale (1031 exchange, divorce, estate, relocation)? That informs how much negotiation room exists.
- Schools are B-rated — typically a magnet for longer-tenancy family renters. What's the average tenant stay here, and is there a school-zone premium baked into asking?
- The area grade is low — what's the realistic commute time and amenity access for the typical tenant pool here? Any planned neighborhood developments (good or bad) we should know about?
- What's the average days-on-market for RENTAL listings here right now (not sales)? A rising rental-DOM trend means longer vacancies and softer asking-rent achievability than the comps imply.
- What's the recent tenant-quality profile in this submarket — average credit score on applications, eviction rate, late-payment / NSF rate, and stable-employment percentage? A property-management company in the area should have these aggregated.
- How much new for-sale + rental construction is in the pipeline within 1–3 miles? Heavy new supply typically softens prices + rents 12–24 months out; constrained supply supports both.
Investment metrics
- 1% rule
- 0.85% ✗
- Cap rate
- 6.06%
- Cash-on-cash
- -0.84%
- DSCR
- 0.96
- GRM
- 9.8
CMA / ARV
- ARV (on-the-fly)
- $290,520
- Comps found
- 12
Show comp detail 12 sales within ~0.75 mi
| Address | Dist | Beds/Ba | Sqft | Sold | Price | $/sf | Match |
|---|---|---|---|---|---|---|---|
| 1434 Lake Dr | 0.00mi | 3/2.0 (+1) | 1,080 (0%) | 0mo | $230,000 | $213 | 95 |
| 1346 Quintuplet Dr | 0.04mi | 3/2.0 (+1) | 1,242 (+15%) | 2mo | $360,000 | $290 | 67 |
| 1401 Tyrone Ct | 0.25mi | 3/1.0 (+1) | 1,077 (-0%) | 18mo | $290,000 | $269 | 64 |
| 1210 Quintuplet Dr | 0.22mi | 3/2.0 (+1) | 1,170 (+8%) | 10mo | $310,000 | $265 | 63 |
| 1285 Park Dr | 0.15mi | 3/1.5 (+1) | 1,200 (+11%) | 20mo | $334,000 | $278 | 51 |
| 391 Panama Cir | 0.74mi | 3/2.0 (+1) | 1,120 (+4%) | 7mo | $325,000 | $290 | 49 |
| 920 N Triplet Lake Dr | 0.65mi | 3/2.0 (+1) | 1,163 (+8%) | 4mo | $250,000 | $215 | 48 |
| 762 S Edgemon Ave | 0.59mi | 3/2.0 (+1) | 1,008 (-7%) | 13mo | $315,000 | $313 | 46 |
| 620 Fruitwood Ave | 0.60mi | 3/2.0 (+1) | 1,204 (+12%) | 10mo | $340,000 | $282 | 39 |
| 950 N Triplet Lake Dr | 0.60mi | 3/2.0 (+1) | 1,156 (+7%) | 20mo | $287,500 | $249 | 39 |
| 651 Bayou Dr | 0.72mi | 3/2.0 (+1) | 1,151 (+7%) | 19mo | $107,100 | $93 | 35 |
| 890 N Triplet Lake Dr | 0.70mi | 3/1.0 (+1) | 1,164 (+8%) | 23mo | $279,999 | $241 | 26 |
Match score weights: distance 35% · size 25% · config 20% · recency 20%. Top-matched comps best support the ARV.
Projected returns pro-forma
-3.0% appreciation · 2.09% rent growth · sell at horizon
- IRR
- -18.7%
- Equity multiple
- 0.35×
- Total profit
- $-41,898
- Equity at exit
- $34,294
- IRR
- -13.0%
- Equity multiple
- 0.27×
- Total profit
- $-47,233
- Equity at exit
- $19,886
Cash invested: $64,400 (down + closing). Projections, not guarantees.
Landlord ↔ Tenant lean methodology
- Overall (STATE)
- 87 Strongly Landlord-Friendly
- State Florida
- 87 Strongly Landlord-Friendly · R+3
- County
- — inherits STATE
- City
- — inherits STATE
ZIP-level market 32707
- Rents YoY
- 2.1%
- Active inventory
- 189
- Price-to-rent
- 9.8×
Monthly cashflow live
- Estimated rent
- $1,962 high interval (Pro) →
- Mortgage (P&I)
- −$1,206
- Tax from tax record
- −$293 /mo · $3,522/yr
- Insurance
- −$96
- HOA
- −$0
- Vacancy / Maint / Mgmt
- −$412
- Net cashflow
- $-45
Break-even live
Sensitivity live
| Price | -10% $85 | -5% $20 | +0% $-45 | +5% $-110 | +10% $-175 |
|---|---|---|---|---|---|
| Rent | -10% $-200 | -5% $-123 | +0% $-45 | +5% $32 | +10% $110 |
| Rate | -1.0pp $71 | -0.5pp $13 | base $-45 | +0.5pp $-105 | +1.0pp $-165 |
UW: 25.0% down · 7.5% · 30yr · 1.5% tax · 5.0% vac · 8.0% maint · 8.0% mgmt
Financing live
Cash to close
- Down payment
- $57,500
- Closing costs
- $6,900
- Reserves months
- —
- Total cash needed
- —
Loan-product check · same deal, 3 products live
Conventional
25% down · 7.5% · 30yr
- Down + closing
- —
- Monthly P&I
- —
- Monthly cashflow
- —
- DSCR
- —
- Eligible?
- —
Personal DTI + credit; lowest rate.
DSCR
20% down · 8.5% · 30yr
- Down + closing
- —
- Monthly P&I
- —
- Monthly cashflow
- —
- DSCR
- —
- Eligible?
- —
No personal income docs; deal must DSCR.
Hard money
10% down · 12.0% · 12mo
- Down + closing
- —
- Monthly P&I
- —
- Monthly cashflow
- —
- DSCR
- —
- Eligible?
- —
Short-term bridge; refi at stabilization.
Rent comps 18 comps
| Address | Beds | Baths | Sqft | Rent | $/sqft | DOM | Units | Dist |
|---|---|---|---|---|---|---|---|---|
| 1131 Castle Wood Ter Casselberry, FL | 1.0–3.0 | 1.0–2.0 | 1003 | $1,364 | $1.36 | 6d | 1 | 0.62mi |
| 661 Murphy Rd Winter Springs, FL | 3.0 | 2.0 | 1320 | $2,200 | $1.67 | 25d | 1 | 0.63mi |
| 700 Crestview Dr Casselberry, FL | 2.0 | 1.5 | 720 | $1,550 | $2.15 | 25d | 1 | 0.82mi |
| 421 S Hawthorn Cir Winter Springs, FL | 3.0 | 2.0 | 1052 | $2,070 | $1.97 | 6d | 1 | 1.05mi |
| 617 E Helm Way Casselberry, FL | 3.0 | 1.0 | 1000 | $1,995 | $2.00 | 6d | 1 | 1.12mi |
| 291 Ivey Rd Casselberry, FL | 3.0 | 2.0 | 1100 | $2,190 | $1.99 | 4d | 1 | 1.18mi |
| 512 El Dorado Way Casselberry, FL | 3.0 | 1.0 | 1094 | $1,895 | $1.73 | 6d | 1 | 1.29mi |
| 337 Riunite Cir Winter Springs, FL | 3.0 | 2.0 | 1500 | $2,480 | $1.65 | 12d | 1 | 1.35mi |
| 305 Cello Cir Winter Springs, FL | 3.0 | 2.0 | 1308 | $2,225 | $1.70 | 13d | 1 | 1.35mi |
| 118 Sundance Ct Winter Springs, FL | 3.0 | 2.0 | 1161 | $2,200 | $1.89 | 13d | 1 | 1.37mi |
| 404 Lancers Dr Winter Springs, FL | 3.0 | 2.0 | 1406 | $2,400 | $1.71 | 12d | 1 | 1.40mi |
| 404 Lancers Dr Winter Springs, FL | 3.0 | 2.0 | 1406 | $2,400 | $1.71 | 16d | 1 | 1.40mi |
| 213 S Moss Rd Winter Springs, FL | 2.0 | 1.5 | 930 | $1,495 | $1.61 | 25d | 1 | 1.42mi |
| 213 S Moss Rd Unit 213 Winter Springs, FL | 2.0 | 1.5 | 930 | $1,495 | $1.61 | 23d | 1 | 1.42mi |
| 226 Panorama Dr Winter Springs, FL | 3.0 | 2.0 | 1100 | $1,750 | $1.59 | 6d | 1 | 1.44mi |
| 109 N Alderwood St Winter Springs, FL | 3.0 | 2.0 | 1458 | $2,155 | $1.48 | 16d | 1 | 1.44mi |
| 1445 Bird Rd Winter Springs, FL | 3.0 | 2.0 | 1500 | $2,500 | $1.67 | 25d | 1 | 1.45mi |
| 660 Jasmine Rd Casselberry, FL | 2.0 | 1.0 | 953 | $1,725 | $1.81 | 6d | 1 | 1.45mi |
Listing history 6 events
-
2026-05-15status Pending
-
2026-04-15$230,000 Active
-
1995-04-11soldstatus $52,000
-
1989-05-01soldstatus $51,000
-
1988-01-01soldstatus $51,000
-
1985-12-01soldstatus $54,500
ⓘ Source: listings_history table (triggers on properties + properties_extension) + one-shot
backfill from property_details.listing_events for pre-trigger history.
Tax reassessment forecast FL · Resets to sale price
- Current annual tax
- $3,522 · $293/mo
- Projected year-2 tax
- $3,522 · $293/mo
- Expected delta
- $0/yr ($0/mo · 0.0%)
ⓘ Screening estimate from a state-policy table — verify with the county assessor before closing.
Climate risk First Street
- Flood 1/10 Low FEMA zone X (unshaded) · 0% chance over 30 yrs
- Wildfire 1/10 Low
- Heat 8/10 Severe 7 d/yr ≥108°F today · 22 d/yr by 30 yrs out
- Wind 9/10 Extreme 99% chance of damaging wind over 30 yrs
- Air quality 2/10 Low 1 unhealthy d/yr today · 2 by 30 yrs out
Nearby sold comps map
Loading sold comps map…
Walkable amenities ~0.75 mi
Loading nearby amenities…
Taxation est. · year 1
- Rental income
- $23,548
- − Mortgage interest
- −$12,884
- − Property taxes
- −$3,522
- − Insurance
- −$1,150
- − Repairs & maintenance
- −$1,884
- − Management
- −$1,884
- − Depreciation
- −$6,691
- Taxable loss
- −$4,466
- Est. tax savings @ 24.0%
- +$1,072
- After-tax cash flow
- $529/yr
For passive investors: Depreciation is non-cash, so a rental often shows a tax loss while cash-flowing — sheltering income. Rental losses are passive: they offset passive income freely, and up to $25,000/yr can offset ordinary (W-2) income if you actively participate and your MAGI is under $100k (phasing out to $0 by $150k); unused losses carry forward. On sale, claimed depreciation is recaptured at up to 25%, and gains may owe capital-gains tax (a 1031 exchange can defer both). Figures are a year-1 estimate at your 24.0% rate — not tax advice; consult a CPA.
Schools (NCES district)
- District
- Seminole
- NCES district ID
- 1201710
- Math proficiency
- 57% ▼ -7.00%
- Reading proficiency
- 61% ▼ -1.00%
- Median HH income
- $58,478
- Composite
- 51.05/100
- National rank
- #1769
- State rank
- #13 of 73 in FL
Livability — Casselberry
- Score
- 73/100
- State rank
- #314
- US rank
- #5320
Category grades
Schools grade is shown separately in the Schools card above.
Census & demographics
- Census place
- Casselberry, FL
- County
- Seminole County · 436,154 people
- City population
- 45,584
- Metro
- Orlando-Kissimmee-Sanford, FL
- Population (ZIP)
- 39,493
- Household income
- $69,113
- Rent vs Own
- Severe rent burden
- 1482.0
Population outlook (Seminole County) Hauer SSP2
- Today (2025)
- 515,494 people
- By 2030
- 545,713 · +5.9%
- By 2040
- 598,068 · +16.0%
- By 2050
- 640,663 · +24.3%
- By 2075
- 724,461 · +40.5%
- By 2100
- 755,530 · +46.6%
Race, ethnicity, and origin ACS 2023
- Neighborhood character
- Diverse neighborhood (Simpson 0.61)
- Race & ethnicity
- White 56% Hispanic / Latino 27% Two or more races 14% Black 10% Asian 4%
- Hispanic origin (detail)
- Mexican 3% Puerto Rican 12% Cuban 4% Dominican 2%
- Common ancestry
- Hispanic 3% Romanian 2% Lithuanian 2%
- Foreign-born
- 15% · Canada, Jamaica, China
- Languages at home
- 76% English-only · Spanish 18% French/Haitian/Cajun 2% Other Indo-European 1%
Political lean MEDSL · Seminole
- 2024 margin
- Toss-up / Even · D 47.6% · R 51.1% · Other 1.3%
- 2008→2024 swing
- -0.8pp no change · 2008: -2.8pp · 2024: -3.5pp
- All cycles
- 2024: R+3.5 2020: D+2.8 2016: R+1.6 2012: R+6.5 2008: R+2.8
Not yet ingested
- Civics
- —
Market trends
- HPI YoY
- ▼ -251.90%
- Current HPI
- 342.1006
- Rent YoY
- ▲ 2.09%
- Metro
- Orlando-Kissimmee-Sanford, FL
- State GDP YoY
- ▲ 3.28%
- F500 in state
- 36
Industry mix (Fortune 500 HQ in FL)
| Industry | F500 HQs | Revenue |
|---|---|---|
| Industrial Technology | 2 | $29B |
|
||
| Insurance | 2 | $17B |
|
||
| Retail | 1 | $60B |
|
||
| Technology Distribution | 1 | $58B |
|
||
| Homebuilding | 1 | $35B |
|
||
| Technology Manufacturing | 1 | $35B |
|
||
Price history
+322.0% since first listed6 events — show timeline
- 2026-05-15 Pending — Stellar MLS as Distributed by MLS Grid
- 2026-04-15 Listed $230,000 Stellar MLS as Distributed by MLS Grid
- 1995-04-11 Sold (Public Records) $52,000 Public Records
- 1989-05-01 Sold (Public Records) $51,000 Public Records
- 1988-01-01 Sold (Public Records) $51,000 Public Records
- 1985-12-01 Sold (Public Records) $54,500 Public Records
Property tax history
+14.5%/yrLatest (2025): $3,522 · +9.3% YoY. Source: county tax records.
Cash-flow waterfall
monthlySold comps — $/sqft
last 12 mo · ≤1 miLoading sold comps…