 🏷️ Likely Rental
15 Lake Village Ct #15 · Johnson City, TN
Flood risk 1/10 · Minimal
- FEMA flood zone
- X (unshaded)
- Chance of flooding over 30 yrs
- 0.0%
- Est. flood insurance / yr
- $473 – $860
Fire risk 5/10 · Moderate
- Est. fire insurance / yr
- $949 – $1,763
Heat risk 4/10 · Minor
- Hot days now (above 99°F)
- 7 days/yr
- Hot days in 30 yrs
- 20 days/yr
Wind risk 2/10 · Minimal
- Chance of severe wind over 30 yrs
- —
Air-quality risk 2/10 · Minimal
- Unhealthy air days now
- 1 days/yr
- Unhealthy air days in 30 yrs
- 2 days/yr
Risk factors via First Street. Map © Google.
Why this score? — see what drove the D+ grade
The composite is a weighted blend of 9 inputs, each scored 0–100. Each bar is that input's sub-score; the figure is the points it added to the 100-point composite (weight × sub-score).
- Cash flow +15.0/30.0
- ARV discount +7.5/15.0
- 1% rule +5.0/10.0
- DSCR +5.0/10.0
- Schools +3.9/10.0
- Livability +3.8/5.0
- Rent growth +3.7/5.0
- Condition / age +2.5/5.0
- Appreciation +0.0/10.0
$1,500
🖨 Deal sheet (PDF) 📄 Offer letter ✓ Due diligence
Listing remarks
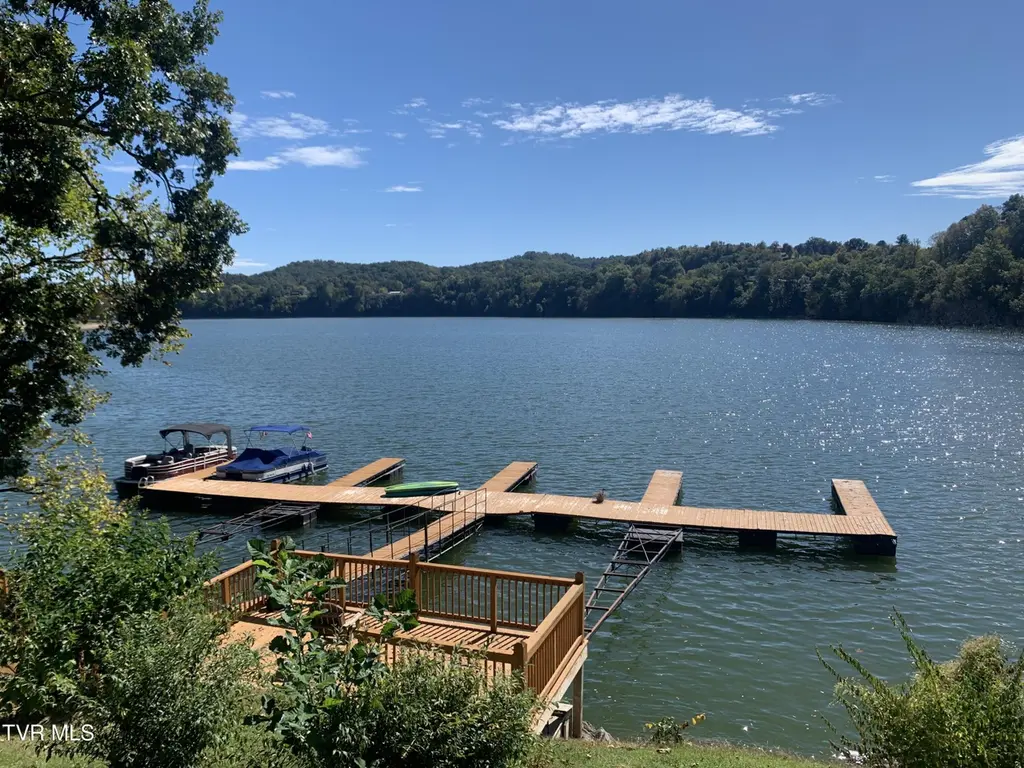
FRESH REMODELED LAKEFRONT CONDO- WITH GARAGE AND BOAT SLIP. Located in the city school district. Features 2 BR, 2 1/2 BA, underground utilities, , beautifully landscaped grounds w/ irrigation system, , lovely views of Boone Lake. RENT INCLUDES WATER, SEWER , TRASH. Just across the highway from Wing Deer Park . Minutes to all shopping and dining , medical and schools. FOR RENT ONLY - OWNER/AGENT
Key facts
- Landscaped grounds
- Views of boone lake
- Lakefront condo
Tags
Property features AI
Finance
- Other: Zoning: RS
- HOA & community: Community sidewalks; Street lights; Community lake
Exterior
- Parking: Attached garage with garage door opener; 1 garage space
- Utilities: Public water; Public sewer
- Home design: Townhouse; Two levels; Residential property
- Construction: Vinyl siding; Asphalt shingle roof; Updated/remodeled condition
- Exterior features: Balcony; Dock; Waterfront; Lake privileges; Sloped topography
Interior
- Kitchen: Dishwasher; Electric range; Microwave; Refrigerator
- Bedrooms: Total of 8 rooms (includes bedrooms and living spaces)
- Flooring: Carpet; Laminate
- Bathrooms: 2 full bathrooms; 1 half bathroom
- Heating & cooling: Heat pump cooling; Electric forced-air heating
- Interior features: Updated/remodeled interior; Balcony; Dock; Lake view
- Laundry & utility: Washer hookup; Electric dryer hookup; Washer; Dryer
Neighborhood map
What this means for you Summary
Snapshot
- This is a 2-bed/2.5-bath single-family listed at $2k.
Deal economics
- At list price, monthly cash flow is $1k ($15k/yr) — positive.
- The deal already cash-flows at list — no discount required.
- Meets the 1% rule at list price ($2k rent vs $2k).
- Recommended offer: $1k (3.0% below list) — sets the bar for market timing.
- Cap rate 1002.8% vs local median 3.1% in Johnson City — top-decile yield for the area; either an underpriced asset or a hidden risk that comps aren't pricing in. Stress-test before assuming the spread holds.
Location & tenants
- Location reads 76/100 on livability (#8 in TN, #3,349 nationally) — a middle-class / working-renter tenant base. Strengths: amenities A+, cost of living A+, health & safety A; Watch: crime D, commute F, employment F.
- Johnson City (urban): math 46% / reading 47% proficiency, ranked #9 of 139 in TN (top 6%) — families likely to look elsewhere, expect single-tenant / working-renter base with shorter leases.
- Zoned schools: Lake Ridge Elementary (math 65% / reading 52%, grade B-, #67 of 952 statewide, top 7%, 627 students, 0% FRL); Indian Trail Middle School (math 48% / reading 43%, grade D+, #28 of 333 statewide, top 8%, 808 students, 0% FRL); Science Hill High School (math 37% / reading 60%, grade D, #13 of 332 statewide, top 4%, 2,401 students, 0% FRL) — zoned schools average 0% FRL vs 44% district-wide (44 pts lower); this property's tenant base skews higher-income than the district average.
- Market conditions: Rents rising fast (+4.9%/yr); 206 active listings in the ZIP; 2 comparable units currently listed for rent nearby; 1,155 units permitted in Washington County in 2024 (437 in 5+ unit buildings).
- This rent runs 38% of the median local income ($51k/yr) — at the standard rent-burdened threshold; future hikes will face affordability resistance.
Forward outlook
- Local home prices are declining (-3.0%/yr); year-one equity from $10 of loan paydown is wiped out by about $45 of value loss. Plan a longer hold.
- Washington County population projected at +9% by 2050 — modest demand growth; plan on rents tracking national, not racing it.
- At projected returns (-3.0% appreciation + 4.9% rent growth), your $420 cash investment doubles in ~1 year — after that, you're playing with house money.
Negotiation context
- It's been on market 36 days — a 3% lower offer ($1k) is reasonable based on typical stale-listing flexibility.
Risks & watch-outs
- Climate carrying-cost: moderate wildfire risk — expect insurance premiums to compound above CPI over the hold.
Questions for the listing agent
- It's been on market 36 days. Have you received any prior offers? Is the seller open to a 3% concession, seller financing, or rate buy-down credit?
- Is there a deadline driving the sale (1031 exchange, divorce, estate, relocation)? That informs how much negotiation room exists.
- Crime grade is D in this area — have there been break-ins, vandalism, or insurance claims at this property in the last 3 years? What carrier currently insures it and at what premium?
- The area grade is low — what's the realistic commute time and amenity access for the typical tenant pool here? Any planned neighborhood developments (good or bad) we should know about?
- This sits on a lake — are riparian / water-frontage rights deeded with the parcel? Any dock permits, shoreline easements, or HOA water-use restrictions?
- What's the documented flood / surge / shoreline-erosion history here (FEMA AND non-FEMA — e.g., storm surge, creek backup, septic-field saturation)?
- Any water-quality or seasonal algae-bloom issues that affect tenant satisfaction or short-term-rental demand?
- What's the average days-on-market for RENTAL listings here right now (not sales)? A rising rental-DOM trend means longer vacancies and softer asking-rent achievability than the comps imply.
- What's the recent tenant-quality profile in this submarket — average credit score on applications, eviction rate, late-payment / NSF rate, and stable-employment percentage? A property-management company in the area should have these aggregated.
- How much new for-sale + rental construction is in the pipeline within 1–3 miles? Heavy new supply typically softens prices + rents 12–24 months out; constrained supply supports both.
Investment metrics
- 1% rule
- 105.99% ✓
- Cap rate
- 1002.80%
- Cash-on-cash
- 3558.95%
- DSCR
- 159.35
- GRM
- 0.1
CMA / ARV
- ARV (median comp)
- $199,687
- List price
- $1,500
- Delta
- -99.25%
- Verdict
- UNDERPRICED
- Comps
- 12 within 1.0 mi
Show comp detail 1 sale within ~0.75 mi
| Address | Dist | Beds/Ba | Sqft | Sold | Price | $/sf | Match |
|---|---|---|---|---|---|---|---|
| 15 Lake Village Ct #15 | 0.00mi | 2/2.5 | 1,040 (0%) | 0mo | $1,500 | $1 | 100 |
Match score weights: distance 35% · size 25% · config 20% · recency 20%. Top-matched comps best support the ARV.
Projected returns pro-forma
-3.0% appreciation · 4.88% rent growth · sell at horizon
- IRR
- —
- Equity multiple
- 196.67×
- Total profit
- $82,179
- Equity at exit
- $224
- IRR
- —
- Equity multiple
- 445.95×
- Total profit
- $186,878
- Equity at exit
- $130
Cash invested: $420 (down + closing). Projections, not guarantees.
Landlord ↔ Tenant lean methodology
- Overall (STATE)
- 87 Strongly Landlord-Friendly
- State Tennessee
- 87 Strongly Landlord-Friendly · R+13
- County
- — inherits STATE
- City
- — inherits STATE
ZIP-level market 37601
- Home prices YoY
- -21.4%
- Rents YoY
- 4.9%
- Active inventory
- 206
- Price-to-rent
- 0.1×
Monthly cashflow live
- Estimated rent
- $1,590 medium interval (Pro) →
- Mortgage (P&I)
- −$8
- Tax est. 1.5%
- −$2 /mo · $22/yr
- Insurance
- −$1
- HOA
- −$0
- Vacancy / Maint / Mgmt
- −$334
- Net cashflow
- $1,246
Break-even live
Sensitivity live
| Price | -10% $1,247 | -5% $1,246 | +0% $1,246 | +5% $1,245 | +10% $1,245 |
|---|---|---|---|---|---|
| Rent | -10% $1,120 | -5% $1,183 | +0% $1,246 | +5% $1,308 | +10% $1,371 |
| Rate | -1.0pp $1,246 | -0.5pp $1,246 | base $1,246 | +0.5pp $1,245 | +1.0pp $1,245 |
UW: 25.0% down · 7.5% · 30yr · 1.5% tax · 5.0% vac · 8.0% maint · 8.0% mgmt
Financing live
Cash to close
- Down payment
- $375
- Closing costs
- $45
- Reserves months
- —
- Total cash needed
- —
Loan-product check · same deal, 3 products live
Conventional
25% down · 7.5% · 30yr
- Down + closing
- —
- Monthly P&I
- —
- Monthly cashflow
- —
- DSCR
- —
- Eligible?
- —
Personal DTI + credit; lowest rate.
DSCR
20% down · 8.5% · 30yr
- Down + closing
- —
- Monthly P&I
- —
- Monthly cashflow
- —
- DSCR
- —
- Eligible?
- —
No personal income docs; deal must DSCR.
Hard money
10% down · 12.0% · 12mo
- Down + closing
- —
- Monthly P&I
- —
- Monthly cashflow
- —
- DSCR
- —
- Eligible?
- —
Short-term bridge; refi at stabilization.
Rent comps 2 comps
| Address | Beds | Baths | Sqft | Rent | $/sqft | DOM | Units | Dist |
|---|---|---|---|---|---|---|---|---|
| 124 Harber Ln Johnson City, TN | 2.0 | 2.0 | 1104 | $2,000 | $1.81 | 14d | 1 | 0.99mi |
| 1301 Cobblestone Ct Johnson City, TN | 2.0 | 1.0 | 1056 | $1,800 | $1.70 | 14d | 1 | 1.38mi |
Listing history 6 events
-
2026-06-02days on market $1,500 Active 36 DOM
-
2026-06-01days on market $1,500 Active 35 DOM
-
2026-05-31days on market $1,500 Active 34 DOM
-
2026-05-30days on market $1,500 Active 33 DOM
-
2026-05-08price $1,500 398-char remark
-
2026-04-27$1,700 Active 398-char remark
ⓘ Source: listings_history table (triggers on properties + properties_extension) + one-shot
backfill from property_details.listing_events for pre-trigger history.
Climate risk First Street
- Flood 1/10 Low FEMA zone X (unshaded) · 0% chance over 30 yrs
- Wildfire 5/10 Major
- Heat 4/10 Moderate 7 d/yr ≥99°F today · 20 d/yr by 30 yrs out
- Wind 2/10 Low
- Air quality 2/10 Low 1 unhealthy d/yr today · 2 by 30 yrs out
Nearby sold comps map
Loading sold comps map…
Walkable amenities ~0.75 mi
Loading nearby amenities…
Taxation est. · year 1
- Rental income
- $19,078
- − Mortgage interest
- −$84
- − Property taxes
- −$22
- − Insurance
- −$8
- − Repairs & maintenance
- −$1,526
- − Management
- −$1,526
- − Depreciation
- −$44
- Taxable income
- $15,868
- Est. tax owed @ 24.0%
- −$3,808
- After-tax cash flow
- $11,139/yr
For passive investors: Depreciation is non-cash, so a rental often shows a tax loss while cash-flowing — sheltering income. Rental losses are passive: they offset passive income freely, and up to $25,000/yr can offset ordinary (W-2) income if you actively participate and your MAGI is under $100k (phasing out to $0 by $150k); unused losses carry forward. On sale, claimed depreciation is recaptured at up to 25%, and gains may owe capital-gains tax (a 1031 exchange can defer both). Figures are a year-1 estimate at your 24.0% rate — not tax advice; consult a CPA.
Schools (NCES district)
- District
- Johnson City
- NCES district ID
- 4702130
- Math proficiency
- 46% ▼ -14.00%
- Reading proficiency
- 47% ▼ -2.00%
- Median HH income
- $37,514
- Composite
- 38.69/100
- National rank
- #4143
- State rank
- #9 of 139 in TN
Livability — Johnson City
- Score
- 76/100
- State rank
- #8
- US rank
- #3349
Category grades
Schools grade is shown separately in the Schools card above.
Census & demographics
- Census place
- Johnson City, TN
- County
- Washington County · 129,006 people
- City population
- 99,926
- Metro
- Johnson City, TN
- Population (ZIP)
- 38,008
- Household income
- $50,686
- Rent vs Own
- Severe rent burden
- 1464.0
Population outlook (Washington County) Hauer SSP2
- Today (2025)
- 132,816 people
- By 2030
- 135,823 · +2.3%
- By 2040
- 140,897 · +6.1%
- By 2050
- 145,073 · +9.2%
- By 2075
- 156,386 · +17.7%
- By 2100
- 159,893 · +20.4%
Race, ethnicity, and origin ACS 2023
- Neighborhood character
- Predominantly White (82%)
- Race & ethnicity
- White 82% Two or more races 7% Black 6% Hispanic / Latino 5% Asian 2%
- Common ancestry
- Serbian 3% Slovak 2% Iranian 1%
- Foreign-born
- 5% · Canada, China
- Languages at home
- 94% English-only · Spanish 3% Arabic 1% Chinese 1%
Political lean MEDSL · Washington
- 2024 margin
- Solid R (+39.5) · D 29.6% · R 69.1% · Other 1.3%
- 2008→2024 swing
- -6.0pp toward R · 2008: -33.5pp · 2024: -39.5pp
- All cycles
- 2024: R+39.5 2020: R+36.2 2016: R+42.9 2012: R+38.5 2008: R+33.5
Not yet ingested
- Civics
- —
Market trends
- HPI YoY
- ▼ -79.16%
- Current HPI
- 290.506
- Rent YoY
- ▲ 4.88%
- Metro
- Johnson City, TN
- State GDP YoY
- ▲ 2.78%
- F500 in state
- 22
Industry mix (Fortune 500 HQ in TN)
| Industry | F500 HQs | Revenue |
|---|---|---|
| Healthcare | 3 | $91B |
|
||
| Retail | 3 | $72B |
|
||
| Transportation / Logistics | 1 | $88B |
|
||
| Paper / Packaging | 1 | $19B |
|
||
| Insurance | 1 | $13B |
|
||
| Energy | 1 | $12B |
|
||
Price history
-11.8% since first listed3 events — show timeline
- 2026-06-06 Sold (MLS) $1,500 TVRMLS
- 2026-05-08 Price Changed $1,500 TVRMLS
- 2026-04-27 Listed $1,700 TVRMLS
Cash-flow waterfall
monthlySold comps — $/sqft
last 12 mo · ≤1 miLoading sold comps…