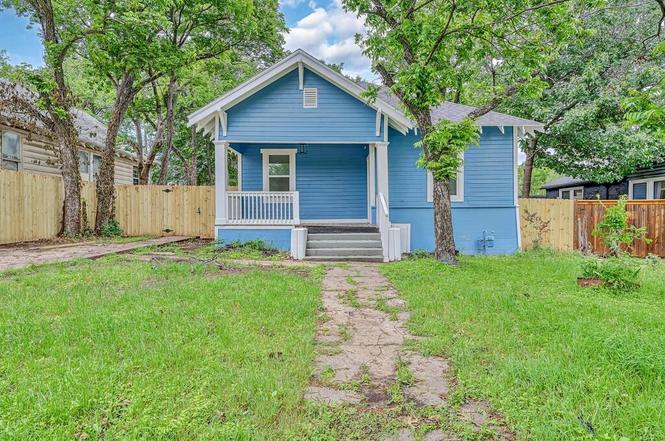
1713 Reuter Ave · Waco, TX
Flood risk 1/10 · Minimal
- FEMA flood zone
- X (unshaded)
- Chance of flooding over 30 yrs
- 0.0%
- Est. flood insurance / yr
- $507 – $1,088
Fire risk 3/10 · Minor
- Est. fire insurance / yr
- $1,222 – $2,270
Heat risk 7/10 · Major
- Hot days now (above 109°F)
- 7 days/yr
- Hot days in 30 yrs
- 25 days/yr
Wind risk 6/10 · Moderate
- Chance of severe wind over 30 yrs
- 60.0%
Air-quality risk 2/10 · Minimal
- Unhealthy air days now
- 0 days/yr
- Unhealthy air days in 30 yrs
- 1 days/yr
Risk factors via First Street. Map © Google.
Why this score? — see what drove the D grade
The composite is a weighted blend of 9 inputs, each scored 0–100. Each bar is that input's sub-score; the figure is the points it added to the 100-point composite (weight × sub-score).
- ARV discount +13.4/15.0
- Cash flow +12.4/30.0
- DSCR +3.7/10.0
- Livability +3.7/5.0
- 1% rule +3.2/10.0
- Condition / age +2.5/5.0
- Rent growth +2.3/5.0
- Schools +1.8/10.0
- Appreciation +0.0/10.0
$189,997
🖨 Deal sheet (PDF) 📄 Offer letter ✓ Due diligence
Listing remarks MLS
This house has good bones and is waiting for someone to give it some love. 1400 sq ft 2/1 that has a extra room that could be a small bedroom. The living and kitchen areas are large with room for a big family gathering. Nice size front and back porch.
Key facts
- Renovated home
- Tall ceilings
- Natural light
Tags
Neighborhood map
What this means for you Summary
Snapshot
- This is a 3-bed/1.0-bath single-family listed at $190k.
Deal economics
- At list price, monthly cash flow is $-31 ($-375/yr) — negative.
- To cash-flow at today's rent, offer at most $184k (2.9% below list).
- To meet the 1% rule (rent ≥ 1% of price), the offer needs to be $155k (18.2% below list).
- Recommended offer: $155k (18.2% below list) — sets the bar for 1% rule.
- Cap rate 6.1% vs local median 3.9% in Waco — top-decile yield for the area; either an underpriced asset or a hidden risk that comps aren't pricing in. Stress-test before assuming the spread holds.
Location & tenants
- Location reads 74/100 on livability (#166 in TX, #4,378 nationally) — a middle-class / working-renter tenant base. Strengths: cost of living A+, housing A+, health & safety A+; Watch: crime D, commute F, employment D-.
- Waco ISD (urban): math 20% / reading 24% proficiency, ranked #773 of 826 in TX (top 94%) — low school quality limits family demand, transient renter base, plan for 1-2y turnover; 81% free/reduced lunch — lower-income household profile, screen leases tightly.
- Zoned schools: Cedar Ridge El (math 16% / reading 21%, grade F, #3,759 of 4,322 statewide, top 88%, 447 students, 96% FRL); G W Carver Middle (math 9% / reading 13%, grade F, #1,634 of 1,662 statewide, top 99%, 393 students, 96% FRL, charter); Waco H S (math 26% / reading 24%, grade F, #1,250 of 1,632 statewide, top 77%, 2,011 students, 88% FRL).
- Market conditions: Rents soft (-0.8%/yr); 381 active listings in the ZIP; 40 comparable units currently listed for rent nearby; rentals at typical pace (median 23d on market — plan ~3-4 weeks tenant-placement turnaround); 1,014 units permitted in McLennan County in 2024 (200 in 5+ unit buildings).
Forward outlook
- Local home prices are declining (-3.0%/yr); year-one equity from $1k of loan paydown is wiped out by about $6k of value loss. Plan a longer hold.
- McLennan County population projected at +17% by 2050 — long-run rental-demand tailwind backs the buy-and-hold thesis.
Negotiation context
- It's been on market 43 days — a 3% lower offer ($184k) is reasonable based on typical stale-listing flexibility.
- 4 sale attempts since 4y ago; this cycle's ask has dropped $25k (12%) from the opening price — seller is motivated, your offer sets the floor, not the list.
Risks & watch-outs
- Watch-outs: built in 1920 — expect roof / HVAC / electrical / plumbing capex.
- Climate carrying-cost: major wind risk, 60% chance of damaging wind over 30y; extreme-heat days projected 7→25/yr by 2055 (HVAC capex compounding) — expect insurance premiums to compound above CPI over the hold.
Questions for the listing agent
- What do current leases actually rent for vs. the listed asking? Can we see a recent rent roll and the last 12 months of T-12 income?
- It's been on market 43 days. Have you received any prior offers? Is the seller open to a 18% concession, seller financing, or rate buy-down credit?
- Built in 1920 — when were the roof, HVAC, electrical panel, plumbing, and water heater last replaced?
- Is there a deadline driving the sale (1031 exchange, divorce, estate, relocation)? That informs how much negotiation room exists.
- Schools are D-rated, which usually means shorter tenancies and higher turnover. Who's the typical renter profile here, and what's been the actual vacancy rate?
- Crime grade is D in this area — have there been break-ins, vandalism, or insurance claims at this property in the last 3 years? What carrier currently insures it and at what premium?
- The area grade is low — what's the realistic commute time and amenity access for the typical tenant pool here? Any planned neighborhood developments (good or bad) we should know about?
- What's the average days-on-market for RENTAL listings here right now (not sales)? A rising rental-DOM trend means longer vacancies and softer asking-rent achievability than the comps imply.
- What's the recent tenant-quality profile in this submarket — average credit score on applications, eviction rate, late-payment / NSF rate, and stable-employment percentage? A property-management company in the area should have these aggregated.
- How much new for-sale + rental construction is in the pipeline within 1–3 miles? Heavy new supply typically softens prices + rents 12–24 months out; constrained supply supports both.
Investment metrics
- 1% rule
- 0.82% ✗
- Cap rate
- 6.10%
- Cash-on-cash
- -0.70%
- DSCR
- 0.97
- GRM
- 10.2
CMA / ARV
- ARV (on-the-fly)
- $218,400
- Comps found
- 12
Show comp detail 12 sales within ~0.75 mi
| Address | Dist | Beds/Ba | Sqft | Sold | Price | $/sf | Match |
|---|---|---|---|---|---|---|---|
| 1713 Reuter Ave | 0.00mi | 4/2.0 (+1) | 1,400 (0%) | 1mo | $189,997 | $136 | 90 |
| 1714 Reuter Ave | 0.03mi | 3/2.0 | 1,362 (-3%) | 4mo | $230,000 | $169 | 87 |
| 1711 Reuter Ave | 0.01mi | 2/2.0 (-1) | 1,280 (-9%) | 6mo | $199,800 | $156 | 71 |
| 1924 Summer Ave | 0.19mi | 3/2.0 | 1,548 (+11%) | 4mo | $249,900 | $161 | 66 |
| 2111 Herring Ave | 0.50mi | 3/1.5 | 1,419 (+1%) | 10mo | $100,000 | $70 | 64 |
| 2416 Mcferrin Ave | 0.57mi | 3/2.0 | 1,420 (+1%) | 9mo | $210,000 | $148 | 60 |
| 2400 Reuter Ave | 0.52mi | 4/1.0 (+1) | 1,426 (+2%) | 11mo | $80,000 | $56 | 58 |
| 1708 Mcferrin Ave | 0.13mi | 3/1.0 | 1,200 (-14%) | 15mo | $168,000 | $140 | 58 |
| 2309 Mitchell Ave | 0.51mi | 4/2.0 (+1) | 1,476 (+5%) | 15mo | $245,000 | $166 | 46 |
| 2509 Alexander Ave | 0.63mi | 3/2.0 | 1,505 (+8%) | 12mo | $269,000 | $179 | 44 |
| 1905 Live Oak Ave | 0.64mi | 2/1.0 (-1) | 1,300 (-7%) | 14mo | $179,999 | $138 | 42 |
| 3701 N 21st St | 0.69mi | 2/2.0 (-1) | 1,204 (-14%) | 7mo | $199,900 | $166 | 30 |
Match score weights: distance 35% · size 25% · config 20% · recency 20%. Top-matched comps best support the ARV.
Projected returns pro-forma
-3.0% appreciation · 0.0% rent growth · sell at horizon
- IRR
- -20.7%
- Equity multiple
- 0.30×
- Total profit
- $-37,340
- Equity at exit
- $28,329
- IRR
- -22.4%
- Equity multiple
- 0.01×
- Total profit
- $-52,718
- Equity at exit
- $16,427
Cash invested: $53,199 (down + closing). Projections, not guarantees.
Landlord ↔ Tenant lean methodology
- Overall (STATE)
- 87 Strongly Landlord-Friendly
- State Texas
- 87 Strongly Landlord-Friendly · R+5
- County
- — inherits STATE
- City
- — inherits STATE
ZIP-level market 76708
- Home prices YoY
- -26.5%
- Rents YoY
- -0.8%
- Active inventory
- 381
- Price-to-rent
- 10.2×
Monthly cashflow live
- Estimated rent
- $1,554 high interval (Pro) →
- Mortgage (P&I)
- −$996
- Tax from tax record
- −$184 /mo · $2,203/yr
- Insurance
- −$79
- HOA
- −$0
- Vacancy / Maint / Mgmt
- −$326
- Net cashflow
- $-31
Break-even live
Sensitivity live
| Price | -10% $76 | -5% $23 | +0% $-31 | +5% $-85 | +10% $-139 |
|---|---|---|---|---|---|
| Rent | -10% $-154 | -5% $-93 | +0% $-31 | +5% $30 | +10% $92 |
| Rate | -1.0pp $64 | -0.5pp $17 | base $-31 | +0.5pp $-80 | +1.0pp $-131 |
UW: 25.0% down · 7.5% · 30yr · 1.5% tax · 5.0% vac · 8.0% maint · 8.0% mgmt
Financing live
Cash to close
- Down payment
- $47,499
- Closing costs
- $5,700
- Reserves months
- —
- Total cash needed
- —
Loan-product check · same deal, 3 products live
Conventional
25% down · 7.5% · 30yr
- Down + closing
- —
- Monthly P&I
- —
- Monthly cashflow
- —
- DSCR
- —
- Eligible?
- —
Personal DTI + credit; lowest rate.
DSCR
20% down · 8.5% · 30yr
- Down + closing
- —
- Monthly P&I
- —
- Monthly cashflow
- —
- DSCR
- —
- Eligible?
- —
No personal income docs; deal must DSCR.
Hard money
10% down · 12.0% · 12mo
- Down + closing
- —
- Monthly P&I
- —
- Monthly cashflow
- —
- DSCR
- —
- Eligible?
- —
Short-term bridge; refi at stabilization.
Rent comps 40 comps
| Address | Beds | Baths | Sqft | Rent | $/sqft | DOM | Units | Dist |
|---|---|---|---|---|---|---|---|---|
| 1621 Alexander Ave Unit A Waco, TX | 3.0 | 2.0 | 1400 | $1,695 | $1.21 | 22d | 1 | 0.17mi |
| 1920 Lyle Ave Waco, TX | 2.0 | 1.0 | 1519 | $1,200 | $0.79 | 22d | 1 | 0.38mi |
| 1920 Lyle Ave Waco, TX | 2.0 | 1.0 | 1519 | $1,200 | $0.79 | 45d | 1 | 0.38mi |
| 2121 Lyle Ave Waco, TX | 2.0 | 1.0 | 1080 | $1,000 | $0.93 | 15d | 1 | 0.44mi |
| 2400 Reuter Ave Waco, TX | 4.0 | 2.0 | 1426 | $1,650 | $1.16 | 22d | 1 | 0.49mi |
| 2401 McKenzie Ave Waco, TX | 3.0 | 1.5 | 1288 | $1,300 | $1.01 | 22d | 1 | 0.50mi |
| 3400 Adeline Dr Waco, TX | 2.0 | 1.0 | 1232 | $1,150 | $0.93 | 45d | 1 | 0.56mi |
| 2600 McKenzie Ave Waco, TX | 3.0 | 1.0 | 1096 | $1,395 | $1.27 | 22d | 1 | 0.65mi |
| 2504 Lyle Ave Waco, TX | 3.0 | 2.0 | 1028 | $1,475 | $1.43 | 22d | 1 | 0.67mi |
| 712 Proctor Ave Waco, TX | 4.0 | 2.0 | 1184 | $1,450 | $1.22 | 22d | 1 | 0.74mi |
| 1818 Windsor Ave Waco, TX | 4.0 | 2.0 | 1112 | $1,625 | $1.46 | 22d | 1 | 0.74mi |
| 2505 Proctor Ave Waco, TX | 3.0 | 2.0 | 1588 | $1,550 | $0.98 | 22d | 1 | 0.75mi |
| 2601 Herring Ave Unit 1 Waco, TX | 3.0 | 1.0 | 989 | $1,295 | $1.31 | 45d | 1 | 0.75mi |
| 1920 Windsor Ave Waco, TX | 3.0 | 1.0 | 1216 | $1,200 | $0.99 | 45d | 1 | 0.75mi |
| 2000 Windsor Ave Waco, TX | 4.0 | 2.5 | 1450 | $1,800 | $1.24 | 45d | 1 | 0.76mi |
| 2717 Alexander Ave Waco, TX | 2.0 | 2.0 | 1200 | $2,000 | $1.67 | 22d | 1 | 0.77mi |
| 2712 Mitchell Ave Waco, TX | 3.0 | 1.0 | 1120 | $1,300 | $1.16 | 22d | 1 | 0.78mi |
| 3800 N 21st a St Waco, TX | 4.0 | 2.5 | 1500 | $1,350 | $0.90 | 22d | 1 | 0.79mi |
| 1825 Cumberland Ave Waco, TX | 3.0 | 1.0 | 1400 | $1,325 | $0.95 | 15d | 1 | 0.79mi |
| 2712 Lyle Ave Waco, TX | 3.0 | 1.0 | 1100 | $1,500 | $1.36 | 45d | 1 | 0.81mi |
| 2712 Lyle Ave Waco, TX | 3.0 | 1.0 | 1100 | $1,500 | $1.36 | 22d | 1 | 0.81mi |
| 2704 Herring Ave Waco, TX | 2.0 | 2.0 | 1286 | $1,750 | $1.36 | 22d | 1 | 0.83mi |
| 2805 Mitchell Ave Waco, TX | 2.0 | 1.0 | 1024 | $1,145 | $1.12 | 15d | 1 | 0.85mi |
| 1511 Maple Ave Waco, TX | 3.0 | 2.0 | 1487 | $1,450 | $0.98 | 45d | 1 | 0.88mi |
| 2612 Alice Ave Waco, TX | 2.0 | 1.0 | 964 | $1,250 | $1.30 | 22d | 1 | 0.92mi |
| 2621 Windsor Ave Waco, TX | 2.0 | 1.0 | 1108 | $1,175 | $1.06 | 22d | 1 | 0.96mi |
| 2714 Windsor Ave Waco, TX | 2.0 | 1.0 | 979 | $1,300 | $1.33 | 45d | 1 | 1.05mi |
| 1815 Seneca Ave Waco, TX | 3.0 | 2.0 | 1471 | $1,650 | $1.12 | 22d | 1 | 1.05mi |
| 1821 Algonquin St Waco, TX | 2.0 | 1.0 | 930 | $1,150 | $1.24 | 45d | 1 | 1.12mi |
| 1606 N 9th St Waco, TX | 4.0 | 2.0 | 1392 | $1,525 | $1.10 | 22d | 1 | 1.16mi |
| 1600 N 11th St Unit A Waco, TX | 3.0 | 2.0 | 1217 | $1,750 | $1.44 | 45d | 1 | 1.19mi |
| 1901 N 28th St Waco, TX | 3.0 | 2.0 | 1794 | $1,950 | $1.09 | 22d | 1 | 1.21mi |
| 3310 MacArthur Dr Waco, TX | 3.0 | 2.0 | 1586 | $2,000 | $1.26 | 15d | 1 | 1.24mi |
| 2511 Parrott Ave Waco, TX | 3.0 | 2.0 | 1463 | $1,695 | $1.16 | 45d | 1 | 1.25mi |
| 1400 N 23rd St Waco, TX | 4.0 | 2.0 | 1650 | $1,575 | $0.95 | 15d | 1 | 1.33mi |
| 2100 N 33rd St Waco, TX | 3.0 | 3.0 | 1858 | $2,200 | $1.18 | 45d | 1 | 1.38mi |
| 2804 Stewart Dr Waco, TX | 2.0 | 2.0 | 1327 | $1,475 | $1.11 | 45d | 1 | 1.44mi |
| 2810 Stewart Dr Waco, TX | 2.0 | 2.0 | 1326 | $1,735 | $1.31 | 22d | 1 | 1.44mi |
| 2001 Bosque Blvd Waco, TX | 3.0 | 1.0 | 1628 | $1,100 | $0.68 | 45d | 1 | 1.44mi |
| 3007 Parrott Ave Unit 1 Waco, TX | 3.0 | 2.0 | 1458 | $1,650 | $1.13 | 22d | 1 | 1.44mi |
Listing history 16 events
-
2026-04-21status Pending
-
2026-04-14price $189,997
-
2026-03-30price $199,997
-
2026-03-09$215,000 Active
-
2026-03-08historical $1,650
-
2025-12-31historical
-
2025-12-05price $1,650
-
2025-09-03price $1,850
-
2025-08-28$2,000
-
2025-07-11price $229,000
-
2025-06-26price $230,000
-
2025-06-06price $244,995
-
2025-05-08$259,995 Active
-
2022-04-12soldstatus
-
2022-04-07soldstatus 253-char remark
Show marketing remark (253 chars)
This house has good bones and is waiting for someone to give it some love. 1400 sq ft 2/1 that has a extra room that could be a small bedroom. The living and kitchen areas are large with room for a big family gathering. Nice size front and back porch.
-
2022-02-18$99,000 253-char remark
Show marketing remark (253 chars)
This house has good bones and is waiting for someone to give it some love. 1400 sq ft 2/1 that has a extra room that could be a small bedroom. The living and kitchen areas are large with room for a big family gathering. Nice size front and back porch.
ⓘ Source: listings_history table (triggers on properties + properties_extension) + one-shot
backfill from property_details.listing_events for pre-trigger history.
Tax reassessment forecast TX · Resets to sale price
- Current annual tax
- $2,203 · $184/mo
- Projected year-2 tax
- $3,477 · $290/mo
- Expected delta
- +$1,274/yr (+$106/mo · 57.8%)
ⓘ Screening estimate from a state-policy table — verify with the county assessor before closing.
Climate risk First Street
- Flood 1/10 Low FEMA zone X (unshaded) · 0% chance over 30 yrs
- Wildfire 3/10 Moderate
- Heat 7/10 Severe 7 d/yr ≥109°F today · 25 d/yr by 30 yrs out
- Wind 6/10 Major 60% chance of damaging wind over 30 yrs
- Air quality 2/10 Low 0 unhealthy d/yr today · 1 by 30 yrs out
Nearby sold comps map
Loading sold comps map…
Walkable amenities ~0.75 mi
Loading nearby amenities…
Taxation est. · year 1
- Rental income
- $18,652
- − Mortgage interest
- −$10,643
- − Property taxes
- −$2,203
- − Insurance
- −$950
- − Repairs & maintenance
- −$1,492
- − Management
- −$1,492
- − Depreciation
- −$5,527
- Taxable loss
- −$3,656
- Est. tax savings @ 24.0%
- +$877
- After-tax cash flow
- $503/yr
For passive investors: Depreciation is non-cash, so a rental often shows a tax loss while cash-flowing — sheltering income. Rental losses are passive: they offset passive income freely, and up to $25,000/yr can offset ordinary (W-2) income if you actively participate and your MAGI is under $100k (phasing out to $0 by $150k); unused losses carry forward. On sale, claimed depreciation is recaptured at up to 25%, and gains may owe capital-gains tax (a 1031 exchange can defer both). Figures are a year-1 estimate at your 24.0% rate — not tax advice; consult a CPA.
Schools (NCES district)
- District
- Waco ISD
- NCES district ID
- 4844280
- Math proficiency
- 20% ▼ -14.00%
- Reading proficiency
- 24% ▼ -6.00%
- Median HH income
- $29,208
- Composite
- 17.57/100
- National rank
- #9043
- State rank
- #773 of 826 in TX
Livability — Waco
- Score
- 74/100
- State rank
- #166
- US rank
- #4378
Category grades
Schools grade is shown separately in the Schools card above.
Census & demographics
- Census place
- Waco, TX
- County
- McLennan County · 213,088 people
- City population
- 125,319
- Metro
- Waco, TX
- Population (ZIP)
- 27,790
- Household income
- $68,856
- Rent vs Own
- Severe rent burden
- 583.0
Population outlook (McLennan County) Hauer SSP2
- Today (2025)
- 264,191 people
- By 2030
- 273,578 · +3.6%
- By 2040
- 291,506 · +10.3%
- By 2050
- 308,044 · +16.6%
- By 2075
- 349,648 · +32.3%
- By 2100
- 364,779 · +38.1%
Race, ethnicity, and origin ACS 2023
- Neighborhood character
- Diverse neighborhood (Simpson 0.63)
- Race & ethnicity
- White 50% Hispanic / Latino 31% Two or more races 20% Black 13% Asian 2%
- Hispanic origin (detail)
- Mexican 28%
- Common ancestry
- Slovak 2% Lithuanian 1% Italian 1%
- Foreign-born
- 11% · Canada, Vietnam
- Languages at home
- 76% English-only · Spanish 21% Other Asian/Pacific 1%
Political lean MEDSL · McLennan
- 2024 margin
- Solid R (+30.9) · D 34.0% · R 64.9% · Other 1.0%
- 2008→2024 swing
- -7.0pp toward R · 2008: -23.9pp · 2024: -30.9pp
- All cycles
- 2024: R+30.9 2020: R+23.4 2016: R+27.1 2012: R+29.8 2008: R+23.9
Not yet ingested
- Civics
- —
Market trends
- HPI YoY
- ▼ -78.80%
- Current HPI
- 218.9643
- Rent YoY
- ▼ -0.80%
- Metro
- Waco, TX
- State GDP YoY
- ▲ 3.95%
- F500 in state
- 110
Industry mix (Fortune 500 HQ in TX)
| Industry | F500 HQs | Revenue |
|---|---|---|
| Energy | 16 | $1,198B |
|
||
| Technology | 5 | $198B |
|
||
| Engineering / Construction | 4 | $72B |
|
||
| Energy Services | 3 | $60B |
|
||
| Utilities | 3 | $41B |
|
||
| Healthcare | 2 | $330B |
|
||
Price history
+91.9% since first listed16 events — show timeline
- 2026-04-21 Pending — NTREIS
- 2026-04-14 Price Changed $189,997 NTREIS
- 2026-03-30 Price Changed $199,997 NTREIS
- 2026-03-09 Listed $215,000 NTREIS
- 2026-03-08 Rental Removed $1,650 APPFOLIO
- 2025-12-31 Listing Removed — NTREIS
- 2025-12-05 Price Changed $1,650 APPFOLIO
- 2025-09-03 Price Changed $1,850 APPFOLIO
- 2025-08-28 Listed for Rent $2,000 APPFOLIO
- 2025-07-11 Price Changed $229,000 NTREIS
- 2025-06-26 Price Changed $230,000 NTREIS
- 2025-06-06 Price Changed $244,995 NTREIS
- 2025-05-08 Listed $259,995 NTREIS
- 2022-04-12 Sold (Public Records) — Public Records
- 2022-04-07 Sold (MLS) — NTREIS
- 2022-02-18 Listed $99,000 NTREIS
Property tax history
+8.5%/yrLatest (2025): $2,203 · -2.3% YoY. Source: county tax records.
Cash-flow waterfall
monthlySold comps — $/sqft
last 12 mo · ≤1 miLoading sold comps…