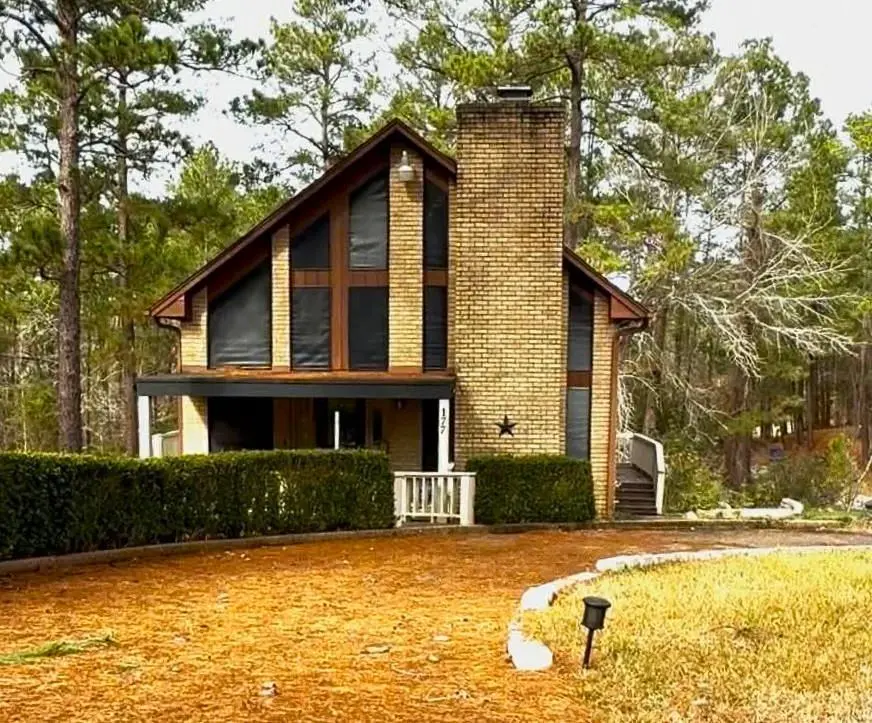
177 Piney Point Dr · Sam Rayburn, TX
Flood risk 1/10 · Minimal
- FEMA flood zone
- X (unshaded)
- Chance of flooding over 30 yrs
- 0.0%
- Est. flood insurance / yr
- $507 – $1,088
Fire risk 4/10 · Minor
- Est. fire insurance / yr
- $1,222 – $2,270
Heat risk 8/10 · Major
- Hot days now (above 111°F)
- 7 days/yr
- Hot days in 30 yrs
- 22 days/yr
Wind risk 8/10 · Major
- Chance of severe wind over 30 yrs
- 97.0%
Air-quality risk 1/10 · Minimal
- Unhealthy air days now
- 0 days/yr
- Unhealthy air days in 30 yrs
- 0 days/yr
Risk factors via First Street. Map © Google.
Why this score? — see what drove the F grade
The composite is a weighted blend of 9 inputs, each scored 0–100. Each bar is that input's sub-score; the figure is the points it added to the 100-point composite (weight × sub-score).
- ARV discount +7.5/15.0
- Cash flow +5.6/30.0
- Appreciation +5.6/10.0
- Schools +4.3/10.0
- Livability +3.3/5.0
- Rent growth +2.5/5.0
- Condition / age +2.5/5.0
- 1% rule +1.7/10.0
- DSCR +0.0/10.0
$185,000
🖨 Deal sheet 📄 Offer letter ✓ Due diligence
Listing remarks MLS
Priced to sell!! Huge reduction on this fixer-upper opportunity in Rayburn Country near Lake Sam Rayburn. This 3-bedroom, 2-bath home offers a spacious layout with vaulted ceilings and sits on two lots totaling over half an acre. Features include an updated kitchen, new carpet in the bedrooms, and a patio ideal for outdoor gatherings. Great potential for investors or buyers looking to add value in a desirable lake-area community.
Key facts
- Two lots
- New carpet
- Updated kitchen
Tags
Neighborhood map
What this means for you Summary
Snapshot
- This is a 3-bed/2.0-bath single-family listed at $185k.
Deal economics
- At list price, monthly cash flow is $-387 ($-5k/yr) — negative.
- To cash-flow at today's rent, offer at most $117k (36.9% below list).
- To meet the 1% rule (rent ≥ 1% of price), the offer needs to be $124k (32.9% below list).
- Recommended offer: $117k (36.9% below list) — sets the bar for cash-flow.
- Cap rate 3.8% vs local median 1.5% in Sam Rayburn — top-decile yield for the area; either an underpriced asset or a hidden risk that comps aren't pricing in. Stress-test before assuming the spread holds.
Location & tenants
- Location reads 66/100 on livability (#606 in TX) — a middle-class / working-renter tenant base. Strengths: crime A+, employment A+, cost of living A+; Watch: schools D+, amenities F, commute F.
- Brookeland ISD (rural): math 43% / reading 53% proficiency, ranked #445 of 1,141 in TX (top 39%) — families likely to look elsewhere, expect single-tenant / working-renter base with shorter leases.
- Market conditions: 419 active listings in the ZIP; 45 units permitted in Jasper County in 2024 (0 in 5+ unit buildings).
Forward outlook
- In year one you build about $4k of equity ($1k loan paydown + $2k appreciation (1.3% local appreciation)).
- Jasper County population projected at -15% by 2050 — secular population decline; favor cash flow + early exit over multi-decade hold.
- By year 9, paydown + projected appreciation supports a ~$33k cash-out refi (75% LTV) — recoverable capital for the next deal without selling this one.
Negotiation context
- It's been on market 116 days — a 9% lower offer ($168k) is reasonable based on typical stale-listing flexibility.
- 2 sale attempts since 7y ago; this cycle's ask has dropped $30k (14%) from the opening price — seller is motivated, your offer sets the floor, not the list.
- Current owner paid $121k; list at $185k implies a 53% gain — meaningful room to come down on a strong offer.
Risks & watch-outs
- Climate carrying-cost: severe wind risk, 97% chance of damaging wind over 30y; extreme-heat days projected 7→22/yr by 2055 (HVAC capex compounding) — expect insurance premiums to compound above CPI over the hold.
Questions for the listing agent
- What do current leases actually rent for vs. the listed asking? Can we see a recent rent roll and the last 12 months of T-12 income?
- It's been on market 116 days. Have you received any prior offers? Is the seller open to a 37% concession, seller financing, or rate buy-down credit?
- What does the HOA fee cover, when was the last increase, and are there any pending special assessments or reserve-fund shortfalls?
- Why hasn't it sold? Are there any deal-killer items the seller is aware of (foundation, flood, title, zoning, code violations)?
- Is there a deadline driving the sale (1031 exchange, divorce, estate, relocation)? That informs how much negotiation room exists.
- Schools are D-rated, which usually means shorter tenancies and higher turnover. Who's the typical renter profile here, and what's been the actual vacancy rate?
- The area grade is low — what's the realistic commute time and amenity access for the typical tenant pool here? Any planned neighborhood developments (good or bad) we should know about?
- What's the average days-on-market for RENTAL listings here right now (not sales)? A rising rental-DOM trend means longer vacancies and softer asking-rent achievability than the comps imply.
- What's the recent tenant-quality profile in this submarket — average credit score on applications, eviction rate, late-payment / NSF rate, and stable-employment percentage? A property-management company in the area should have these aggregated.
- How much new for-sale + rental construction is in the pipeline within 1–3 miles? Heavy new supply typically softens prices + rents 12–24 months out; constrained supply supports both.
Investment metrics
- 1% rule
- 0.67% ✗
- Cap rate
- 3.78%
- Cash-on-cash
- -8.96%
- DSCR
- 0.60
- GRM
- 12.4
CMA / ARV
- ARV (median comp)
- $381,259
- List price
- $185,000
- Delta
- -51.48%
- Verdict
- UNDERPRICED
- Comps
- 20 within 1.0 mi
Show comp detail 7 sales within ~0.75 mi
| Address | Dist | Beds/Ba | Sqft | Sold | Price | $/sf | Match |
|---|---|---|---|---|---|---|---|
| 220 Broadmoor | 0.49mi | 3/2.5 | 2,014 (-2%) | 9mo | $321,000 | $159 | 64 |
| 270 Lakeshore | 0.53mi | 4/2.0 (+1) | 2,105 (+2%) | 9mo | $569,000 | $270 | 60 |
| 416 Broadmoor Dr | 0.60mi | 3/2.0 | 1,963 (-5%) | 6mo | $500,000 | $255 | 59 |
| 252 Parkside Loop | 0.47mi | 4/3.0 (+1) | 1,927 (-6%) | 4mo | $189,900 | $99 | 55 |
| 182 Lakeshore Dr | 0.50mi | 3/2.0 | 1,784 (-13%) | 12mo | $429,000 | $240 | 44 |
| 145 Northview Cir | 0.74mi | 3/2.5 | 1,948 (-5%) | 19mo | $494,900 | $254 | 39 |
| 489 Lakeshore Dr | 0.75mi | 3/2.0 | 2,340 (+14%) | 16mo | $629,000 | $269 | 29 |
Match score weights: distance 35% · size 25% · config 20% · recency 20%. Top-matched comps best support the ARV.
Projected returns pro-forma
1.28% appreciation · 3.0% rent growth · sell at horizon
- IRR
- -7.0%
- Equity multiple
- 0.64×
- Total profit
- $-18,581
- Equity at exit
- $65,838
- IRR
- -1.5%
- Equity multiple
- 0.81×
- Total profit
- $-9,723
- Equity at exit
- $89,605
Cash invested: $51,800 (down + closing). Projections, not guarantees.
Landlord ↔ Tenant lean methodology
- Overall (STATE)
- 87 Strongly Landlord-Friendly
- State Texas
- 87 Strongly Landlord-Friendly · R+5
- County
- — inherits STATE
- City
- — inherits STATE
ZIP-level market 75931
- Home prices YoY
- 0.6%
- Active inventory
- 419
- Price-to-rent
- 12.4×
Monthly cashflow live
- Estimated rent
- $1,241 medium interval (Pro) →
- Mortgage (P&I)
- −$970
- Tax from tax record
- −$260 /mo · $3,119/yr
- Insurance
- −$77
- HOA
- −$60
- Vacancy / Maint / Mgmt
- −$261
- Net cashflow
- $-387
Break-even live
UW: 25.0% down · 7.5% · 30yr · 1.5% tax · 5.0% vac · 8.0% maint · 8.0% mgmt
Financing live
Cash to close
- Down payment
- $46,250
- Closing costs
- $5,550
- Reserves months
- —
- Total cash needed
- —
Loan-product check · same deal, 3 products live
Conventional
25% down · 7.5% · 30yr
- Down + closing
- —
- Monthly P&I
- —
- Monthly cashflow
- —
- DSCR
- —
- Eligible?
- —
Personal DTI + credit; lowest rate.
DSCR
20% down · 8.5% · 30yr
- Down + closing
- —
- Monthly P&I
- —
- Monthly cashflow
- —
- DSCR
- —
- Eligible?
- —
No personal income docs; deal must DSCR.
Hard money
10% down · 12.0% · 12mo
- Down + closing
- —
- Monthly P&I
- —
- Monthly cashflow
- —
- DSCR
- —
- Eligible?
- —
Short-term bridge; refi at stabilization.
HOA detail
- Monthly dues
- $60 · $720/yr
Listing history 21 events
-
2026-06-18days on market $185,000 Active 116 DOM
-
2026-06-17days on market $185,000 Active 115 DOM
-
2026-06-16days on market $185,000 Active 114 DOM
-
2026-06-15days on market $185,000 Active 113 DOM
-
2026-06-13days on market $185,000 Active 111 DOM
-
2026-06-12days on market $185,000 Active 110 DOM
-
2026-06-09days on market $185,000 Active 107 DOM
-
2026-06-08days on market $185,000 Active 106 DOM
-
2026-06-08days on market $185,000 Active 105 DOM
-
2026-06-07days on market $185,000 Active 104 DOM
-
2026-06-03days on market $185,000 Active 101 DOM
-
2026-06-02days on market $185,000 Active 100 DOM
-
2026-06-01days on market $185,000 Active 99 DOM
-
2026-05-31days on market $185,000 Active 98 DOM
-
2026-04-26price $185,000 433-char remark
Show marketing remark (433 chars)
Priced to sell!! Huge reduction on this fixer-upper opportunity in Rayburn Country near Lake Sam Rayburn. This 3-bedroom, 2-bath home offers a spacious layout with vaulted ceilings and sits on two lots totaling over half an acre. Features include an updated kitchen, new carpet in the bedrooms, and a patio ideal for outdoor gatherings. Great potential for investors or buyers looking to add value in a desirable lake-area community.
-
2026-04-02price $195,900 433-char remark
Show marketing remark (433 chars)
Priced to sell!! Huge reduction on this fixer-upper opportunity in Rayburn Country near Lake Sam Rayburn. This 3-bedroom, 2-bath home offers a spacious layout with vaulted ceilings and sits on two lots totaling over half an acre. Features include an updated kitchen, new carpet in the bedrooms, and a patio ideal for outdoor gatherings. Great potential for investors or buyers looking to add value in a desirable lake-area community.
-
2026-03-12price $209,900 433-char remark
Show marketing remark (433 chars)
Priced to sell!! Huge reduction on this fixer-upper opportunity in Rayburn Country near Lake Sam Rayburn. This 3-bedroom, 2-bath home offers a spacious layout with vaulted ceilings and sits on two lots totaling over half an acre. Features include an updated kitchen, new carpet in the bedrooms, and a patio ideal for outdoor gatherings. Great potential for investors or buyers looking to add value in a desirable lake-area community.
-
2026-01-26$215,000 Active 433-char remark
Show marketing remark (433 chars)
Priced to sell!! Huge reduction on this fixer-upper opportunity in Rayburn Country near Lake Sam Rayburn. This 3-bedroom, 2-bath home offers a spacious layout with vaulted ceilings and sits on two lots totaling over half an acre. Features include an updated kitchen, new carpet in the bedrooms, and a patio ideal for outdoor gatherings. Great potential for investors or buyers looking to add value in a desirable lake-area community.
-
2020-01-17soldstatus 302-char remark
Show marketing remark (302 chars)
Check out this wonderful 3 bedrooms 2 bath home in Rayburn Country, perfect for fisherman. This home features a beautiful updated kitchen, vaulted ceilings, and new carpet in the bedrooms. This home sits on 2 lots, and has a beautiful patio great for entertaining. Call today to see this beautiful home
-
2019-12-17$173,000 302-char remark
Show marketing remark (302 chars)
Check out this wonderful 3 bedrooms 2 bath home in Rayburn Country, perfect for fisherman. This home features a beautiful updated kitchen, vaulted ceilings, and new carpet in the bedrooms. This home sits on 2 lots, and has a beautiful patio great for entertaining. Call today to see this beautiful home
-
2014-05-13soldstatus $121,180
ⓘ Source: listings_history table (triggers on properties + properties_extension) + one-shot
backfill from property_details.listing_events for pre-trigger history.
Tax reassessment forecast TX · Resets to sale price
- Current annual tax
- $3,119 · $260/mo
- Projected year-2 tax
- $3,386 · $282/mo
- Expected delta
- +$266/yr (+$22/mo · 8.5%)
ⓘ Screening estimate from a state-policy table — verify with the county assessor before closing.
Climate risk First Street
- Flood 1/10 Low FEMA zone X (unshaded) · 0% chance over 30 yrs
- Wildfire 4/10 Moderate
- Heat 8/10 Severe 7 d/yr ≥111°F today · 22 d/yr by 30 yrs out
- Wind 8/10 Severe 97% chance of damaging wind over 30 yrs
- Air quality 1/10 Low 0 unhealthy d/yr today · 0 by 30 yrs out
Nearby sold comps map
Loading sold comps map…
Walkable amenities ~0.75 mi
Loading nearby amenities…
Taxation est. · year 1
- Rental income
- $14,892
- − Mortgage interest
- −$10,363
- − Property taxes
- −$3,119
- − Insurance
- −$925
- − Repairs & maintenance
- −$1,191
- − Management
- −$1,191
- − HOA
- −$720
- − Depreciation
- −$5,382
- Taxable loss
- −$8,000
- Est. tax savings @ 24.0%
- +$1,920
- After-tax cash flow
- $-2,722/yr
For passive investors: Depreciation is non-cash, so a rental often shows a tax loss while cash-flowing — sheltering income. Rental losses are passive: they offset passive income freely, and up to $25,000/yr can offset ordinary (W-2) income if you actively participate and your MAGI is under $100k (phasing out to $0 by $150k); unused losses carry forward. On sale, claimed depreciation is recaptured at up to 25%, and gains may owe capital-gains tax (a 1031 exchange can defer both). Figures are a year-1 estimate at your 24.0% rate — not tax advice; consult a CPA.
Schools (NCES district)
- District
- Brookeland ISD
- NCES district ID
- 4811520
- Math proficiency
- 43% ▼ -1.00%
- Reading proficiency
- 53% ▼ -1.00%
- Median HH income
- $45,145
- Composite
- 42.74/100
- National rank
- #6781
- State rank
- #445 of 1141 in TX
Livability — Sam Rayburn
- Score
- 66/100
- State rank
- #606
- US rank
- #11495
Category grades
Schools grade is shown separately in the Schools card above.
Census & demographics
- Census place
- Sam Rayburn, TX
- Population (ZIP)
- 2,209
Population outlook (Jasper County) Hauer SSP2
- Today (2025)
- 33,986 people
- By 2030
- 32,965 · -3.0%
- By 2040
- 30,908 · -9.1%
- By 2050
- 28,893 · -15.0%
- By 2075
- 24,828 · -26.9%
- By 2100
- 19,987 · -41.2%
Race, ethnicity, and origin ACS 2023
- Neighborhood character
- Predominantly White (93%)
- Race & ethnicity
- White 93% Two or more races 4% Hispanic / Latino 3% Black 1%
- Common ancestry
- Italian 4% Lithuanian 2% Romanian 1%
- Foreign-born
- 2%
- Languages at home
- 97% English-only · German/W. Germanic 2% Other Indo-European 1%
Political lean MEDSL · Jasper
- 2024 margin
- Solid R (+66.6) · D 16.5% · R 83.1%
- 2008→2024 swing
- -24.6pp toward R · 2008: -42.0pp · 2024: -66.6pp
- All cycles
- 2024: R+66.6 2020: R+61.4 2016: R+59.9 2012: R+48.4 2008: R+42.0
Not yet ingested
- Civics
- —
Market trends
- HPI YoY
- ▲ 1.28%
- Current HPI
- 231.9835
- Rent YoY
- —
- Metro
- —
- State GDP YoY
- ▲ 3.95%
- F500 in state
- 110
Industry mix (Fortune 500 HQ in TX)
| Industry | F500 HQs | Revenue |
|---|---|---|
| Energy | 16 | $1,198B |
|
||
| Technology | 5 | $198B |
|
||
| Engineering / Construction | 4 | $72B |
|
||
| Energy Services | 3 | $60B |
|
||
| Utilities | 3 | $41B |
|
||
| Healthcare | 2 | $330B |
|
||
Price history
+52.7% since first listed7 events — show timeline
- 2026-04-26 Price Changed $185,000 Deep East Texas MLS
- 2026-04-02 Price Changed $195,900 Deep East Texas MLS
- 2026-03-12 Price Changed $209,900 Deep East Texas MLS
- 2026-01-26 Listed $215,000 Deep East Texas MLS
- 2020-01-17 Sold (MLS) — BBOR
- 2019-12-17 Listed $173,000 BBOR
- 2014-05-13 Sold (Public Records) $121,180 Public Records
Property tax history
-0.0%/yrLatest (2025): $3,119 · +4.1% YoY. Source: county tax records.
Cash-flow waterfall
monthlySold comps — $/sqft
last 12 mo · ≤1 miLoading sold comps…