13323 Ellison Trce · Sale Creek, TN
Flood risk 1/10 · Minimal
- FEMA flood zone
- X (unshaded)
- Chance of flooding over 30 yrs
- 0.0%
- Est. flood insurance / yr
- $507 – $1,088
Fire risk 6/10 · Moderate
- Est. fire insurance / yr
- $949 – $1,763
Heat risk 5/10 · Moderate
- Hot days now (above 104°F)
- 7 days/yr
- Hot days in 30 yrs
- 18 days/yr
Wind risk 3/10 · Minor
- Chance of severe wind over 30 yrs
- 8.0%
Air-quality risk 4/10 · Minor
- Unhealthy air days now
- 3 days/yr
- Unhealthy air days in 30 yrs
- 4 days/yr
Risk factors via First Street. Map © Google.
Why this score? — see what drove the D grade
The composite is a weighted blend of 9 inputs, each scored 0–100. Each bar is that input's sub-score; the figure is the points it added to the 100-point composite (weight × sub-score).
- Appreciation +10.0/10.0
- Cash flow +8.5/30.0
- ARV discount +7.5/15.0
- Livability +3.1/5.0
- Schools +2.7/10.0
- Rent growth +2.5/5.0
- Condition / age +2.5/5.0
- DSCR +2.3/10.0
- 1% rule +1.4/10.0
$195,000
🖨 Deal sheet (PDF) 📄 Offer letter ✓ Due diligence
Listing remarks
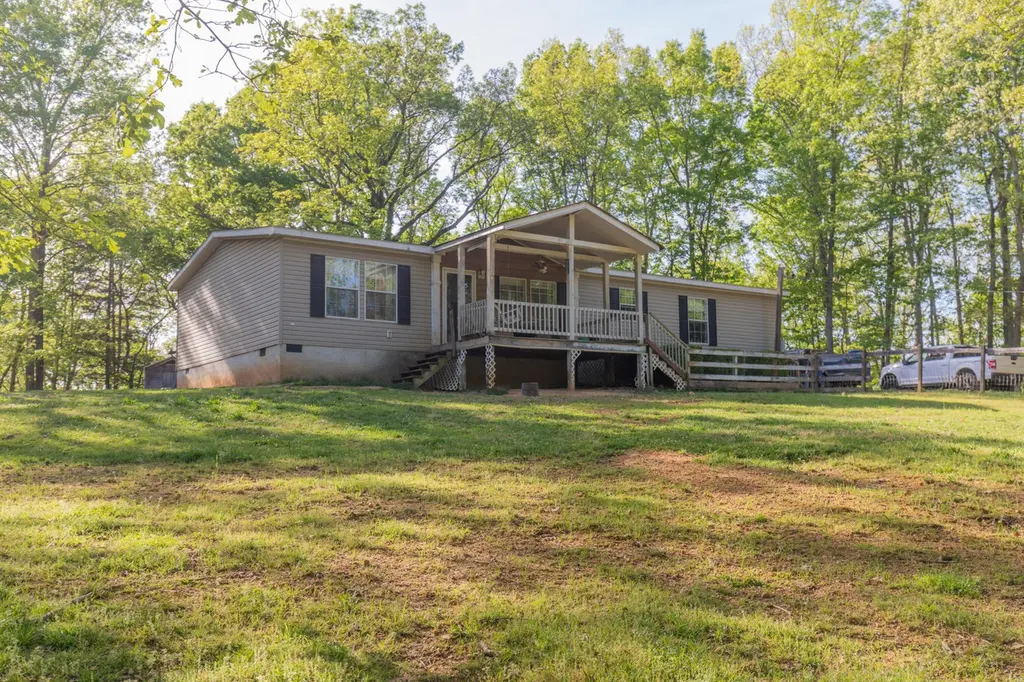
Welcome to this charming home situated on nearly 2 acres in Birchwood, Tennessee. Enjoy the privacy you've been looking for, along with a gently rolling yard, inviting front porch, and three versatile outbuildings. With ample parking and plenty of space for animals, hobbies, or outdoor living, this property offers the flexibility to fit your lifestyle. Inside, the home is clean, spacious, and thoughtfully designed with an open kitchen, cozy fireplace, and a dedicated laundry room. The primary suite is privately positioned on the opposite end of the home and features a double vanity and relaxing jetted tub. Built in 2013 and exceptionally well maintained, this home is move-in ready and waiti
Key facts
- Inviting front porch
- Ample parking
- Gently rolling yard
Tags
Property features AI
Exterior
- Parking: Gravel parking
- Utilities: Public water; Septic tank; Electricity connected; Water service connected
- Home design: Manufactured house; Single-story (one level); Residential single family manufactured home
- Construction: Vinyl siding; Shingle roof; Block foundation; Built as a manufactured home
- Exterior features: Private yard; Rain gutters; Exterior storage; Front covered porch; Full fencing; Barn(s) and shed(s) on property; Pasture and private views
Interior
- Kitchen: Refrigerator; Range hood; Electric oven; Electric cooktop; Dishwasher; Electric water heater
- Flooring: Carpet; Linoleum; Vinyl
- Bathrooms: 2 full bathrooms
- Heating & cooling: Heat pump heating; Electric heating; Central air conditioning; Electric cooling
- Interior features: Eat-in kitchen with kitchen island; Laminate counters; Open floorplan; Pantry; Living room fireplace
- Laundry & utility: Laundry room inside the home
Neighborhood map
What this means for you Summary
Snapshot
- This is a 3-bed/2.0-bath single-family listed at $195k.
Deal economics
- At list price, monthly cash flow is $-170 ($-2k/yr) — negative.
- To cash-flow at today's rent, offer at most $165k (15.4% below list).
- To meet the 1% rule (rent ≥ 1% of price), the offer needs to be $125k (35.8% below list).
- Recommended offer: $125k (35.8% below list) — sets the bar for 1% rule.
- Cap rate 5.2% vs local median 2.2% in Sale Creek — top-decile yield for the area; either an underpriced asset or a hidden risk that comps aren't pricing in. Stress-test before assuming the spread holds.
Location & tenants
- Location reads 62/100 on livability (#211 in TN) — a middle-class / working-renter tenant base. Strengths: cost of living A+, housing A+, crime A; Watch: health & safety C-, employment D, amenities F.
- Hamilton County (urban): math 31% / reading 31% proficiency, ranked #42 of 139 in TN (top 30%) — families likely to look elsewhere, expect single-tenant / working-renter base with shorter leases.
- Zoned schools: Snow Hill Elementary (math 48% / reading 39%, grade F, #184 of 952 statewide, top 19%, 657 students, 0% FRL); Hunter Middle School (math 40% / reading 35%, grade F, #54 of 333 statewide, top 16%, 738 students, 0% FRL); Central High School (math 8% / reading 32%, grade F, #183 of 332 statewide, top 59%, 749 students, 0% FRL) — zoned schools average 0% FRL vs 52% district-wide (52 pts lower); this property's tenant base skews higher-income than the district average.
- Market conditions: 60 active listings in the ZIP; 2,133 units permitted in Hamilton County in 2024 (405 in 5+ unit buildings).
Forward outlook
- In year one you build about $21k of equity ($1k loan paydown + $20k appreciation (10.0% local appreciation)).
- Hamilton County population projected at +23% by 2050 — long-run rental-demand tailwind backs the buy-and-hold thesis.
- By year 2, paydown + projected appreciation supports a ~$34k cash-out refi (75% LTV) — recoverable capital for the next deal without selling this one.
Negotiation context
- It's been on market 56 days — a 3% lower offer ($189k) is reasonable based on typical stale-listing flexibility.
Risks & watch-outs
- Climate carrying-cost: major wildfire risk; extreme-heat days projected 7→18/yr by 2055 (HVAC capex compounding) — expect insurance premiums to compound above CPI over the hold.
Questions for the listing agent
- What do current leases actually rent for vs. the listed asking? Can we see a recent rent roll and the last 12 months of T-12 income?
- It's been on market 56 days. Have you received any prior offers? Is the seller open to a 36% concession, seller financing, or rate buy-down credit?
- Is there a deadline driving the sale (1031 exchange, divorce, estate, relocation)? That informs how much negotiation room exists.
- Schools are D-rated, which usually means shorter tenancies and higher turnover. Who's the typical renter profile here, and what's been the actual vacancy rate?
- The area grade is low — what's the realistic commute time and amenity access for the typical tenant pool here? Any planned neighborhood developments (good or bad) we should know about?
- What's the average days-on-market for RENTAL listings here right now (not sales)? A rising rental-DOM trend means longer vacancies and softer asking-rent achievability than the comps imply.
- What's the recent tenant-quality profile in this submarket — average credit score on applications, eviction rate, late-payment / NSF rate, and stable-employment percentage? A property-management company in the area should have these aggregated.
- How much new for-sale + rental construction is in the pipeline within 1–3 miles? Heavy new supply typically softens prices + rents 12–24 months out; constrained supply supports both.
Investment metrics
- 1% rule
- 0.64% ✗
- Cap rate
- 5.25%
- Cash-on-cash
- -3.73%
- DSCR
- 0.83
- GRM
- 13.0
CMA / ARV
No comps found within radius.
Projected returns pro-forma
10.0% appreciation · 3.0% rent growth · sell at horizon
- IRR
- 21.6%
- Equity multiple
- 2.75×
- Total profit
- $95,300
- Equity at exit
- $175,671
- IRR
- 19.5%
- Equity multiple
- 6.29×
- Total profit
- $288,946
- Equity at exit
- $378,842
Cash invested: $54,600 (down + closing). Projections, not guarantees.
Landlord ↔ Tenant lean methodology
- Overall (STATE)
- 87 Strongly Landlord-Friendly
- State Tennessee
- 87 Strongly Landlord-Friendly · R+13
- County
- — inherits STATE
- City
- — inherits STATE
ZIP-level market 37308
- Home prices YoY
- 14.9%
- Active inventory
- 60
- Price-to-rent
- 13.0×
Monthly cashflow live
- Estimated rent
- $1,251 medium interval (Pro) →
- Mortgage (P&I)
- −$1,023
- Tax from tax record
- −$54 /mo · $649/yr
- Insurance
- −$81
- HOA
- −$0
- Vacancy / Maint / Mgmt
- −$263
- Net cashflow
- $-170
Break-even live
Sensitivity live
| Price | -10% $-59 | -5% $-114 | +0% $-170 | +5% $-225 | +10% $-280 |
|---|---|---|---|---|---|
| Rent | -10% $-268 | -5% $-219 | +0% $-170 | +5% $-120 | +10% $-71 |
| Rate | -1.0pp $-71 | -0.5pp $-120 | base $-170 | +0.5pp $-220 | +1.0pp $-272 |
UW: 25.0% down · 7.5% · 30yr · 1.5% tax · 5.0% vac · 8.0% maint · 8.0% mgmt
Financing live
Cash to close
- Down payment
- $48,750
- Closing costs
- $5,850
- Reserves months
- —
- Total cash needed
- —
Loan-product check · same deal, 3 products live
Conventional
25% down · 7.5% · 30yr
- Down + closing
- —
- Monthly P&I
- —
- Monthly cashflow
- —
- DSCR
- —
- Eligible?
- —
Personal DTI + credit; lowest rate.
DSCR
20% down · 8.5% · 30yr
- Down + closing
- —
- Monthly P&I
- —
- Monthly cashflow
- —
- DSCR
- —
- Eligible?
- —
No personal income docs; deal must DSCR.
Hard money
10% down · 12.0% · 12mo
- Down + closing
- —
- Monthly P&I
- —
- Monthly cashflow
- —
- DSCR
- —
- Eligible?
- —
Short-term bridge; refi at stabilization.
Listing history 12 events
-
2026-06-14status $195,000 Pending 56 DOM
-
2026-06-10days on market $195,000 Active 56 DOM
-
2026-06-09days on market $195,000 Active 55 DOM
-
2026-06-08days on market $195,000 Active 54 DOM
-
2026-06-07days on market $195,000 Active 53 DOM
-
2026-06-05days on market $195,000 Active 50 DOM
-
2026-06-03days on market $195,000 Active 49 DOM
-
2026-06-02days on market $195,000 Active 48 DOM
-
2026-06-01days on market $195,000 Active 47 DOM
-
2026-05-31days on market $195,000 Active 46 DOM
-
2026-05-30days on market $195,000 Active 45 DOM
-
2026-04-15$195,000 Active
ⓘ Source: listings_history table (triggers on properties + properties_extension) + one-shot
backfill from property_details.listing_events for pre-trigger history.
Tax reassessment forecast TN · Resets to sale price
- Current annual tax
- $649 · $54/mo
- Projected year-2 tax
- $1,384 · $115/mo
- Expected delta
- +$736/yr (+$61/mo · 113.3%)
ⓘ Screening estimate from a state-policy table — verify with the county assessor before closing.
Climate risk First Street
- Flood 1/10 Low FEMA zone X (unshaded) · 0% chance over 30 yrs
- Wildfire 6/10 Major
- Heat 5/10 Major 7 d/yr ≥104°F today · 18 d/yr by 30 yrs out
- Wind 3/10 Moderate 8% chance of damaging wind over 30 yrs
- Air quality 4/10 Moderate 3 unhealthy d/yr today · 4 by 30 yrs out
Nearby sold comps map
Loading sold comps map…
Walkable amenities ~0.75 mi
Loading nearby amenities…
Taxation est. · year 1
- Rental income
- $15,012
- − Mortgage interest
- −$10,923
- − Property taxes
- −$649
- − Insurance
- −$975
- − Repairs & maintenance
- −$1,201
- − Management
- −$1,201
- − Depreciation
- −$5,673
- Taxable loss
- −$5,610
- Est. tax savings @ 24.0%
- +$1,346
- After-tax cash flow
- $-689/yr
For passive investors: Depreciation is non-cash, so a rental often shows a tax loss while cash-flowing — sheltering income. Rental losses are passive: they offset passive income freely, and up to $25,000/yr can offset ordinary (W-2) income if you actively participate and your MAGI is under $100k (phasing out to $0 by $150k); unused losses carry forward. On sale, claimed depreciation is recaptured at up to 25%, and gains may owe capital-gains tax (a 1031 exchange can defer both). Figures are a year-1 estimate at your 24.0% rate — not tax advice; consult a CPA.
Schools (NCES district)
- District
- Hamilton County
- NCES district ID
- 4701590
- Math proficiency
- 31% ▼ -10.00%
- Reading proficiency
- 31% ▼ -3.00%
- Median HH income
- $47,456
- Composite
- 26.8/100
- National rank
- #7122
- State rank
- #42 of 139 in TN
Livability — Sale Creek
- Score
- 62/100
- State rank
- #211
- US rank
- #16188
Category grades
Schools grade is shown separately in the Schools card above.
Census & demographics
- City population
- 2,949
- Population (ZIP)
- 2,957
Population outlook (Hamilton County) Hauer SSP2
- Today (2025)
- 393,784 people
- By 2030
- 412,983 · +4.9%
- By 2040
- 449,502 · +14.1%
- By 2050
- 484,341 · +23.0%
- By 2075
- 565,746 · +43.7%
- By 2100
- 618,394 · +57.0%
Race, ethnicity, and origin ACS 2023
- Neighborhood character
- Predominantly White (93%)
- Race & ethnicity
- White 93% Two or more races 4% Black 2% Hispanic / Latino 1%
- Common ancestry
- Serbian 4% Iranian 2% Slovak 2%
- Foreign-born
- 0%
Political lean MEDSL · Hamilton
- 2024 margin
- R (+13.1) · D 42.7% · R 55.7% · Other 1.6%
- 2008→2024 swing
- -1.2pp toward R · 2008: -11.8pp · 2024: -13.1pp
- All cycles
- 2024: R+13.1 2020: R+9.7 2016: R+16.6 2012: R+14.8 2008: R+11.8
Not yet ingested
- Civics
- —
Market trends
- HPI YoY
- ▲ 47.11%
- Current HPI
- 363.0832
- Rent YoY
- —
- Metro
- —
- State GDP YoY
- ▲ 2.78%
- F500 in state
- 22
Industry mix (Fortune 500 HQ in TN)
| Industry | F500 HQs | Revenue |
|---|---|---|
| Healthcare | 3 | $91B |
|
||
| Retail | 3 | $72B |
|
||
| Transportation / Logistics | 1 | $88B |
|
||
| Paper / Packaging | 1 | $19B |
|
||
| Insurance | 1 | $13B |
|
||
| Energy | 1 | $12B |
|
||
Price history
1 event — show timeline
- 2026-04-15 Listed $195,000 GCAR
Property tax history
+1.8%/yrLatest (2025): $649 · +29.1% YoY. Source: county tax records.
Cash-flow waterfall
monthlySold comps — $/sqft
last 12 mo · ≤1 miLoading sold comps…