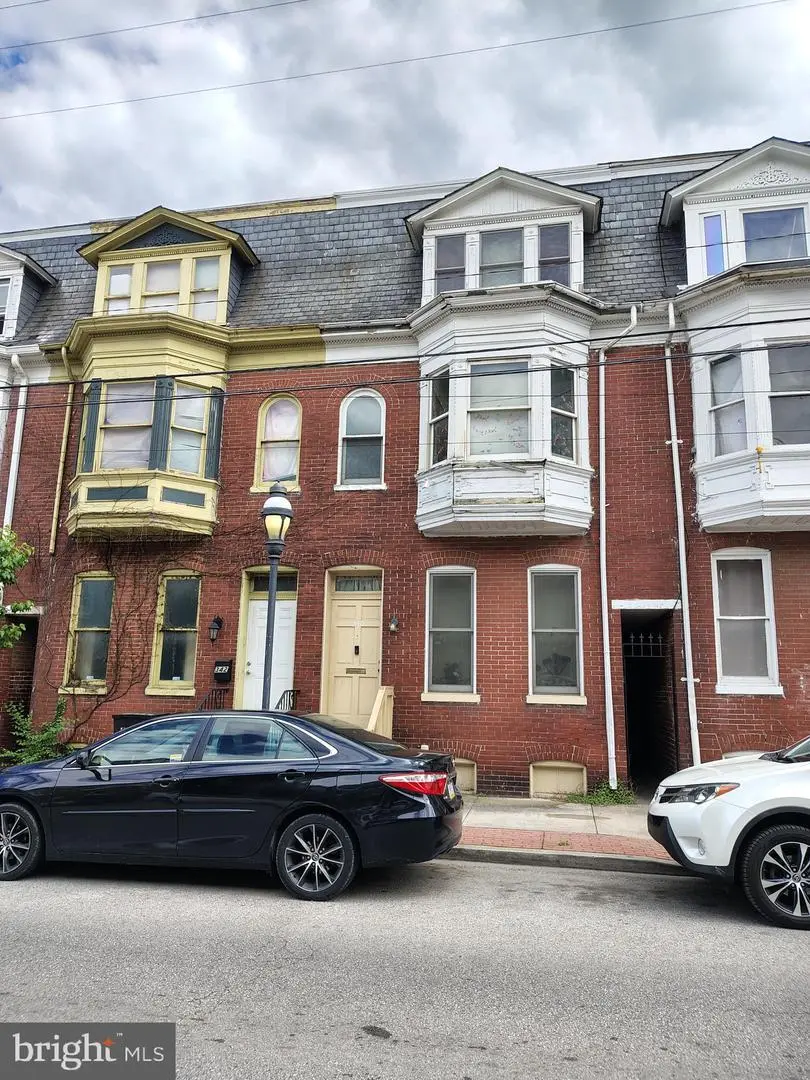
340 E Princess St · York, PA
Flood risk 1/10 · Minimal
- FEMA flood zone
- X (unshaded)
- Chance of flooding over 30 yrs
- 0.0%
- Est. flood insurance / yr
- $473 – $860
Fire risk 1/10 · Minimal
- Est. fire insurance / yr
- $511 – $949
Heat risk 6/10 · Moderate
- Hot days now (above 102°F)
- 7 days/yr
- Hot days in 30 yrs
- 15 days/yr
Wind risk 4/10 · Minor
- Chance of severe wind over 30 yrs
- 10.0%
Air-quality risk 3/10 · Minor
- Unhealthy air days now
- 3 days/yr
- Unhealthy air days in 30 yrs
- 5 days/yr
Risk factors via First Street. Map © Google.
Why this score? — see what drove the B+ grade
The composite is a weighted blend of 9 inputs, each scored 0–100. Each bar is that input's sub-score; the figure is the points it added to the 100-point composite (weight × sub-score).
- Cash flow +30.0/30.0
- ARV discount +15.0/15.0
- 1% rule +10.0/10.0
- DSCR +10.0/10.0
- Livability +3.8/5.0
- Rent growth +3.6/5.0
- Condition / age +2.5/5.0
- Schools +0.8/10.0
- Appreciation +0.0/10.0
$99,000
🖨 Deal sheet 📄 Offer letter ✓ Due diligence
Listing remarks
3BR/1BA townhouse with strong value-add potential. Main level includes living, dining, and kitchen with new appliances; 2 bedrooms and bath on second floor. Unfinished third floor adds 2 bedrooms but needs roof repair. Cemented backyard, rear garage with separate entrance, unfinished basement, and 2-year-old hot water system.
Key facts
- Garage
- Built 1890
- Listed 21 days
Property features AI
Finance
- Financial info: Property taxes listed (annual and breakdown available)
Exterior
- Parking: Rear-entry garage (1 space); Parking garage
- Utilities: Water source: Other
- Home design: Interior townhouse/rowhouse; Fee simple ownership
- Construction: Foundation: Other; Year built per assessor
- Exterior features: Not in a federal flood zone; Above grade and below grade other structures
Interior
- Bedrooms: Three bedrooms on the upper level
- Bathrooms: One full bathroom
- Heating & cooling: Heating: Other; Cooling: Other; Tankless hot water
- Interior features: No basement; Living area per assessor
Neighborhood map
What this means for you Summary
Snapshot
- This is a 5-bed/1.0-bath townhouse listed at $99k.
Deal economics
- At list price, monthly cash flow is $596 ($7k/yr) — positive.
- The deal already cash-flows at list — no discount required.
- Meets the 1% rule at list price ($2k rent vs $99k).
- Recommended offer: $98k (1.5% below list) — sets the bar for market timing.
- Cap rate 13.5% vs local median 5.0% in York — top-decile yield for the area; either an underpriced asset or a hidden risk that comps aren't pricing in. Stress-test before assuming the spread holds.
Location & tenants
- Location reads 75/100 on livability (#427 in PA, #3,987 nationally) — a middle-class / working-renter tenant base. Strengths: cost of living A+, health & safety A+, housing A; Watch: amenities D+, crime F, employment F.
- York City SD (urban): math 4% / reading 16% proficiency, ranked #534 of 539 in PA (top 99%) — low school quality limits family demand, transient renter base, plan for 1-2y turnover; 72% free/reduced lunch — lower-income household profile, screen leases tightly.
- Market conditions: Rents rising fast (+4.4%/yr); 213 active listings in the ZIP; 11 comparable units currently listed for rent nearby; rentals at typical pace (median 21d on market — plan ~3-4 weeks tenant-placement turnaround); 45% of comp listings sitting > 30 days — soft ceiling on asking rent; solid renter incomes; 1,328 units permitted in York County in 2024 (338 in 5+ unit buildings).
Forward outlook
- Local home prices are declining (-3.0%/yr); year-one equity from $684 of loan paydown is wiped out by about $3k of value loss. Plan a longer hold.
- At projected returns (-3.0% appreciation + 4.4% rent growth), your $28k cash investment doubles in ~5 years — after that, you're playing with house money.
Negotiation context
- It's been on market 22 days — a 2% lower offer ($98k) is reasonable based on typical stale-listing flexibility.
- Current owner paid $54k; list at $99k implies a 83% gain — meaningful room to come down on a strong offer.
Risks & watch-outs
- Watch-outs: built in 1890 — expect roof / HVAC / electrical / plumbing capex.
- Climate carrying-cost: extreme-heat days projected 7→15/yr by 2055 (HVAC capex compounding) — expect insurance premiums to compound above CPI over the hold.
Questions for the listing agent
- Built in 1890 — when were the roof, HVAC, electrical panel, plumbing, and water heater last replaced?
- Is there a deadline driving the sale (1031 exchange, divorce, estate, relocation)? That informs how much negotiation room exists.
- Crime grade is F in this area — have there been break-ins, vandalism, or insurance claims at this property in the last 3 years? What carrier currently insures it and at what premium?
- What's the average days-on-market for RENTAL listings here right now (not sales)? A rising rental-DOM trend means longer vacancies and softer asking-rent achievability than the comps imply.
- What's the recent tenant-quality profile in this submarket — average credit score on applications, eviction rate, late-payment / NSF rate, and stable-employment percentage? A property-management company in the area should have these aggregated.
- How much new for-sale + rental construction is in the pipeline within 1–3 miles? Heavy new supply typically softens prices + rents 12–24 months out; constrained supply supports both.
Investment metrics
- 1% rule
- 1.70% ✓
- Cap rate
- 13.52%
- Cash-on-cash
- 25.82%
- DSCR
- 2.15
- GRM
- 4.9
CMA / ARV
- ARV (median comp)
- $155,673
- List price
- $99,000
- Delta
- -36.41%
- Verdict
- UNDERPRICED
- Comps
- 20 within 1.0 mi
Show comp detail 12 sales within ~0.75 mi
| Address | Dist | Beds/Ba | Sqft | Sold | Price | $/sf | Match |
|---|---|---|---|---|---|---|---|
| 350 E Poplar St | 0.05mi | 5/1.0 | 1,740 (-5%) | 2mo | $125,000 | $72 | 87 |
| 442 E Prospect St | 0.14mi | 5/1.5 | 1,926 (+5%) | 0mo | $189,000 | $98 | 83 |
| 249 E Princess St | 0.11mi | 4/1.5 (-1) | 1,741 (-5%) | 0mo | $189,900 | $109 | 79 |
| 117 S Pine St | 0.10mi | 5/1.0 | 2,040 (+11%) | 2mo | $174,000 | $85 | 76 |
| 802 Chestnut St | 0.69mi | 5/1.0 | 1,860 (+1%) | 1mo | $145,000 | $78 | 65 |
| 217 E Cottage Pl | 0.47mi | 5/1.5 | 2,011 (+10%) | 1mo | $210,000 | $104 | 59 |
| 628 Chestnut St | 0.59mi | 5/2.0 | 1,740 (-5%) | 3mo | $153,500 | $88 | 58 |
| 830 E Philadelphia St | 0.70mi | 5/1.0 | 1,924 (+5%) | 2mo | $150,000 | $78 | 57 |
| 41 W Philadelphia St | 0.59mi | 5/2.0 | 1,992 (+8%) | 3mo | $300,000 | $151 | 52 |
| 702 York St | 0.69mi | 4/1.0 (-1) | 1,696 (-8%) | 1mo | $165,000 | $97 | 49 |
| 707 York St | 0.70mi | 4/1.0 (-1) | 1,696 (-8%) | 1mo | $165,000 | $97 | 48 |
| 740 Cleveland Ave | 0.69mi | 4/1.0 (-1) | 1,572 (-14%) | 1mo | $145,000 | $92 | 38 |
Match score weights: distance 35% · size 25% · config 20% · recency 20%. Top-matched comps best support the ARV.
Projected returns pro-forma
-3.0% appreciation · 4.43% rent growth · sell at horizon
- IRR
- 21.2%
- Equity multiple
- 1.88×
- Total profit
- $24,464
- Equity at exit
- $14,761
- IRR
- 30.3%
- Equity multiple
- 3.92×
- Total profit
- $80,841
- Equity at exit
- $8,560
Cash invested: $27,720 (down + closing). Projections, not guarantees.
Landlord ↔ Tenant lean methodology
- Overall (STATE)
- 62 Landlord-Friendly
- State Pennsylvania
- 62 Landlord-Friendly · EVEN
- County
- — inherits STATE
- City
- — inherits STATE
ZIP-level market 17403
- Home prices YoY
- -26.9%
- Rents YoY
- 4.4%
- Active inventory
- 213
- Price-to-rent
- 4.9×
Monthly cashflow live
- Estimated rent
- $1,685 high interval (Pro) →
- Mortgage (P&I)
- −$519
- Tax from tax record
- −$175 /mo · $2,094/yr
- Insurance
- −$41
- HOA
- −$0
- Vacancy / Maint / Mgmt
- −$354
- Net cashflow
- $596
Break-even live
UW: 25.0% down · 7.5% · 30yr · 1.5% tax · 5.0% vac · 8.0% maint · 8.0% mgmt
Financing live
Cash to close
- Down payment
- $24,750
- Closing costs
- $2,970
- Reserves months
- —
- Total cash needed
- —
Loan-product check · same deal, 3 products live
Conventional
25% down · 7.5% · 30yr
- Down + closing
- —
- Monthly P&I
- —
- Monthly cashflow
- —
- DSCR
- —
- Eligible?
- —
Personal DTI + credit; lowest rate.
DSCR
20% down · 8.5% · 30yr
- Down + closing
- —
- Monthly P&I
- —
- Monthly cashflow
- —
- DSCR
- —
- Eligible?
- —
No personal income docs; deal must DSCR.
Hard money
10% down · 12.0% · 12mo
- Down + closing
- —
- Monthly P&I
- —
- Monthly cashflow
- —
- DSCR
- —
- Eligible?
- —
Short-term bridge; refi at stabilization.
Rent comps 11 comps
| Address | Beds | Baths | Sqft | Rent | $/sqft | DOM | Units | Dist |
|---|---|---|---|---|---|---|---|---|
| 339 E Market St Unit 1 York, PA | 4.0 | 1.5 | 1600 | $1,650 | $1.03 | 21d | 1 | 0.22mi |
| 631 Wallace St Unit 631 York, PA | 4.0 | 1.0 | 1545 | $1,325 | $0.86 | 13d | 1 | 0.54mi |
| 720 Chestnut St Apt 2 York, PA | 4.0 | 1.0 | 1400 | $1,300 | $0.93 | 13d | 1 | 0.65mi |
| 213 Kurtz Ave York, PA | 5.0 | 1.0 | 1921 | $1,850 | $0.96 | 13d | 1 | 0.77mi |
| 119 W Jackson St York, PA | 4.0 | 1.0 | 1800 | $1,395 | $0.78 | 43d | 1 | 0.79mi |
| 289 Union St York, PA | 4.0 | 1.0 | 1450 | $1,600 | $1.10 | 43d | 1 | 0.95mi |
| 330 Smyser St York, PA | 5.0 | 1.0 | 1634 | $1,425 | $0.87 | 43d | 1 | 0.96mi |
| 26 N West St York, PA | 6.0 | 2.0 | 2100 | $2,200 | $1.05 | 21d | 1 | 1.33mi |
| 132 N West St York, PA | 4.0 | 1.0 | 1560 | $1,600 | $1.03 | 13d | 1 | 1.36mi |
| 121 S Belvidere Ave Unit 121 York, PA | 5.0 | 1.5 | 1846 | $1,450 | $0.79 | 43d | 1 | 1.42mi |
| 709 W Princess St York, PA | 5.0 | 1.0 | 1829 | $1,425 | $0.78 | 43d | 1 | 1.44mi |
Listing history 4 events
-
2026-05-05$99,000 Active 327-char remark
-
2006-11-17soldstatus $54,000
-
1993-05-04soldstatus $21,900
-
1992-12-07soldstatus $21,900
ⓘ Source: listings_history table (triggers on properties + properties_extension) + one-shot
backfill from property_details.listing_events for pre-trigger history.
Tax reassessment forecast PA · Partial reset (capped growth)
- Current annual tax
- $2,094 · $175/mo
- Projected year-2 tax
- $2,094 · $175/mo
- Expected delta
- $0/yr ($0/mo · 0.0%)
ⓘ Screening estimate from a state-policy table — verify with the county assessor before closing.
Climate risk First Street
- Flood 1/10 Low FEMA zone X (unshaded) · 0% chance over 30 yrs
- Wildfire 1/10 Low
- Heat 6/10 Major 7 d/yr ≥102°F today · 15 d/yr by 30 yrs out
- Wind 4/10 Moderate 10% chance of damaging wind over 30 yrs
- Air quality 3/10 Moderate 3 unhealthy d/yr today · 5 by 30 yrs out
Nearby sold comps map
Loading sold comps map…
Walkable amenities ~0.75 mi
Loading nearby amenities…
Taxation est. · year 1
- Rental income
- $20,224
- − Mortgage interest
- −$5,546
- − Property taxes
- −$2,094
- − Insurance
- −$495
- − Repairs & maintenance
- −$1,618
- − Management
- −$1,618
- − Depreciation
- −$2,880
- Taxable income
- $5,973
- Est. tax owed @ 24.0%
- −$1,434
- After-tax cash flow
- $5,724/yr
For passive investors: Depreciation is non-cash, so a rental often shows a tax loss while cash-flowing — sheltering income. Rental losses are passive: they offset passive income freely, and up to $25,000/yr can offset ordinary (W-2) income if you actively participate and your MAGI is under $100k (phasing out to $0 by $150k); unused losses carry forward. On sale, claimed depreciation is recaptured at up to 25%, and gains may owe capital-gains tax (a 1031 exchange can defer both). Figures are a year-1 estimate at your 24.0% rate — not tax advice; consult a CPA.
Schools (NCES district)
- District
- York City SD
- NCES district ID
- 4226820
- Math proficiency
- 4% ▼ -7.00%
- Reading proficiency
- 16% ▼ -9.00%
- Median HH income
- $29,470
- Composite
- 7.61/100
- National rank
- #9943
- State rank
- #534 of 539 in PA
Livability — York
- Score
- 75/100
- State rank
- #427
- US rank
- #3987
Category grades
Schools grade is shown separately in the Schools card above.
Census & demographics
- Census place
- York, PA
- County
- York County · 278,806 people
- City population
- 184,764
- Metro
- York-Hanover, PA
- Population (ZIP)
- 40,287
- Household income
- $75,384
- Rent vs Own
- Severe rent burden
- 1305.0
Population outlook (York County) Hauer SSP2
- Today (2025)
- 454,205 people
- By 2030
- 457,407 · +0.7%
- By 2040
- 457,529 · +0.7%
- By 2050
- 448,261 · -1.3%
- By 2075
- 427,388 · -5.9%
- By 2100
- 384,218 · -15.4%
Race, ethnicity, and origin ACS 2023
- Neighborhood character
- Diverse neighborhood (Simpson 0.58)
- Race & ethnicity
- White 60% Hispanic / Latino 20% Black 12% Two or more races 9% Asian 3%
- Hispanic origin (detail)
- Mexican 3% Puerto Rican 10% Dominican 3%
- Common ancestry
- Romanian 3% Lithuanian 1% Slovak 1%
- Foreign-born
- 10% · Canada, Vietnam, Jamaica
- Languages at home
- 81% English-only · Spanish 14% Other Indo-European 1% Arabic 1%
Political lean MEDSL · York
- 2024 margin
- Strong R (+25.3) · D 36.9% · R 62.1%
- 2008→2024 swing
- -11.7pp toward R · 2008: -13.6pp · 2024: -25.3pp
- All cycles
- 2024: R+25.3 2020: R+24.6 2016: R+29.3 2012: R+21.2 2008: R+13.6
Not yet ingested
- Civics
- —
Market trends
- HPI YoY
- ▼ -104.51%
- Current HPI
- 284.0731
- Rent YoY
- ▲ 4.43%
- Metro
- York-Hanover, PA
- State GDP YoY
- ▲ 1.68%
- F500 in state
- 34
Industry mix (Fortune 500 HQ in PA)
| Industry | F500 HQs | Revenue |
|---|---|---|
| Healthcare | 2 | $309B |
|
||
| Insurance | 2 | $27B |
|
||
| Telecommunications / Media | 1 | $124B |
|
||
| Industrial Distribution | 1 | $22B |
|
||
| Financial Services | 1 | $20B |
|
||
| Chemicals / Materials | 1 | $18B |
|
||
Price history
+146.6% since first listed3 events — show timeline
- 2006-11-17 Sold (Public Records) $54,000 Public Records
- 1993-05-04 Sold (Public Records) $21,900 Public Records
- 1992-12-07 Sold (Public Records) $21,900 Public Records
Property tax history
+0.8%/yrLatest (2026): $2,094 · +1.6% YoY. Source: county tax records.
Cash-flow waterfall
monthlySold comps — $/sqft
last 12 mo · ≤1 miLoading sold comps…