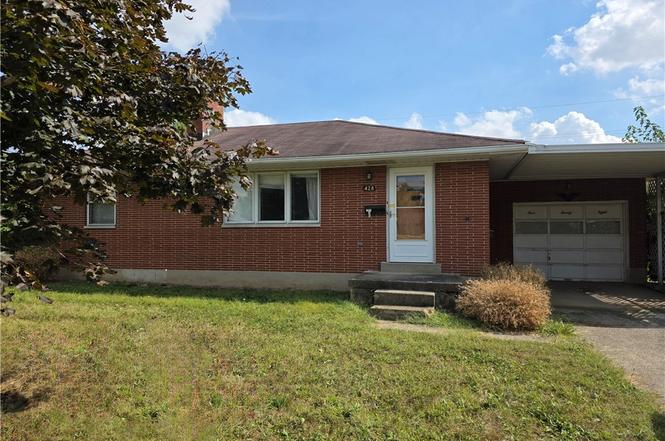
428 E Cottage Ave · West Carrollton, OH
Flood risk 4/10 · Minor
- FEMA flood zone
- X
- Chance of flooding over 30 yrs
- 0.2%
- Est. flood insurance / yr
- $473 – $860
Fire risk 1/10 · Minimal
- Est. fire insurance / yr
- $713 – $1,323
Heat risk 4/10 · Minor
- Hot days now (above 101°F)
- 7 days/yr
- Hot days in 30 yrs
- 19 days/yr
Wind risk 2/10 · Minimal
- Chance of severe wind over 30 yrs
- 0.0%
Air-quality risk 3/10 · Minor
- Unhealthy air days now
- 3 days/yr
- Unhealthy air days in 30 yrs
- 5 days/yr
Risk factors via First Street. Map © Google.
Why this score? — see what drove the C- grade
The composite is a weighted blend of 9 inputs, each scored 0–100. Each bar is that input's sub-score; the figure is the points it added to the 100-point composite (weight × sub-score).
- ARV discount +15.0/15.0
- Cash flow +14.6/30.0
- 1% rule +5.3/10.0
- DSCR +4.5/10.0
- Schools +3.4/10.0
- Livability +3.2/5.0
- Rent growth +2.5/5.0
- Condition / age +2.5/5.0
- Appreciation +0.0/10.0
$129,900
🖨 Deal sheet (PDF) 📄 Offer letter ✓ Due diligence
Listing remarks
Opportunity awaits! This charming 3-bedroom, 2-bath brick ranch located in a quiet neighborhood in the heart of West Carrollton offers solid bones and tons of potential for the right buyer. Home features a spacious living room with fireplace, dining room area and an eat-in kitchen. Featuring an unfinished basement that’s ready for your finishing ideas, a nice backyard with a covered patio, and plenty of room to create your dream outdoor space and entertaining area. Home includes a one-car-attached garage plus a carport for extra parking convenience. The home needs some TLC and updates but offers great potential for sweat equity — perfect for investors, renovators, or buyers look
Key facts
- Unfinished basement
- Covered patio
- Brick ranch
Tags
Neighborhood map
What this means for you Summary
Snapshot
- This is a 3-bed/1.5-bath single-family listed at $130k.
Deal economics
- At list price, monthly cash flow is $31 ($377/yr) — positive.
- The deal already cash-flows at list — no discount required.
- Meets the 1% rule at list price ($1k rent vs $130k).
- Recommended offer: $128k (1.5% below list) — sets the bar for market timing.
- Cap rate 6.6% vs local median 4.7% in West Carrollton — top-decile yield for the area; either an underpriced asset or a hidden risk that comps aren't pricing in. Stress-test before assuming the spread holds.
Location & tenants
- Location reads 65/100 on livability (#712 in OH) — a middle-class / working-renter tenant base. Strengths: cost of living A+, housing A+; Watch: crime C-, amenities F, commute F.
- West Carrollton City (suburban): math 34% / reading 46% proficiency, ranked #540 of 656 in OH (top 82%) — families likely to look elsewhere, expect single-tenant / working-renter base with shorter leases.
- Zoned schools: West Carrollton Early Childhood Center (656 students, 45% FRL); West Carrollton Middle School (math 27% / reading 43%, grade F, #546 of 654 statewide, top 83%, 508 students, 62% FRL); West Carrollton High School (math 17% / reading 57%, grade F, #564 of 781 statewide, top 74%, 951 students, 55% FRL) — zoned schools at 54% FRL track the district average.
- Market conditions: 81 active listings in the ZIP; 6 comparable units currently listed for rent nearby; rentals leasing fast (median 5d on market — plan ~1-2 weeks tenant-placement turnaround); 907 units permitted in Montgomery County in 2024 (416 in 5+ unit buildings).
Forward outlook
- Local home prices are declining (-3.0%/yr); year-one equity from $898 of loan paydown is wiped out by about $4k of value loss. Plan a longer hold.
- Montgomery County population projected at -10% by 2050 — secular population decline; favor cash flow + early exit over multi-decade hold.
Negotiation context
- It's been on market 20 days — a 2% lower offer ($128k) is reasonable based on typical stale-listing flexibility.
- 2 sale attempts since 2y ago with the ask held roughly flat each time — persistent listings suggest the price (not the market) is what's stuck; bring a comps-based counter.
- Current owner paid $82k; list at $130k implies a 58% gain — meaningful room to come down on a strong offer.
Risks & watch-outs
- Watch-outs: property tax is 2.7% of price; built in 1959 — expect roof / HVAC / electrical / plumbing capex.
Questions for the listing agent
- Built in 1959 — when were the roof, HVAC, electrical panel, plumbing, and water heater last replaced?
- Property tax is high relative to price — has the assessment been appealed recently, and will the sale trigger a re-assessment?
- Is there a deadline driving the sale (1031 exchange, divorce, estate, relocation)? That informs how much negotiation room exists.
- What's the average days-on-market for RENTAL listings here right now (not sales)? A rising rental-DOM trend means longer vacancies and softer asking-rent achievability than the comps imply.
- What's the recent tenant-quality profile in this submarket — average credit score on applications, eviction rate, late-payment / NSF rate, and stable-employment percentage? A property-management company in the area should have these aggregated.
- How much new for-sale + rental construction is in the pipeline within 1–3 miles? Heavy new supply typically softens prices + rents 12–24 months out; constrained supply supports both.
Investment metrics
- 1% rule
- 1.03% ✓
- Cap rate
- 6.58%
- Cash-on-cash
- 1.04%
- DSCR
- 1.05
- GRM
- 8.1
CMA / ARV
- ARV (on-the-fly)
- $190,344
- Comps found
- 12
Show comp detail 12 sales within ~0.75 mi
| Address | Dist | Beds/Ba | Sqft | Sold | Price | $/sf | Match |
|---|---|---|---|---|---|---|---|
| 434 E Cottage Ave | 0.01mi | 3/2.0 | 1,133 (0%) | 4mo | $180,000 | $159 | 94 |
| 410 Cedar St | 0.09mi | 3/1.0 | 1,133 (0%) | 8mo | $189,900 | $168 | 87 |
| 517 Richie Dr | 0.11mi | 3/2.0 | 1,133 (0%) | 10mo | $181,000 | $160 | 85 |
| 234 William St | 0.22mi | 3/1.0 | 1,056 (-7%) | 8mo | $175,000 | $166 | 70 |
| 426 Catherine Ave | 0.14mi | 3/2.0 | 1,278 (+13%) | 6mo | $182,000 | $142 | 65 |
| 321 Windsor Ct | 0.43mi | 3/1.0 | 1,055 (-7%) | 4mo | $180,000 | $171 | 63 |
| 131 Savoy Ave | 0.44mi | 3/1.5 | 1,033 (-9%) | 9mo | $193,000 | $187 | 57 |
| 121 E Circle Dr | 0.66mi | 3/1.0 | 1,162 (+3%) | 8mo | $117,500 | $101 | 56 |
| 509 Windsor Ave | 0.58mi | 3/1.0 | 975 (-14%) | 1mo | $175,000 | $179 | 47 |
| 404 Savoy Ave | 0.52mi | 3/1.0 | 975 (-14%) | 9mo | $195,000 | $200 | 44 |
| 102 Allen Pl | 0.68mi | 2/1.0 (-1) | 1,015 (-10%) | 1mo | $120,000 | $118 | 43 |
| 417 Windsor Ave | 0.53mi | 3/1.0 | 975 (-14%) | 10mo | $183,000 | $188 | 42 |
Match score weights: distance 35% · size 25% · config 20% · recency 20%. Top-matched comps best support the ARV.
Projected returns pro-forma
-3.0% appreciation · 3.0% rent growth · sell at horizon
- IRR
- -14.5%
- Equity multiple
- 0.48×
- Total profit
- $-18,945
- Equity at exit
- $19,369
- IRR
- -5.7%
- Equity multiple
- 0.63×
- Total profit
- $-13,504
- Equity at exit
- $11,231
Cash invested: $36,372 (down + closing). Projections, not guarantees.
Landlord ↔ Tenant lean methodology
- Overall (STATE)
- 73 Landlord-Friendly
- State Ohio
- 73 Landlord-Friendly · R+6
- County
- — inherits STATE
- City
- — inherits STATE
ZIP-level market 45449
- Active inventory
- 81
- Price-to-rent
- 8.1×
Monthly cashflow live
- Estimated rent
- $1,344 high interval (Pro) →
- Mortgage (P&I)
- −$681
- Tax from tax record
- −$295 /mo · $3,543/yr
- Insurance
- −$54
- HOA
- −$0
- Vacancy / Maint / Mgmt
- −$282
- Net cashflow
- $31
Break-even live
Sensitivity live
| Price | -10% $105 | -5% $68 | +0% $31 | +5% $-5 | +10% $-42 |
|---|---|---|---|---|---|
| Rent | -10% $-75 | -5% $-22 | +0% $31 | +5% $85 | +10% $138 |
| Rate | -1.0pp $97 | -0.5pp $64 | base $31 | +0.5pp $-2 | +1.0pp $-36 |
UW: 25.0% down · 7.5% · 30yr · 1.5% tax · 5.0% vac · 8.0% maint · 8.0% mgmt
Financing live
Cash to close
- Down payment
- $32,475
- Closing costs
- $3,897
- Reserves months
- —
- Total cash needed
- —
Loan-product check · same deal, 3 products live
Conventional
25% down · 7.5% · 30yr
- Down + closing
- —
- Monthly P&I
- —
- Monthly cashflow
- —
- DSCR
- —
- Eligible?
- —
Personal DTI + credit; lowest rate.
DSCR
20% down · 8.5% · 30yr
- Down + closing
- —
- Monthly P&I
- —
- Monthly cashflow
- —
- DSCR
- —
- Eligible?
- —
No personal income docs; deal must DSCR.
Hard money
10% down · 12.0% · 12mo
- Down + closing
- —
- Monthly P&I
- —
- Monthly cashflow
- —
- DSCR
- —
- Eligible?
- —
Short-term bridge; refi at stabilization.
Rent comps 6 comps
| Address | Beds | Baths | Sqft | Rent | $/sqft | DOM | Units | Dist |
|---|---|---|---|---|---|---|---|---|
| 100 N Alex Rd Dayton, OH | 2.0 | 1.0 | 960 | $1,124 | $1.17 | 4d | 8 | 0.30mi |
| 113 W Main St West Carrollton, OH | 3.0 | 1.0 | 1120 | $1,200 | $1.07 | 4d | 1 | 0.51mi |
| 1130 Bishop Dr Unit 1130-C Dayton, OH | 2.0 | 1.0 | 850 | $880 | $1.04 | 4d | 1 | 1.03mi |
| 1644 Villa South Dr Dayton, OH | 2.0 | 1.5 | 1000 | $1,500 | $1.50 | 45d | 1 | 1.19mi |
| 1735 Mars Hill Dr Dayton, OH | 2.0 | 1.0–2.0 | 968 | $1,162 | $1.20 | 4d | 4 | 1.25mi |
| 1308 Camp Hill Way Dayton, OH | 2.0 | 2.0 | 1000 | $1,175 | $1.18 | 4d | 11 | 1.45mi |
Listing history 9 events
-
2025-11-03status Pending
-
2025-10-14$129,900 Active
-
2024-03-12historical
-
2024-03-12status Pending
-
2024-02-02historical Active/Pending
-
2024-01-30$114,900 Active
-
1993-07-21soldstatus $82,000
-
1993-07-21soldstatus $82,000
-
1993-07-12soldstatus $82,000
ⓘ Source: listings_history table (triggers on properties + properties_extension) + one-shot
backfill from property_details.listing_events for pre-trigger history.
Tax reassessment forecast OH · Partial reset (capped growth)
- Current annual tax
- $3,543 · $295/mo
- Projected year-2 tax
- $3,543 · $295/mo
- Expected delta
- $0/yr ($0/mo · 0.0%)
ⓘ Screening estimate from a state-policy table — verify with the county assessor before closing.
Climate risk First Street
- Flood 4/10 Moderate FEMA zone X · 20% chance over 30 yrs
- Wildfire 1/10 Low
- Heat 4/10 Moderate 7 d/yr ≥101°F today · 19 d/yr by 30 yrs out
- Wind 2/10 Low 0% chance of damaging wind over 30 yrs
- Air quality 3/10 Moderate 3 unhealthy d/yr today · 5 by 30 yrs out
Nearby sold comps map
Loading sold comps map…
Walkable amenities ~0.75 mi
Loading nearby amenities…
Taxation est. · year 1
- Rental income
- $16,132
- − Mortgage interest
- −$7,276
- − Property taxes
- −$3,543
- − Insurance
- −$650
- − Repairs & maintenance
- −$1,291
- − Management
- −$1,291
- − Depreciation
- −$3,779
- Taxable loss
- −$1,697
- Est. tax savings @ 24.0%
- +$407
- After-tax cash flow
- $785/yr
For passive investors: Depreciation is non-cash, so a rental often shows a tax loss while cash-flowing — sheltering income. Rental losses are passive: they offset passive income freely, and up to $25,000/yr can offset ordinary (W-2) income if you actively participate and your MAGI is under $100k (phasing out to $0 by $150k); unused losses carry forward. On sale, claimed depreciation is recaptured at up to 25%, and gains may owe capital-gains tax (a 1031 exchange can defer both). Figures are a year-1 estimate at your 24.0% rate — not tax advice; consult a CPA.
Schools (NCES district)
- District
- West Carrollton City
- NCES district ID
- 3904505
- Math proficiency
- 34% ▼ -12.00%
- Reading proficiency
- 46% ▼ -9.00%
- Median HH income
- $42,209
- Composite
- 33.71/100
- National rank
- #5380
- State rank
- #540 of 656 in OH
Livability — West Carrollton
- Score
- 65/100
- State rank
- #712
- US rank
- #12835
Category grades
Schools grade is shown separately in the Schools card above.
Census & demographics
- Census place
- West Carrollton, OH
- County
- Montgomery County · 459,541 people
- City population
- 19,066
- Metro
- Dayton-Kettering, OH
- Population (ZIP)
- 19,066
- Household income
- $63,800
- Rent vs Own
- Severe rent burden
- 745.0
Population outlook (Montgomery County) Hauer SSP2
- Today (2025)
- 523,241 people
- By 2030
- 514,948 · -1.6%
- By 2040
- 493,378 · -5.7%
- By 2050
- 469,639 · -10.2%
- By 2075
- 418,360 · -20.0%
- By 2100
- 353,315 · -32.5%
Race, ethnicity, and origin ACS 2023
- Neighborhood character
- Predominantly White (71%)
- Race & ethnicity
- White 71% Black 13% Two or more races 9% Hispanic / Latino 6% Asian 3%
- Hispanic origin (detail)
- Mexican 4% Puerto Rican 1%
- Common ancestry
- Italian 2% Slovak 2% Lithuanian 1%
- Foreign-born
- 8% · Canada, China, Vietnam
- Languages at home
- 89% English-only · Spanish 5% Arabic 3% Chinese 2%
Political lean MEDSL · Montgomery
- 2024 margin
- Toss-up / Even · D 49.8% · R 49.3%
- 2008→2024 swing
- -5.8pp toward R · 2008: 6.2pp · 2024: 0.5pp
- All cycles
- 2024: D+0.5 2020: D+2.2 2016: R+1.2 2012: D+3.1 2008: D+6.2
Not yet ingested
- Civics
- —
Market trends
- HPI YoY
- ▼ -188.64%
- Current HPI
- 248.1785
- Rent YoY
- —
- Metro
- Dayton-Kettering, OH
- State GDP YoY
- ▲ 1.98%
- F500 in state
- 48
Industry mix (Fortune 500 HQ in OH)
| Industry | F500 HQs | Revenue |
|---|---|---|
| Insurance | 3 | $145B |
|
||
| Industrial Machinery | 3 | $49B |
|
||
| Financial Services | 3 | $24B |
|
||
| Consumer Goods | 2 | $93B |
|
||
| Aerospace / Defense | 2 | $47B |
|
||
| Utilities | 2 | $33B |
|
||
Price history
+58.4% since first listed9 events — show timeline
- 2025-11-03 Pending — Dayton MLS
- 2025-10-14 Listed $129,900 Dayton MLS
- 2024-03-12 Listing Removed — Dayton MLS
- 2024-03-12 Pending — Dayton MLS
- 2024-02-02 Contingent — Dayton MLS
- 2024-01-30 Listed $114,900 Dayton MLS
- 1993-07-21 Sold (Public Records) $82,000 Public Records
- 1993-07-21 Sold (Public Records) $82,000 Public Records
- 1993-07-12 Sold (Public Records) $82,000 Public Records
Property tax history
+7.8%/yrLatest (2025): $3,543 · +0.1% YoY. Source: county tax records.
Cash-flow waterfall
monthlySold comps — $/sqft
last 12 mo · ≤1 miLoading sold comps…