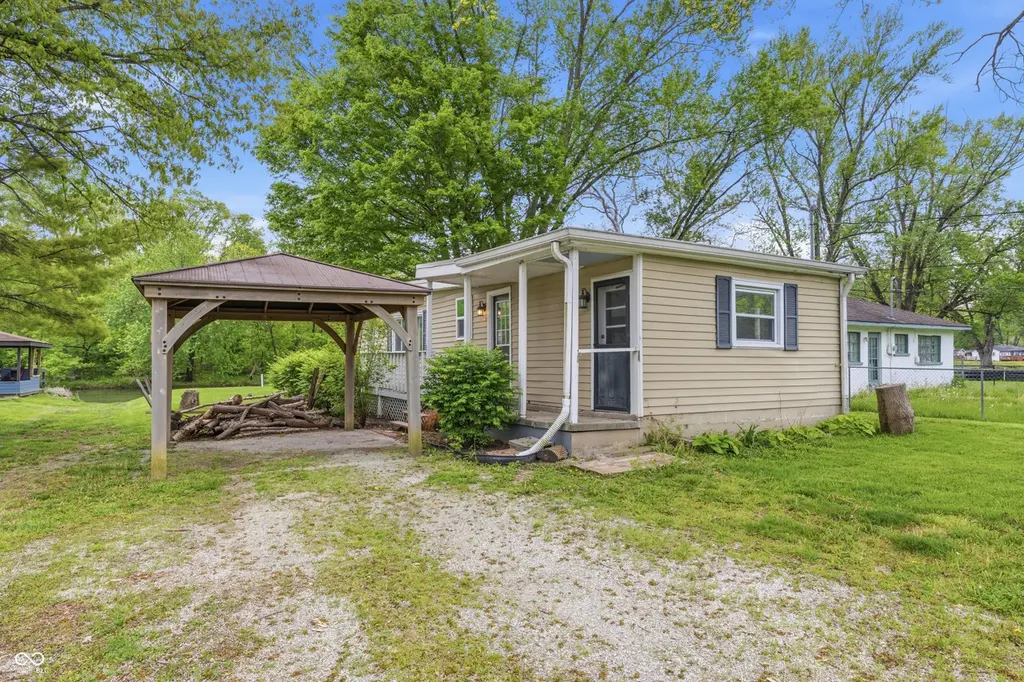
15581 Meith St · Fishers, IN
Flood risk 9/10 · Severe
- FEMA flood zone
- AE
- Chance of flooding over 30 yrs
- 0.99%
- Est. flood insurance / yr
- $1,737 – $8,500
Fire risk 2/10 · Minimal
- Est. fire insurance / yr
- $717 – $1,331
Heat risk 3/10 · Minor
- Hot days now (above 101°F)
- 7 days/yr
- Hot days in 30 yrs
- 17 days/yr
Wind risk 2/10 · Minimal
- Chance of severe wind over 30 yrs
- 0.0%
Air-quality risk 2/10 · Minimal
- Unhealthy air days now
- 1 days/yr
- Unhealthy air days in 30 yrs
- 2 days/yr
Risk factors via First Street. Map © Google.
Why this score? — see what drove the C grade
The composite is a weighted blend of 9 inputs, each scored 0–100. Each bar is that input's sub-score; the figure is the points it added to the 100-point composite (weight × sub-score).
- Cash flow +17.4/30.0
- ARV discount +15.0/15.0
- DSCR +5.4/10.0
- Schools +5.3/10.0
- 1% rule +4.2/10.0
- Livability +4.2/5.0
- Rent growth +2.5/5.0
- Condition / age +2.5/5.0
- Appreciation +0.0/10.0
$210,000
🖨 Deal sheet (PDF) 📄 Offer letter ✓ Due diligence
Listing remarks MLS
Charming waterfront home with 3 bedrooms and 1 bath. Recently renovated kitchen, updated bathroom, new tile floor throughout. Enjoy sitting outside on the porch, hanging out by the fire pit, or kayaking in the water. Hamilton Southeastern Schools. Make yourself right at home because you wont want to leave.
Key facts
- Wide back deck
- Private dock
- Chef's kitchen
Tags
Property features AI
Exterior
- Parking: Carport
- Utilities: Private water; Septic system; 200+ amp electric service
- Home design: Single-family residence; One story
- Construction: Vinyl siding; Block foundation
- Exterior features: Patio; Storage shed; Waterfront lot with a view
Interior
- Kitchen: Dishwasher; Range/oven (electric); Microwave with hood; Refrigerator
- Bedrooms: Three bedrooms on the main level (sizes include 14x10, 10x9, 10x9)
- Bathrooms: One full bathroom on the main level
- Heating & cooling: Forced air heating; Central air conditioning
- Interior features: Walk-in closet(s); Masonry fireplace in the living room
- Laundry & utility: Water heater
Neighborhood map
What this means for you Summary
Snapshot
- This is a 3-bed/1.0-bath single-family listed at $210k.
Deal economics
- At list price, monthly cash flow is $-269 ($-3k/yr) — negative.
- To cash-flow at today's rent, offer at most $162k (22.6% below list).
- To meet the 1% rule (rent ≥ 1% of price), the offer needs to be $193k (8.0% below list).
- Recommended offer: $162k (22.6% below list) — sets the bar for cash-flow.
- Cap rate 7.2% vs local median 3.6% in Fishers — top-decile yield for the area; either an underpriced asset or a hidden risk that comps aren't pricing in. Stress-test before assuming the spread holds.
Location & tenants
- Location reads 83/100 on livability (#11 in IN, #898 nationally) — a professional / high-income tenant draw. Strengths: crime A+, amenities A+, employment A+; Watch: commute F.
- Hamilton Southeastern Schools (suburban): math 57% / reading 59% proficiency, ranked #14 of 301 in IN (top 5%) — acceptable for families but not a draw, mixed tenant base, ~2y average lease; only 10% free/reduced lunch — higher-income household profile.
- Zoned schools: Geist Elementary School (math 78% / reading 69%, grade A, #23 of 994 statewide, top 3%, 707 students, 13% FRL); Hamilton Se Int And Jr High Sch (math 50% / reading 60%, grade B-, #26 of 330 statewide, top 8%, 1,269 students, 13% FRL); Hamilton Southeastern Hs (math 66% / reading 85%, grade A-, #7 of 369 statewide, top 2%, 3,450 students, 15% FRL) — zoned schools at 14% FRL track the district average.
- Market conditions: 307 active listings in the ZIP; 4,661 units permitted in Hamilton County in 2024 (1,528 in 5+ unit buildings).
Forward outlook
- Local home prices are declining (-3.0%/yr); year-one equity from $1k of loan paydown is wiped out by about $6k of value loss. Plan a longer hold.
- Hamilton County population projected at +44% by 2050 — long-run rental-demand tailwind backs the buy-and-hold thesis.
Negotiation context
- It's been on market 21 days — a 2% lower offer ($207k) is reasonable based on typical stale-listing flexibility.
- 15 sale attempts since 23y ago; this cycle's ask has dropped $19k (8%) from the opening price — seller is motivated, your offer sets the floor, not the list.
- Current owner paid $137k; list at $210k implies a 53% gain — meaningful room to come down on a strong offer.
Risks & watch-outs
- Watch-outs: flood insurance adds $427/mo; built in 1952 — expect roof / HVAC / electrical / plumbing capex.
- Climate carrying-cost: in FEMA flood zone AE (mandatory federal flood insurance) — expect insurance premiums to compound above CPI over the hold.
Questions for the listing agent
- What do current leases actually rent for vs. the listed asking? Can we see a recent rent roll and the last 12 months of T-12 income?
- Built in 1952 — when were the roof, HVAC, electrical panel, plumbing, and water heater last replaced?
- What's the actual annual flood-insurance premium (NFIP or private), and is the property in a SFHA with mandatory coverage?
- Is there a deadline driving the sale (1031 exchange, divorce, estate, relocation)? That informs how much negotiation room exists.
- Schools are A-rated — typically a magnet for longer-tenancy family renters. What's the average tenant stay here, and is there a school-zone premium baked into asking?
- What's the average days-on-market for RENTAL listings here right now (not sales)? A rising rental-DOM trend means longer vacancies and softer asking-rent achievability than the comps imply.
- What's the recent tenant-quality profile in this submarket — average credit score on applications, eviction rate, late-payment / NSF rate, and stable-employment percentage? A property-management company in the area should have these aggregated.
- How much new for-sale + rental construction is in the pipeline within 1–3 miles? Heavy new supply typically softens prices + rents 12–24 months out; constrained supply supports both.
Investment metrics
- 1% rule
- 0.92% ✗
- Cap rate
- 7.19%
- Cash-on-cash
- 3.21%
- DSCR
- 1.14
- GRM
- 9.1
CMA / ARV
- ARV (median comp)
- $315,381
- List price
- $210,000
- Delta
- -33.41%
- Verdict
- UNDERPRICED
- Comps
- 20 within 2.0 mi
Projected returns pro-forma
-3.0% appreciation · 3.0% rent growth · sell at horizon
- IRR
- -25.5%
- Equity multiple
- 0.13×
- Total profit
- $-50,933
- Equity at exit
- $31,312
- IRR
- -21.4%
- Equity multiple
- -0.11×
- Total profit
- $-65,449
- Equity at exit
- $18,157
Cash invested: $58,800 (down + closing). Projections, not guarantees.
Landlord ↔ Tenant lean methodology
- Overall (STATE)
- 90 Strongly Landlord-Friendly
- State Indiana
- 90 Strongly Landlord-Friendly · R+11
- County
- — inherits STATE
- City
- — inherits STATE
ZIP-level market 46040
- Home prices YoY
- -24.4%
- Active inventory
- 307
- Price-to-rent
- 9.1×
Monthly cashflow live
- Estimated rent
- $1,933 medium interval (Pro) →
- Mortgage (P&I)
- −$1,101
- Tax from tax record
- −$181 /mo · $2,171/yr
- Insurance
- −$88
- Flood insurance flood zone
- −$427 /mo · $5,118/yr
- HOA
- −$0
- Vacancy / Maint / Mgmt
- −$406
- Net cashflow
- $-269
Break-even live
Sensitivity live
| Price | -10% $-150 | -5% $-210 | +0% $-269 | +5% $-329 | +10% $-388 |
|---|---|---|---|---|---|
| Rent | -10% $-422 | -5% $-346 | +0% $-269 | +5% $-193 | +10% $-116 |
| Rate | -1.0pp $-163 | -0.5pp $-216 | base $-269 | +0.5pp $-324 | +1.0pp $-379 |
UW: 25.0% down · 7.5% · 30yr · 1.5% tax · 5.0% vac · 8.0% maint · 8.0% mgmt
Financing live
Cash to close
- Down payment
- $52,500
- Closing costs
- $6,300
- Reserves months
- —
- Total cash needed
- —
Loan-product check · same deal, 3 products live
Conventional
25% down · 7.5% · 30yr
- Down + closing
- —
- Monthly P&I
- —
- Monthly cashflow
- —
- DSCR
- —
- Eligible?
- —
Personal DTI + credit; lowest rate.
DSCR
20% down · 8.5% · 30yr
- Down + closing
- —
- Monthly P&I
- —
- Monthly cashflow
- —
- DSCR
- —
- Eligible?
- —
No personal income docs; deal must DSCR.
Hard money
10% down · 12.0% · 12mo
- Down + closing
- —
- Monthly P&I
- —
- Monthly cashflow
- —
- DSCR
- —
- Eligible?
- —
Short-term bridge; refi at stabilization.
Listing history 41 events
-
2026-06-13pricedays on market $210,000 Pending 21 DOM
-
2026-06-03statusdays on market $219,000 Pending 19 DOM
-
2026-06-02days on market $219,000 Active 18 DOM
-
2026-06-01days on market $219,000 Active 17 DOM
-
2026-05-31days on market $219,000 Active 16 DOM
-
2026-05-15historical
-
2026-05-15$229,000 Active 1901-char remark
-
2026-05-07price $239,000
-
2026-04-30$250,000 Active
-
2019-12-30soldstatus $137,000 Sold
Show marketing remark (309 chars)
Charming waterfront home with 3 bedrooms and 1 bath. Recently renovated kitchen, updated bathroom, new tile floor throughout. Enjoy sitting outside on the porch, hanging out by the fire pit, or kayaking in the water. Hamilton Southeastern Schools. Make yourself right at home because you wont want to leave.
-
2019-11-25status Pending
Show marketing remark (309 chars)
Charming waterfront home with 3 bedrooms and 1 bath. Recently renovated kitchen, updated bathroom, new tile floor throughout. Enjoy sitting outside on the porch, hanging out by the fire pit, or kayaking in the water. Hamilton Southeastern Schools. Make yourself right at home because you wont want to leave.
-
2019-11-22price $139,999
Show marketing remark (309 chars)
Charming waterfront home with 3 bedrooms and 1 bath. Recently renovated kitchen, updated bathroom, new tile floor throughout. Enjoy sitting outside on the porch, hanging out by the fire pit, or kayaking in the water. Hamilton Southeastern Schools. Make yourself right at home because you wont want to leave.
-
2019-11-21price $140,000
Show marketing remark (309 chars)
Charming waterfront home with 3 bedrooms and 1 bath. Recently renovated kitchen, updated bathroom, new tile floor throughout. Enjoy sitting outside on the porch, hanging out by the fire pit, or kayaking in the water. Hamilton Southeastern Schools. Make yourself right at home because you wont want to leave.
-
2019-11-09price $144,900
Show marketing remark (309 chars)
Charming waterfront home with 3 bedrooms and 1 bath. Recently renovated kitchen, updated bathroom, new tile floor throughout. Enjoy sitting outside on the porch, hanging out by the fire pit, or kayaking in the water. Hamilton Southeastern Schools. Make yourself right at home because you wont want to leave.
-
2019-10-24price $149,000
Show marketing remark (309 chars)
Charming waterfront home with 3 bedrooms and 1 bath. Recently renovated kitchen, updated bathroom, new tile floor throughout. Enjoy sitting outside on the porch, hanging out by the fire pit, or kayaking in the water. Hamilton Southeastern Schools. Make yourself right at home because you wont want to leave.
-
2019-10-24status Active
Show marketing remark (309 chars)
Charming waterfront home with 3 bedrooms and 1 bath. Recently renovated kitchen, updated bathroom, new tile floor throughout. Enjoy sitting outside on the porch, hanging out by the fire pit, or kayaking in the water. Hamilton Southeastern Schools. Make yourself right at home because you wont want to leave.
-
2019-08-15status Pending
Show marketing remark (309 chars)
Charming waterfront home with 3 bedrooms and 1 bath. Recently renovated kitchen, updated bathroom, new tile floor throughout. Enjoy sitting outside on the porch, hanging out by the fire pit, or kayaking in the water. Hamilton Southeastern Schools. Make yourself right at home because you wont want to leave.
-
2019-08-09$154,900 Active
Show marketing remark (309 chars)
Charming waterfront home with 3 bedrooms and 1 bath. Recently renovated kitchen, updated bathroom, new tile floor throughout. Enjoy sitting outside on the porch, hanging out by the fire pit, or kayaking in the water. Hamilton Southeastern Schools. Make yourself right at home because you wont want to leave.
-
2018-02-09soldstatus $119,900 Sold
-
2018-01-26status Pending
-
2018-01-20status Active
-
2017-12-08status Pending
-
2017-11-29$119,900 Active
-
2014-10-21historical
-
2014-06-23$79,900
-
2014-02-28historical
-
2013-08-27$119,000
-
2012-07-30historical
-
2012-07-27soldstatus $40,000
-
2012-06-25$40,000
-
2009-09-09historical
-
2009-09-08soldstatus $65,000
-
2009-05-26$70,000
-
2009-05-01historical
-
2008-05-21$84,900
-
2007-12-13historical
-
2007-06-13$95,900
-
2007-04-08historical
-
2006-10-09$98,900
-
2004-02-23soldstatus $62,000
-
2003-10-24$69,750
ⓘ Source: listings_history table (triggers on properties + properties_extension) + one-shot
backfill from property_details.listing_events for pre-trigger history.
Tax reassessment forecast IN · Partial reset (capped growth)
- Current annual tax
- $2,171 · $181/mo
- Projected year-2 tax
- $2,171 · $181/mo
- Expected delta
- $0/yr ($0/mo · 0.0%)
ⓘ Screening estimate from a state-policy table — verify with the county assessor before closing.
Climate risk First Street
- Flood 9/10 Extreme FEMA zone AE · 99% chance over 30 yrs
- Wildfire 2/10 Low
- Heat 3/10 Moderate 7 d/yr ≥101°F today · 17 d/yr by 30 yrs out
- Wind 2/10 Low 0% chance of damaging wind over 30 yrs
- Air quality 2/10 Low 1 unhealthy d/yr today · 2 by 30 yrs out
Nearby sold comps map
Loading sold comps map…
Walkable amenities ~0.75 mi
Loading nearby amenities…
Taxation est. · year 1
- Rental income
- $23,195
- − Mortgage interest
- −$11,763
- − Property taxes
- −$2,171
- − Insurance
- −$6,169
- − Repairs & maintenance
- −$1,856
- − Management
- −$1,856
- − Depreciation
- −$6,109
- Taxable loss
- −$6,728
- Est. tax savings @ 24.0%
- +$1,615
- After-tax cash flow
- $-1,616/yr
For passive investors: Depreciation is non-cash, so a rental often shows a tax loss while cash-flowing — sheltering income. Rental losses are passive: they offset passive income freely, and up to $25,000/yr can offset ordinary (W-2) income if you actively participate and your MAGI is under $100k (phasing out to $0 by $150k); unused losses carry forward. On sale, claimed depreciation is recaptured at up to 25%, and gains may owe capital-gains tax (a 1031 exchange can defer both). Figures are a year-1 estimate at your 24.0% rate — not tax advice; consult a CPA.
Schools (NCES district)
- District
- Hamilton Southeastern Schools
- NCES district ID
- 1810650
- Math proficiency
- 57% ▼ -11.00%
- Reading proficiency
- 59% ▼ -7.00%
- Median HH income
- $87,726
- Composite
- 53.02/100
- National rank
- #1520
- State rank
- #14 of 301 in IN
Livability — Fishers
- Score
- 83/100
- State rank
- #11
- US rank
- #898
Category grades
Schools grade is shown separately in the Schools card above.
Census & demographics
- City population
- 92,467
- Population (ZIP)
- 17,891
Population outlook (Hamilton County) Hauer SSP2
- Today (2025)
- 381,938 people
- By 2030
- 417,496 · +9.3%
- By 2040
- 486,684 · +27.4%
- By 2050
- 549,805 · +44.0%
- By 2075
- 687,078 · +79.9%
- By 2100
- 754,495 · +97.5%
Race, ethnicity, and origin ACS 2023
- Neighborhood character
- Predominantly White (83%)
- Race & ethnicity
- White 83% Black 6% Two or more races 4% Asian 4% Hispanic / Latino 2%
- Common ancestry
- Lithuanian 5% Romanian 2% Portuguese 2%
- Foreign-born
- 5% · Canada
- Languages at home
- 94% English-only · Other Indo-European 3% Arabic 1% Spanish 1%
Political lean MEDSL · Hamilton
- 2024 margin
- Lean R (+6.1) · D 46.0% · R 52.1% · Other 1.9%
- 2008→2024 swing
- +16.2pp toward D · 2008: -22.2pp · 2024: -6.1pp
- All cycles
- 2024: R+6.1 2020: R+6.8 2016: R+19.6 2012: R+34.3 2008: R+22.2
Not yet ingested
- Civics
- —
Market trends
- HPI YoY
- ▼ -71.54%
- Current HPI
- 221.8703
- Rent YoY
- —
- Metro
- —
- State GDP YoY
- ▲ 2.90%
- F500 in state
- 18
Industry mix (Fortune 500 HQ in IN)
| Industry | F500 HQs | Revenue |
|---|---|---|
| Industrial Machinery | 2 | $37B |
|
||
| Healthcare | 1 | $177B |
|
||
| Pharmaceuticals | 1 | $45B |
|
||
| Metals / Steel | 1 | $18B |
|
||
| Agriculture | 1 | $17B |
|
||
| Packaging | 1 | $12B |
|
||
Price history
+201.1% since first listed41 events — show timeline
- 2026-06-12 Pending — MIBOR as Distributed by MLS Grid
- 2026-06-10 Price Changed $210,000 MIBOR as Distributed by MLS Grid
- 2026-06-10 Relisted — MIBOR as Distributed by MLS Grid
- 2026-06-03 Pending — MIBOR as Distributed by MLS Grid
- 2026-05-28 Price Changed $219,000 MIBOR as Distributed by MLS Grid
- 2026-05-15 Listing Removed — MIBOR as Distributed by MLS Grid
- 2026-05-15 Listed $229,000 MIBOR as Distributed by MLS Grid
- 2026-05-07 Price Changed $239,000 MIBOR as Distributed by MLS Grid
- 2026-04-30 Listed $250,000 MIBOR as Distributed by MLS Grid
- 2019-12-30 Sold (MLS) $137,000 MIBOR as Distributed by MLS Grid
- 2019-11-25 Pending — MIBOR as Distributed by MLS Grid
- 2019-11-22 Price Changed $139,999 MIBOR as Distributed by MLS Grid
- 2019-11-21 Price Changed $140,000 MIBOR as Distributed by MLS Grid
- 2019-11-09 Price Changed $144,900 MIBOR as Distributed by MLS Grid
- 2019-10-24 Price Changed $149,000 MIBOR as Distributed by MLS Grid
- 2019-10-24 Relisted — MIBOR as Distributed by MLS Grid
- 2019-08-15 Pending — MIBOR as Distributed by MLS Grid
- 2019-08-09 Listed $154,900 MIBOR as Distributed by MLS Grid
- 2018-02-09 Sold (MLS) $119,900 MIBOR as Distributed by MLS Grid
- 2018-01-26 Pending — MIBOR as Distributed by MLS Grid
- 2018-01-20 Relisted — MIBOR as Distributed by MLS Grid
- 2017-12-08 Pending — MIBOR as Distributed by MLS Grid
- 2017-11-29 Listed $119,900 MIBOR as Distributed by MLS Grid
- 2014-10-21 Listing Removed — MIBOR as Distributed by MLS Grid
- 2014-06-23 Listed $79,900 MIBOR as Distributed by MLS Grid
- 2014-02-28 Listing Removed — MIBOR as Distributed by MLS Grid
- 2013-08-27 Listed $119,000 MIBOR as Distributed by MLS Grid
- 2012-07-30 Listing Removed — MIBOR as Distributed by MLS Grid
- 2012-07-27 Sold (MLS) $40,000 MIBOR as Distributed by MLS Grid
- 2012-06-25 Listed $40,000 MIBOR as Distributed by MLS Grid
- 2009-09-09 Listing Removed — MIBOR as Distributed by MLS Grid
- 2009-09-08 Sold (MLS) $65,000 MIBOR as Distributed by MLS Grid
- 2009-05-26 Listed $70,000 MIBOR as Distributed by MLS Grid
- 2009-05-01 Listing Removed — MIBOR as Distributed by MLS Grid
- 2008-05-21 Listed $84,900 MIBOR as Distributed by MLS Grid
- 2007-12-13 Listing Removed — MIBOR as Distributed by MLS Grid
- 2007-06-13 Listed $95,900 MIBOR as Distributed by MLS Grid
- 2007-04-08 Listing Removed — MIBOR as Distributed by MLS Grid
- 2006-10-09 Listed $98,900 MIBOR as Distributed by MLS Grid
- 2004-02-23 Sold (MLS) $62,000 MIBOR as Distributed by MLS Grid
- 2003-10-24 Listed $69,750 MIBOR as Distributed by MLS Grid
Property tax history
+13.2%/yrLatest (2025): $2,171 · +22.2% YoY. Source: county tax records.
Cash-flow waterfall
monthlySold comps — $/sqft
last 12 mo · ≤1 miLoading sold comps…