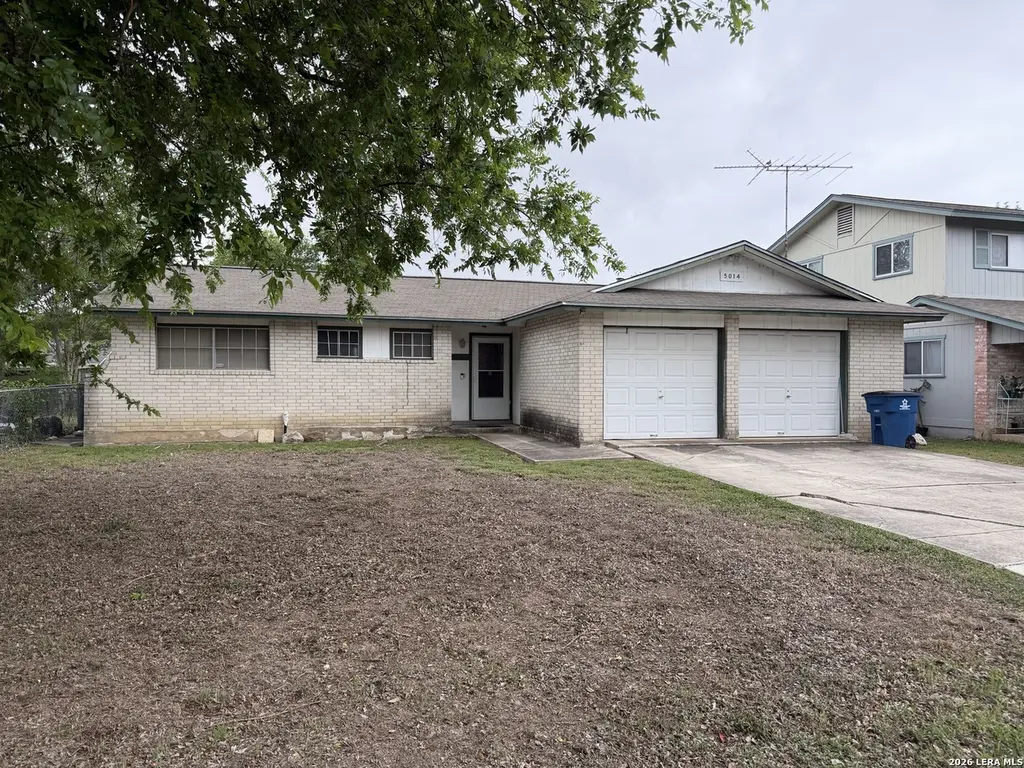
5014 Binz Engleman Rd · Kirby, TX
Flood risk 1/10 · Minimal
- FEMA flood zone
- X (unshaded)
- Chance of flooding over 30 yrs
- 0.0%
- Est. flood insurance / yr
- $507 – $1,088
Fire risk 1/10 · Minimal
- Est. fire insurance / yr
- $1,222 – $2,270
Heat risk 8/10 · Major
- Hot days now (above 108°F)
- 7 days/yr
- Hot days in 30 yrs
- 22 days/yr
Wind risk 8/10 · Major
- Chance of severe wind over 30 yrs
- 80.0%
Air-quality risk 2/10 · Minimal
- Unhealthy air days now
- 0 days/yr
- Unhealthy air days in 30 yrs
- 1 days/yr
Risk factors via First Street. Map © Google.
Why this score? — see what drove the C- grade
The composite is a weighted blend of 9 inputs, each scored 0–100. Each bar is that input's sub-score; the figure is the points it added to the 100-point composite (weight × sub-score).
- ARV discount +13.3/15.0
- Cash flow +11.3/30.0
- Appreciation +6.4/10.0
- 1% rule +4.4/10.0
- Rent growth +4.4/5.0
- DSCR +3.3/10.0
- Livability +3.2/5.0
- Condition / age +2.5/5.0
- Schools +2.4/10.0
$170,000
🖨 Deal sheet 📄 Offer letter ✓ Due diligence
Listing remarks MLS
INVESTMENT OPPORTUNITY!!! 3 BEDROOM 2 BATH IN SAN ANTONIO/KIRBY AREA*ONE STORY*GAS COOKING*CENTRAL HVAC*2 CAR GARAGE*EASY ACCESS TO FT. SAM, RANDOLPH AFB & DOWNTOWN***INVESTORS ONLY AT THIS TIME***TENANT HAS A LEASE THROUGH 2/28/27
Key facts
- Central hvac
- Gas cooking
- 7,405 sq ft lot
Tags
Neighborhood map
What this means for you Summary
Snapshot
- This is a 3-bed/2.0-bath single-family listed at $170k.
Deal economics
- At list price, monthly cash flow is $-63 ($-752/yr) — negative.
- To cash-flow at today's rent, offer at most $159k (6.5% below list).
- To meet the 1% rule (rent ≥ 1% of price), the offer needs to be $159k (6.5% below list).
- Recommended offer: $159k (6.5% below list) — sets the bar for cash-flow.
Location & tenants
- Location reads 64/100 on livability (#761 in TX) — a middle-class / working-renter tenant base. Strengths: cost of living A+, housing A+, health & safety B; Watch: schools F, crime F, amenities F.
- Judson ISD (suburban): math 21% / reading 33% proficiency, ranked #660 of 826 in TX (top 80%) — low school quality limits family demand, transient renter base, plan for 1-2y turnover.
- Market conditions: Rents rising fast (+7.7%/yr); 66 active listings in the ZIP; 24 comparable units currently listed for rent nearby; rentals at typical pace (median 24d on market — plan ~3-4 weeks tenant-placement turnaround); 8,308 units permitted in Bexar County in 2024 (2,506 in 5+ unit buildings).
- This rent runs 37% of the median local income ($52k/yr) — at the standard rent-burdened threshold; future hikes will face affordability resistance.
Forward outlook
- In year one you build about $6k of equity ($1k loan paydown + $5k appreciation (2.7% local appreciation)).
- Bexar County population projected at +50% by 2050 — long-run rental-demand tailwind backs the buy-and-hold thesis.
- At projected returns (2.7% appreciation + 7.7% rent growth), your $48k cash investment doubles in ~6 years — after that, you're playing with house money.
- By year 6, paydown + projected appreciation supports a ~$31k cash-out refi (75% LTV) — recoverable capital for the next deal without selling this one.
Negotiation context
- It's been on market 63 days — a 6% lower offer ($160k) is reasonable based on typical stale-listing flexibility.
Risks & watch-outs
- Watch-outs: property tax is 2.5% of price.
- Climate carrying-cost: severe wind risk, 80% chance of damaging wind over 30y; extreme-heat days projected 7→22/yr by 2055 (HVAC capex compounding) — expect insurance premiums to compound above CPI over the hold.
Questions for the listing agent
- What do current leases actually rent for vs. the listed asking? Can we see a recent rent roll and the last 12 months of T-12 income?
- It's been on market 63 days. Have you received any prior offers? Is the seller open to a 7% concession, seller financing, or rate buy-down credit?
- Built in 1973 — when were the roof, HVAC, electrical panel, plumbing, and water heater last replaced?
- Property tax is high relative to price — has the assessment been appealed recently, and will the sale trigger a re-assessment?
- Why hasn't it sold? Are there any deal-killer items the seller is aware of (foundation, flood, title, zoning, code violations)?
- Is there a deadline driving the sale (1031 exchange, divorce, estate, relocation)? That informs how much negotiation room exists.
- Schools are F-rated, which usually means shorter tenancies and higher turnover. Who's the typical renter profile here, and what's been the actual vacancy rate?
- Crime grade is F in this area — have there been break-ins, vandalism, or insurance claims at this property in the last 3 years? What carrier currently insures it and at what premium?
- What's the average days-on-market for RENTAL listings here right now (not sales)? A rising rental-DOM trend means longer vacancies and softer asking-rent achievability than the comps imply.
- What's the recent tenant-quality profile in this submarket — average credit score on applications, eviction rate, late-payment / NSF rate, and stable-employment percentage? A property-management company in the area should have these aggregated.
- How much new for-sale + rental construction is in the pipeline within 1–3 miles? Heavy new supply typically softens prices + rents 12–24 months out; constrained supply supports both.
Investment metrics
- 1% rule
- 0.94% ✗
- Cap rate
- 5.85%
- Cash-on-cash
- -1.58%
- DSCR
- 0.93
- GRM
- 8.9
CMA / ARV
- ARV (median comp)
- $194,983
- List price
- $170,000
- Delta
- -12.81%
- Verdict
- UNDERPRICED
- Comps
- 20 within 1.0 mi
Show comp detail 12 sales within ~0.75 mi
| Address | Dist | Beds/Ba | Sqft | Sold | Price | $/sf | Match |
|---|---|---|---|---|---|---|---|
| 4814 Scott Carpenter Dr | 0.22mi | 3/2.0 | 1,110 (+1%) | 9mo | $189,900 | $171 | 81 |
| 4866 Aspen Wood | 0.23mi | 3/1.0 | 1,052 (-4%) | 6mo | $169,900 | $162 | 72 |
| 5027 Cinderella | 0.27mi | 3/2.0 | 1,214 (+10%) | 5mo | $215,000 | $177 | 66 |
| 3719 Autumn | 0.56mi | 3/2.0 | 1,050 (-5%) | 6mo | $203,000 | $193 | 61 |
| 5014 Cinderella | 0.23mi | 3/1.5 | 958 (-13%) | 8mo | $135,000 | $141 | 59 |
| 5138 Gordon Cooper | 0.31mi | 3/2.0 | 1,221 (+11%) | 11mo | $199,000 | $163 | 58 |
| 5405 Sir Robert | 0.74mi | 3/2.0 | 1,043 (-5%) | 0mo | $168,500 | $162 | 57 |
| 5239 Coral Mist | 0.45mi | 3/2.0 | 1,008 (-8%) | 13mo | $130,000 | $129 | 54 |
| 5218 Swann | 0.47mi | 3/1.5 | 1,188 (+8%) | 11mo | $179,700 | $151 | 54 |
| 5405 Borchers | 0.62mi | 3/1.0 | 1,024 (-7%) | 3mo | $115,000 | $112 | 53 |
| 5210 Foxcross | 0.53mi | 3/2.0 | 963 (-12%) | 3mo | $175,000 | $182 | 52 |
| 3414 Vinecrest | 0.58mi | 3/2.0 | 1,025 (-7%) | 12mo | $198,000 | $193 | 51 |
Match score weights: distance 35% · size 25% · config 20% · recency 20%. Top-matched comps best support the ARV.
Projected returns pro-forma
2.73% appreciation · 7.72% rent growth · sell at horizon
- IRR
- 8.0%
- Equity multiple
- 1.46×
- Total profit
- $22,088
- Equity at exit
- $73,860
- IRR
- 13.4%
- Equity multiple
- 3.14×
- Total profit
- $101,972
- Equity at exit
- $111,862
Cash invested: $47,600 (down + closing). Projections, not guarantees.
Landlord ↔ Tenant lean methodology
- Overall (STATE)
- 87 Strongly Landlord-Friendly
- State Texas
- 87 Strongly Landlord-Friendly · R+5
- County
- — inherits STATE
- City
- — inherits STATE
ZIP-level market 78219
- Home prices YoY
- 0.8%
- Rents YoY
- 7.7%
- Active inventory
- 66
- Price-to-rent
- 8.9×
Monthly cashflow live
- Estimated rent
- $1,590 high interval (Pro) →
- Mortgage (P&I)
- −$891
- Tax from tax record
- −$357 /mo · $4,278/yr
- Insurance
- −$71
- HOA
- −$0
- Vacancy / Maint / Mgmt
- −$334
- Net cashflow
- $-63
Break-even live
UW: 25.0% down · 7.5% · 30yr · 1.5% tax · 5.0% vac · 8.0% maint · 8.0% mgmt
Financing live
Cash to close
- Down payment
- $42,500
- Closing costs
- $5,100
- Reserves months
- —
- Total cash needed
- —
Loan-product check · same deal, 3 products live
Conventional
25% down · 7.5% · 30yr
- Down + closing
- —
- Monthly P&I
- —
- Monthly cashflow
- —
- DSCR
- —
- Eligible?
- —
Personal DTI + credit; lowest rate.
DSCR
20% down · 8.5% · 30yr
- Down + closing
- —
- Monthly P&I
- —
- Monthly cashflow
- —
- DSCR
- —
- Eligible?
- —
No personal income docs; deal must DSCR.
Hard money
10% down · 12.0% · 12mo
- Down + closing
- —
- Monthly P&I
- —
- Monthly cashflow
- —
- DSCR
- —
- Eligible?
- —
Short-term bridge; refi at stabilization.
Rent comps 24 comps
| Address | Beds | Baths | Sqft | Rent | $/sqft | DOM | Units | Dist |
|---|---|---|---|---|---|---|---|---|
| 2707 Alan Shepard Dr San Antonio, TX | 3.0 | 2.0 | 1285 | $1,900 | $1.48 | 43d | 1 | 0.19mi |
| 3407 Alan Shepard Dr San Antonio, TX | 3.0 | 2.0 | 1174 | $1,700 | $1.45 | 24d | 1 | 0.23mi |
| 5039 Ed White St Unit 78219 San Antonio, TX | 3.0 | 2.0 | 1145 | $1,600 | $1.40 | 4d | 1 | 0.24mi |
| 5015 David Scott Dr San Antonio, TX | 3.0 | 2.0 | 1356 | $1,750 | $1.29 | 24d | 1 | 0.32mi |
| 2540 Corian Glen Dr San Antonio, TX | 3.0 | 2.0 | 1178 | $1,300 | $1.10 | 21d | 1 | 0.38mi |
| 4819 Lunar San Antonio, TX | 3.0 | 2.0 | 1148 | $1,289 | $1.12 | 4d | 1 | 0.48mi |
| 5003 Starfire St San Antonio, TX | 3.0 | 2.0 | 1277 | $1,650 | $1.29 | 4d | 1 | 0.50mi |
| 3707 Autumn Ln San Antonio, TX | 3.0 | 2.0 | 1340 | $1,500 | $1.12 | 43d | 1 | 0.57mi |
| 5405 Borchers Dr San Antonio, TX | 3.0 | 1.0 | 1024 | $1,295 | $1.26 | 2d | 1 | 0.63mi |
| 5212 Vinecrest Cir San Antonio, TX | 3.0 | 2.5 | 1421 | $2,100 | $1.48 | 43d | 1 | 0.68mi |
| 2644 Ackerman Rd San Antonio, TX | 1.0–3.0 | 1.0–2.0 | 853 | $1,230 | $1.44 | 43d | 1 | 0.88mi |
| 4619 Dietrich Rd San Antonio, TX | 1.0–3.0 | 1.0–1.5 | 775 | $999 | $1.29 | 43d | 1 | 1.12mi |
| 4334 Hickory Hill Dr San Antonio, TX | 3.0 | 1.5 | 1129 | $1,550 | $1.37 | 11d | 1 | 1.17mi |
| 5719 Country Sun Dr San Antonio, TX | 3.0 | 2.0 | 1485 | $1,400 | $0.94 | 24d | 1 | 1.27mi |
| 4545 Hoeneke St San Antonio, TX | 2.0 | 2.0 | 995 | $999 | $1.00 | 4d | 2 | 1.31mi |
| 3669 Candlehead Ln San Antonio, TX | 3.0 | 2.5 | 1294 | $1,700 | $1.31 | 43d | 1 | 1.33mi |
| 4066 Sunrise Pass San Antonio, TX | 3.0 | 2.0 | 977 | $1,550 | $1.59 | 4d | 1 | 1.35mi |
| 4082 Sunrise Pass San Antonio, TX | 3.0 | 1.0 | 1125 | $1,355 | $1.20 | 4d | 1 | 1.36mi |
| 4102 Dakota Sun San Antonio, TX | 3.0 | 1.0 | 1202 | $1,350 | $1.12 | 43d | 1 | 1.41mi |
| 4074 Gallery Sun Dr San Antonio, TX | 2.0 | 1.0 | 969 | $1,295 | $1.34 | 43d | 1 | 1.41mi |
| 4123 Frontier Sun San Antonio, TX | 3.0 | 2.0 | 1086 | $1,350 | $1.24 | 43d | 1 | 1.46mi |
| 4078 Enchanted Sun San Antonio, TX | 3.0 | 1.0 | 1056 | $1,250 | $1.18 | 24d | 1 | 1.47mi |
| 5840 Glacier Sun Dr San Antonio, TX | 3.0 | 2.0 | 1344 | $1,749 | $1.30 | 2d | 1 | 1.47mi |
| 4002 Fire Sun San Antonio, TX | 3.0 | 2.0 | 1004 | $1,800 | $1.79 | 24d | 1 | 1.49mi |
Listing history 15 events
-
2026-06-18days on market $170,000 Active 63 DOM
-
2026-06-17days on market $170,000 Active 62 DOM
-
2026-06-16days on market $170,000 Active 61 DOM
-
2026-06-15days on market $170,000 Active 60 DOM
-
2026-06-13days on market $170,000 Active 58 DOM
-
2026-06-09days on market $170,000 Active 54 DOM
-
2026-06-08days on market $170,000 Active 53 DOM
-
2026-06-07days on market $170,000 Active 52 DOM
-
2026-06-04days on market $170,000 Active 49 DOM
-
2026-06-03days on market $170,000 Active 48 DOM
-
2026-06-02days on market $170,000 Active 47 DOM
-
2026-06-01days on market $170,000 Active 46 DOM
-
2026-05-31days on market $170,000 Active 45 DOM
-
2026-04-16$170,000 New 236-char remark
Show marketing remark (236 chars)
INVESTMENT OPPORTUNITY!!! 3 BEDROOM 2 BATH IN SAN ANTONIO/KIRBY AREA*ONE STORY*GAS COOKING*CENTRAL HVAC*2 CAR GARAGE*EASY ACCESS TO FT. SAM, RANDOLPH AFB & DOWNTOWN***INVESTORS ONLY AT THIS TIME***TENANT HAS A LEASE THROUGH 2/28/27
-
1994-03-01soldstatus
ⓘ Source: listings_history table (triggers on properties + properties_extension) + one-shot
backfill from property_details.listing_events for pre-trigger history.
Tax reassessment forecast TX · Resets to sale price
- Current annual tax
- $4,278 · $357/mo
- Projected year-2 tax
- $4,278 · $357/mo
- Expected delta
- $0/yr ($0/mo · 0.0%)
ⓘ Screening estimate from a state-policy table — verify with the county assessor before closing.
Climate risk First Street
- Flood 1/10 Low FEMA zone X (unshaded) · 0% chance over 30 yrs
- Wildfire 1/10 Low
- Heat 8/10 Severe 7 d/yr ≥108°F today · 22 d/yr by 30 yrs out
- Wind 8/10 Severe 80% chance of damaging wind over 30 yrs
- Air quality 2/10 Low 0 unhealthy d/yr today · 1 by 30 yrs out
Nearby sold comps map
Loading sold comps map…
Walkable amenities ~0.75 mi
Loading nearby amenities…
Taxation est. · year 1
- Rental income
- $19,082
- − Mortgage interest
- −$9,523
- − Property taxes
- −$4,278
- − Insurance
- −$850
- − Repairs & maintenance
- −$1,527
- − Management
- −$1,527
- − Depreciation
- −$4,945
- Taxable loss
- −$3,568
- Est. tax savings @ 24.0%
- +$856
- After-tax cash flow
- $104/yr
For passive investors: Depreciation is non-cash, so a rental often shows a tax loss while cash-flowing — sheltering income. Rental losses are passive: they offset passive income freely, and up to $25,000/yr can offset ordinary (W-2) income if you actively participate and your MAGI is under $100k (phasing out to $0 by $150k); unused losses carry forward. On sale, claimed depreciation is recaptured at up to 25%, and gains may owe capital-gains tax (a 1031 exchange can defer both). Figures are a year-1 estimate at your 24.0% rate — not tax advice; consult a CPA.
Schools (NCES district)
- District
- Judson ISD
- NCES district ID
- 4824990
- Math proficiency
- 21% ▼ -21.00%
- Reading proficiency
- 33% ▼ -7.00%
- Median HH income
- $57,542
- Composite
- 24.39/100
- National rank
- #7689
- State rank
- #660 of 826 in TX
Livability — Kirby
- Score
- 64/100
- State rank
- #761
- US rank
- #13943
Category grades
Schools grade is shown separately in the Schools card above.
Census & demographics
- Census place
- Kirby, TX
- County
- Bexar County · 1,990,555 people
- Metro
- San Antonio-New Braunfels, TX
- Population (ZIP)
- 17,924
- Household income
- $52,094
- Rent vs Own
- Severe rent burden
- 852.0
Population outlook (Bexar County) Hauer SSP2
- Today (2025)
- 2,336,851 people
- By 2030
- 2,560,728 · +9.6%
- By 2040
- 3,020,569 · +29.3%
- By 2050
- 3,493,522 · +49.5%
- By 2075
- 4,668,459 · +99.8%
- By 2100
- 5,533,242 · +136.8%
Race, ethnicity, and origin ACS 2023
- Neighborhood character
- Diverse neighborhood (Simpson 0.63)
- Race & ethnicity
- Hispanic / Latino 53% Two or more races 27% Black 26% White 16% Asian 1%
- Hispanic origin (detail)
- Mexican 45%
- Common ancestry
- Lithuanian 1% Romanian 1% Slovak 1%
- Foreign-born
- 13% · Canada
- Languages at home
- 67% English-only · Spanish 31% Vietnamese 1%
Political lean MEDSL · Bexar
- 2024 margin
- Lean D (+9.8) · D 54.3% · R 44.6% · Other 1.1%
- 2008→2024 swing
- +4.2pp toward D · 2008: 5.6pp · 2024: 9.8pp
- All cycles
- 2024: D+9.8 2020: D+18.2 2016: D+13.5 2012: D+4.6 2008: D+5.6
Not yet ingested
- Civics
- —
Market trends
- HPI YoY
- ▲ 2.73%
- Current HPI
- 328.5107
- Rent YoY
- ▲ 7.72%
- Metro
- San Antonio-New Braunfels, TX
- State GDP YoY
- ▲ 3.95%
- F500 in state
- 110
Industry mix (Fortune 500 HQ in TX)
| Industry | F500 HQs | Revenue |
|---|---|---|
| Energy | 16 | $1,198B |
|
||
| Technology | 5 | $198B |
|
||
| Engineering / Construction | 4 | $72B |
|
||
| Energy Services | 3 | $60B |
|
||
| Utilities | 3 | $41B |
|
||
| Healthcare | 2 | $330B |
|
||
Price history
2 events — show timeline
- 2026-04-16 Listed $170,000 LERA
- 1994-03-01 Sold (Public Records) — Public Records
Property tax history
+11.4%/yrLatest (2025): $4,278 · +2.8% YoY. Source: county tax records.
Cash-flow waterfall
monthlySold comps — $/sqft
last 12 mo · ≤1 miLoading sold comps…