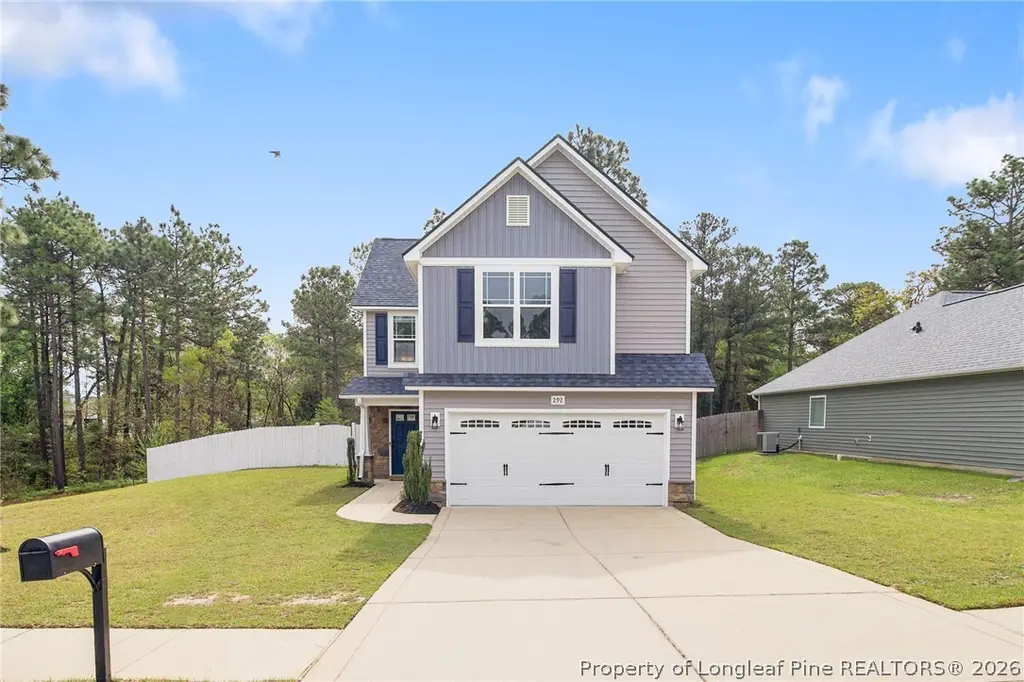
292 English Oak Dr · Anderson Creek, NC
Flood risk 1/10 · Minimal
- FEMA flood zone
- X (unshaded)
- Chance of flooding over 30 yrs
- 0.0%
- Est. flood insurance / yr
- $507 – $1,088
Fire risk 6/10 · Moderate
- Est. fire insurance / yr
- $906 – $1,684
Heat risk 7/10 · Major
- Hot days now (above 106°F)
- 7 days/yr
- Hot days in 30 yrs
- 16 days/yr
Wind risk 6/10 · Moderate
- Chance of severe wind over 30 yrs
- 73.0%
Air-quality risk 2/10 · Minimal
- Unhealthy air days now
- 0 days/yr
- Unhealthy air days in 30 yrs
- 1 days/yr
Risk factors via First Street. Map © Google.
Why this score? — see what drove the D- grade
The composite is a weighted blend of 9 inputs, each scored 0–100. Each bar is that input's sub-score; the figure is the points it added to the 100-point composite (weight × sub-score).
- Cash flow +9.7/30.0
- ARV discount +6.4/15.0
- Appreciation +5.4/10.0
- Schools +3.0/10.0
- DSCR +2.7/10.0
- Rent growth +2.5/5.0
- Livability +2.5/5.0
- Condition / age +2.5/5.0
- 1% rule +2.0/10.0
$260,000
🖨 Deal sheet 📄 Offer letter ✓ Due diligence
Listing remarks MLS
THE CL-1747 W/ COVERED PORCH FEATURES GREAT ROOM WITH FIREPLACE, KITCHEN, AND FORMAL DINING ROOM DOWNSTAIRS. ALL BEDROOMS INCLUDING MASTER BEDROOM WITH WALK IN CLOSET UPSTAIRS! LOFT UPSTAIRS! DOUBLE VANITY, SEPERATE TUB AND SHOWER IN MASTER BATH! REAR COVERED PORCH!
Key facts
- 2 garage spots
- Built 2013
- Listed 23 days
Property features AI
Finance
- Other: Zoning: RA-20 (Residential Agricultural); Subdivision: FOREST OAKS
- HOA & community: Homeowners association with an annual fee of $200
Exterior
- Parking: Attached 2-car garage; 2 covered parking spaces
- Utilities: Public water
- Home design: Single-family home; Two stories
- Construction: Vinyl siding
- Exterior features: Covered patio; Fenced yard
Interior
- Kitchen: Dishwasher; Microwave; Range; Eat-in kitchen
- Bedrooms: Bedrooms not specified
- Flooring: Tile; Vinyl; Carpet
- Bathrooms: 2 full bathrooms; 1 half bathroom
- Heating & cooling: Heat pump; Ceiling fan(s)
- Interior features: Ceiling fans; Double vanity; Entrance foyer; Eat-in kitchen; Laminate countertops; Walk-in closets; Gas fireplace (1)
- Laundry & utility: Washer hookup; Laundry on main level; In-unit laundry
Neighborhood map
What this means for you Summary
Snapshot
- This is a 3-bed/2.5-bath single-family listed at $260k.
Deal economics
- At list price, monthly cash flow is $-171 ($-2k/yr) — negative.
- To cash-flow at today's rent, offer at most $230k (11.6% below list).
- To meet the 1% rule (rent ≥ 1% of price), the offer needs to be $181k (30.2% below list).
- Recommended offer: $181k (30.2% below list) — sets the bar for 1% rule.
- Cap rate 5.5% vs local median 3.5% in Anderson Creek — top-decile yield for the area; either an underpriced asset or a hidden risk that comps aren't pricing in. Stress-test before assuming the spread holds.
Location & tenants
- Location reads: area grade D — affects rentability + tenant quality, not the cash-flow math above.
- Harnett County Schools (rural): math 31% / reading 39% proficiency, ranked #130 of 178 in NC (top 73%) — families likely to look elsewhere, expect single-tenant / working-renter base with shorter leases.
- Zoned schools: South Harnett Elementary (math 28% / reading 33%, grade F, #959 of 1,410 statewide, top 68%, 448 students, 63% FRL); Western Harnett Middle (math 34% / reading 43%, grade F, #244 of 475 statewide, top 53%, 820 students, 57% FRL); Overhills High (math 52% / reading 63%, grade C, #245 of 535 statewide, top 46%, 1,971 students, 47% FRL) — zoned schools at 56% FRL track the district average.
- Market conditions: 89 active listings in the ZIP; 8 comparable units currently listed for rent nearby; rentals at typical pace (median 24d on market — plan ~3-4 weeks tenant-placement turnaround); 2,080 units permitted in Harnett County in 2024 (12 in 5+ unit buildings).
Forward outlook
- In year one you build about $4k of equity ($2k loan paydown + $2k appreciation (0.9% local appreciation)).
- Harnett County population projected at +42% by 2050 — long-run rental-demand tailwind backs the buy-and-hold thesis.
- By year 8, paydown + projected appreciation supports a ~$33k cash-out refi (75% LTV) — recoverable capital for the next deal without selling this one.
Negotiation context
- It's been on market 23 days — a 2% lower offer ($256k) is reasonable based on typical stale-listing flexibility.
- 7 sale attempts since 13y ago with the ask held roughly flat each time — persistent listings suggest the price (not the market) is what's stuck; bring a comps-based counter.
- Current owner paid $173k; list at $260k implies a 50% gain — meaningful room to come down on a strong offer.
Risks & watch-outs
- Climate carrying-cost: major wind risk, 73% chance of damaging wind over 30y; major wildfire risk; extreme-heat days projected 7→16/yr by 2055 (HVAC capex compounding) — expect insurance premiums to compound above CPI over the hold.
Questions for the listing agent
- What do current leases actually rent for vs. the listed asking? Can we see a recent rent roll and the last 12 months of T-12 income?
- What does the HOA fee cover, when was the last increase, and are there any pending special assessments or reserve-fund shortfalls?
- Is there a deadline driving the sale (1031 exchange, divorce, estate, relocation)? That informs how much negotiation room exists.
- The area grade is low — what's the realistic commute time and amenity access for the typical tenant pool here? Any planned neighborhood developments (good or bad) we should know about?
- What's the average days-on-market for RENTAL listings here right now (not sales)? A rising rental-DOM trend means longer vacancies and softer asking-rent achievability than the comps imply.
- What's the recent tenant-quality profile in this submarket — average credit score on applications, eviction rate, late-payment / NSF rate, and stable-employment percentage? A property-management company in the area should have these aggregated.
- How much new for-sale + rental construction is in the pipeline within 1–3 miles? Heavy new supply typically softens prices + rents 12–24 months out; constrained supply supports both.
Investment metrics
- 1% rule
- 0.70% ✗
- Cap rate
- 5.50%
- Cash-on-cash
- -2.82%
- DSCR
- 0.87
- GRM
- 11.9
CMA / ARV
- ARV (on-the-fly)
- $253,964
- Comps found
- 9
Show comp detail 9 sales within ~0.75 mi
| Address | Dist | Beds/Ba | Sqft | Sold | Price | $/sf | Match |
|---|---|---|---|---|---|---|---|
| 148 Basket Oak Dr | 0.21mi | 3/2.0 | 1,560 (+6%) | 2mo | $270,000 | $173 | 76 |
| 276 English Oak Dr | 0.01mi | 3/2.0 | 1,658 (+13%) | 1mo | $279,000 | $168 | 75 |
| 428 Basket Oak Dr | 0.37mi | 3/2.5 | 1,468 (0%) | 11mo | $272,000 | $185 | 74 |
| 223 Angel Oak Dr | 0.16mi | 3/2.0 | 1,568 (+7%) | 10mo | $268,562 | $171 | 71 |
| 32 Burr Oak Cir | 0.15mi | 3/2.0 | 1,575 (+7%) | 14mo | $280,000 | $178 | 67 |
| 696 Valley Oak Dr | 0.35mi | 3/2.5 | 1,533 (+4%) | 13mo | $269,000 | $175 | 65 |
| 407 Basket Oak Dr | 0.34mi | 3/2.0 | 1,601 (+9%) | 4mo | $270,000 | $169 | 64 |
| 354 English Oak Dr | 0.07mi | 4/2.0 (+1) | 1,603 (+9%) | 14mo | $278,500 | $174 | 63 |
| 168 Basket Oak Dr | 0.22mi | 3/2.0 | 1,659 (+13%) | 9mo | $255,000 | $154 | 59 |
Match score weights: distance 35% · size 25% · config 20% · recency 20%. Top-matched comps best support the ARV.
Projected returns pro-forma
0.9% appreciation · 3.0% rent growth · sell at horizon
- IRR
- -2.0%
- Equity multiple
- 0.90×
- Total profit
- $-7,425
- Equity at exit
- $87,380
- IRR
- 3.0%
- Equity multiple
- 1.36×
- Total profit
- $26,363
- Equity at exit
- $115,061
Cash invested: $72,800 (down + closing). Projections, not guarantees.
Landlord ↔ Tenant lean methodology
- Overall (STATE)
- 85 Strongly Landlord-Friendly
- State North Carolina
- 85 Strongly Landlord-Friendly · R+3
- County
- — inherits STATE
- City
- — inherits STATE
ZIP-level market 28323
- Home prices YoY
- 0.4%
- Active inventory
- 89
- Price-to-rent
- 11.9×
Monthly cashflow live
- Estimated rent
- $1,814 high interval (Pro) →
- Mortgage (P&I)
- −$1,363
- Tax from tax record
- −$115 /mo · $1,382/yr
- Insurance
- −$108
- HOA
- −$17
- Vacancy / Maint / Mgmt
- −$381
- Net cashflow
- $-171
Break-even live
UW: 25.0% down · 7.5% · 30yr · 1.5% tax · 5.0% vac · 8.0% maint · 8.0% mgmt
Financing live
Cash to close
- Down payment
- $65,000
- Closing costs
- $7,800
- Reserves months
- —
- Total cash needed
- —
Loan-product check · same deal, 3 products live
Conventional
25% down · 7.5% · 30yr
- Down + closing
- —
- Monthly P&I
- —
- Monthly cashflow
- —
- DSCR
- —
- Eligible?
- —
Personal DTI + credit; lowest rate.
DSCR
20% down · 8.5% · 30yr
- Down + closing
- —
- Monthly P&I
- —
- Monthly cashflow
- —
- DSCR
- —
- Eligible?
- —
No personal income docs; deal must DSCR.
Hard money
10% down · 12.0% · 12mo
- Down + closing
- —
- Monthly P&I
- —
- Monthly cashflow
- —
- DSCR
- —
- Eligible?
- —
Short-term bridge; refi at stabilization.
Rent comps 8 comps
| Address | Beds | Baths | Sqft | Rent | $/sqft | DOM | Units | Dist |
|---|---|---|---|---|---|---|---|---|
| 31 Burr Oak Cir Bunnlevel, NC | 3.0 | 2.5 | 1740 | $1,869 | $1.07 | 14d | 1 | 0.13mi |
| 330 Gallery Dr Spring Lake, NC | 2.0–3.0 | 2.0 | 1476 | $1,600 | $1.08 | 23d | 2 | 1.28mi |
| 411 Gallery Dr #201 Spring Lake, NC | 2.0 | 2.0 | 1535 | $1,550 | $1.01 | 23d | 1 | 1.29mi |
| 321 Gallery Dr #202 Spring Lake, NC | 2.0 | 2.0 | 1400 | $1,575 | $1.12 | 23d | 1 | 1.30mi |
| 200 Gallery Dr Unit 101 Spring Lake, NC | 3.0 | 2.0 | 1598 | $2,000 | $1.25 | 23d | 1 | 1.32mi |
| 188 Gallery Dr Unit 201 Spring Lake, NC | 3.0 | 2.0 | 1598 | $1,900 | $1.19 | 21d | 1 | 1.38mi |
| 188 Gallery Dr Unit 304 Spring Lake, NC | 2.0 | 2.0 | 1625 | $1,800 | $1.11 | 21d | 1 | 1.38mi |
| 188 Gallery Dr Spring Lake, NC | 2.0 | 2.0 | 1625 | $1,800 | $1.11 | 23d | 1 | 1.38mi |
HOA detail
- Monthly dues
- $17 · $204/yr
Listing history 30 events
-
2026-06-18days on market $260,000 Active 23 DOM
-
2026-06-17days on market $260,000 Active 22 DOM
-
2026-06-16days on market $260,000 Active 21 DOM
-
2026-06-15days on market $260,000 Active 20 DOM
-
2026-06-14pricedays on market $260,000 Active 18 DOM
-
2026-06-10days on market $265,000 Active 15 DOM
-
2026-06-09days on market $265,000 Active 14 DOM
-
2026-06-08days on market $265,000 Active 13 DOM
-
2026-06-07days on market $265,000 Active 12 DOM
-
2026-06-05days on market $265,000 Active 9 DOM
-
2026-06-03days on market $265,000 Active 8 DOM
-
2026-06-02days on market $265,000 Active 7 DOM
-
2026-06-01pricedays on market $265,000 Active 6 DOM
-
2026-05-31days on market $267,000 Active 28 DOM
-
2026-05-30days on market $267,000 Active 27 DOM
-
2026-05-22price $267,000
-
2026-05-09status Active
-
2026-04-20status Pending
-
2026-04-15$269,000 Active
-
2026-04-10historical $269,000
-
2023-11-08historical $1,750
-
2023-09-16$1,750
-
2013-11-21soldstatus $172,900 266-char remark
Show marketing remark (266 chars)
THE CL-1747 W/ COVERED PORCH FEATURES GREAT ROOM WITH FIREPLACE, KITCHEN, AND FORMAL DINING ROOM DOWNSTAIRS. ALL BEDROOMS INCLUDING MASTER BEDROOM WITH WALK IN CLOSET UPSTAIRS! LOFT UPSTAIRS! DOUBLE VANITY, SEPERATE TUB AND SHOWER IN MASTER BATH! REAR COVERED PORCH!
-
2013-11-21soldstatus $172,900 263-char remark
Show marketing remark (266 chars)
THE CL-1747 W/ COVERED PORCH FEATURES GREAT ROOM WITH FIREPLACE, KITCHEN, AND FORMAL DINING ROOM DOWNSTAIRS. ALL BEDROOMS INCLUDING MASTER BEDROOM WITH WALK IN CLOSET UPSTAIRS! LOFT UPSTAIRS! DOUBLE VANITY, SEPERATE TUB AND SHOWER IN MASTER BATH! REAR COVERED PORCH!
-
2013-11-21soldstatus $172,900
Show marketing remark (266 chars)
THE CL-1747 W/ COVERED PORCH FEATURES GREAT ROOM WITH FIREPLACE, KITCHEN, AND FORMAL DINING ROOM DOWNSTAIRS. ALL BEDROOMS INCLUDING MASTER BEDROOM WITH WALK IN CLOSET UPSTAIRS! LOFT UPSTAIRS! DOUBLE VANITY, SEPERATE TUB AND SHOWER IN MASTER BATH! REAR COVERED PORCH!
-
2013-11-21soldstatus $172,900 266-char remark
Show marketing remark (266 chars)
THE CL-1747 W/ COVERED PORCH FEATURES GREAT ROOM WITH FIREPLACE, KITCHEN, AND FORMAL DINING ROOM DOWNSTAIRS. ALL BEDROOMS INCLUDING MASTER BEDROOM WITH WALK IN CLOSET UPSTAIRS! LOFT UPSTAIRS! DOUBLE VANITY, SEPERATE TUB AND SHOWER IN MASTER BATH! REAR COVERED PORCH!
-
2013-05-02$169,900 266-char remark
Show marketing remark (266 chars)
THE CL-1747 W/ COVERED PORCH FEATURES GREAT ROOM WITH FIREPLACE, KITCHEN, AND FORMAL DINING ROOM DOWNSTAIRS. ALL BEDROOMS INCLUDING MASTER BEDROOM WITH WALK IN CLOSET UPSTAIRS! LOFT UPSTAIRS! DOUBLE VANITY, SEPERATE TUB AND SHOWER IN MASTER BATH! REAR COVERED PORCH!
-
2013-05-02$172,900 263-char remark
Show marketing remark (266 chars)
THE CL-1747 W/ COVERED PORCH FEATURES GREAT ROOM WITH FIREPLACE, KITCHEN, AND FORMAL DINING ROOM DOWNSTAIRS. ALL BEDROOMS INCLUDING MASTER BEDROOM WITH WALK IN CLOSET UPSTAIRS! LOFT UPSTAIRS! DOUBLE VANITY, SEPERATE TUB AND SHOWER IN MASTER BATH! REAR COVERED PORCH!
-
2013-05-02$172,900
Show marketing remark (266 chars)
THE CL-1747 W/ COVERED PORCH FEATURES GREAT ROOM WITH FIREPLACE, KITCHEN, AND FORMAL DINING ROOM DOWNSTAIRS. ALL BEDROOMS INCLUDING MASTER BEDROOM WITH WALK IN CLOSET UPSTAIRS! LOFT UPSTAIRS! DOUBLE VANITY, SEPERATE TUB AND SHOWER IN MASTER BATH! REAR COVERED PORCH!
-
2013-05-02$169,900 266-char remark
Show marketing remark (266 chars)
THE CL-1747 W/ COVERED PORCH FEATURES GREAT ROOM WITH FIREPLACE, KITCHEN, AND FORMAL DINING ROOM DOWNSTAIRS. ALL BEDROOMS INCLUDING MASTER BEDROOM WITH WALK IN CLOSET UPSTAIRS! LOFT UPSTAIRS! DOUBLE VANITY, SEPERATE TUB AND SHOWER IN MASTER BATH! REAR COVERED PORCH!
ⓘ Source: listings_history table (triggers on properties + properties_extension) + one-shot
backfill from property_details.listing_events for pre-trigger history.
Tax reassessment forecast NC · Resets to sale price
- Current annual tax
- $1,382 · $115/mo
- Projected year-2 tax
- $2,132 · $178/mo
- Expected delta
- +$750/yr (+$63/mo · 54.3%)
ⓘ Screening estimate from a state-policy table — verify with the county assessor before closing.
Climate risk First Street
- Flood 1/10 Low FEMA zone X (unshaded) · 0% chance over 30 yrs
- Wildfire 6/10 Major
- Heat 7/10 Severe 7 d/yr ≥106°F today · 16 d/yr by 30 yrs out
- Wind 6/10 Major 73% chance of damaging wind over 30 yrs
- Air quality 2/10 Low 0 unhealthy d/yr today · 1 by 30 yrs out
Nearby sold comps map
Loading sold comps map…
Walkable amenities ~0.75 mi
Loading nearby amenities…
Taxation est. · year 1
- Rental income
- $21,764
- − Mortgage interest
- −$14,564
- − Property taxes
- −$1,382
- − Insurance
- −$1,300
- − Repairs & maintenance
- −$1,741
- − Management
- −$1,741
- − HOA
- −$204
- − Depreciation
- −$7,564
- Taxable loss
- −$6,731
- Est. tax savings @ 24.0%
- +$1,616
- After-tax cash flow
- $-438/yr
For passive investors: Depreciation is non-cash, so a rental often shows a tax loss while cash-flowing — sheltering income. Rental losses are passive: they offset passive income freely, and up to $25,000/yr can offset ordinary (W-2) income if you actively participate and your MAGI is under $100k (phasing out to $0 by $150k); unused losses carry forward. On sale, claimed depreciation is recaptured at up to 25%, and gains may owe capital-gains tax (a 1031 exchange can defer both). Figures are a year-1 estimate at your 24.0% rate — not tax advice; consult a CPA.
Schools (NCES district)
- District
- Harnett County Schools
- NCES district ID
- 3702010
- Math proficiency
- 31% ▼ -2.00%
- Reading proficiency
- 39% ▼ -1.00%
- Median HH income
- $45,400
- Composite
- 29.88/100
- National rank
- #6397
- State rank
- #130 of 178 in NC
Livability — Anderson Creek
No livability data for this city. (Only ~50 U.S. cities are tracked.)
Census & demographics
- Census place
- Anderson Creek, NC
- City population
- 24,158
- Population (ZIP)
- 4,864
Population outlook (Harnett County) Hauer SSP2
- Today (2025)
- 153,758 people
- By 2030
- 166,581 · +8.3%
- By 2040
- 192,741 · +25.4%
- By 2050
- 218,332 · +42.0%
- By 2075
- 275,422 · +79.1%
- By 2100
- 313,511 · +103.9%
Race, ethnicity, and origin ACS 2023
- Neighborhood character
- Diverse neighborhood (Simpson 0.64)
- Race & ethnicity
- White 53% Black 24% Hispanic / Latino 18% Two or more races 11% Native American 1%
- Hispanic origin (detail)
- Mexican 4% Cuban 2%
- Common ancestry
- Romanian 2% Serbian 2% Italian 1%
- Foreign-born
- 8% · Canada, South Korea
- Languages at home
- 90% English-only · Spanish 8% French/Haitian/Cajun 1% Other Indo-European 1%
Political lean MEDSL · Harnett
- 2024 margin
- Strong R (+25.1) · D 36.9% · R 62.0% · Other 1.1%
- 2008→2024 swing
- -8.4pp toward R · 2008: -16.7pp · 2024: -25.1pp
- All cycles
- 2024: R+25.1 2020: R+22.4 2016: R+24.1 2012: R+19.4 2008: R+16.7
Not yet ingested
- Civics
- —
Market trends
- HPI YoY
- ▲ 0.90%
- Current HPI
- 239.6836
- Rent YoY
- —
- Metro
- —
- State GDP YoY
- ▲ 3.28%
- F500 in state
- 26
Industry mix (Fortune 500 HQ in NC)
| Industry | F500 HQs | Revenue |
|---|---|---|
| Financial Services | 2 | $213B |
|
||
| Retail | 2 | $95B |
|
||
| Industrial Conglomerate | 1 | $38B |
|
||
| Metals / Steel | 1 | $35B |
|
||
| Utilities | 1 | $30B |
|
||
| Industrial Machinery | 1 | $19B |
|
||
Price history
+57.2% since first listed15 events — show timeline
- 2026-05-22 Price Changed $267,000 LPRMLS
- 2026-05-09 Relisted — LPRMLS
- 2026-04-20 Pending — LPRMLS
- 2026-04-15 Listed $269,000 LPRMLS
- 2026-04-10 Coming Soon $269,000 LPRMLS
- 2023-11-08 Rental Removed $1,750 RENTALBEAST
- 2023-09-16 Listed for Rent $1,750 RENTALBEAST
- 2013-11-21 Sold (MLS) $172,900 AMLSNC
- 2013-11-21 Sold (MLS) $172,900 TMLS
- 2013-11-21 Sold (MLS) $172,900 TMLS
- 2013-11-21 Sold (MLS) $172,900 TMLS
- 2013-05-02 Listed $169,900 AMLSNC
- 2013-05-02 Listed $172,900 TMLS
- 2013-05-02 Listed $172,900 TMLS
- 2013-05-02 Listed $169,900 TMLS
Property tax history
+0.7%/yrLatest (2025): $1,382 · +0.0% YoY. Source: county tax records.
Cash-flow waterfall
monthlySold comps — $/sqft
last 12 mo · ≤1 miLoading sold comps…