 Multi-family
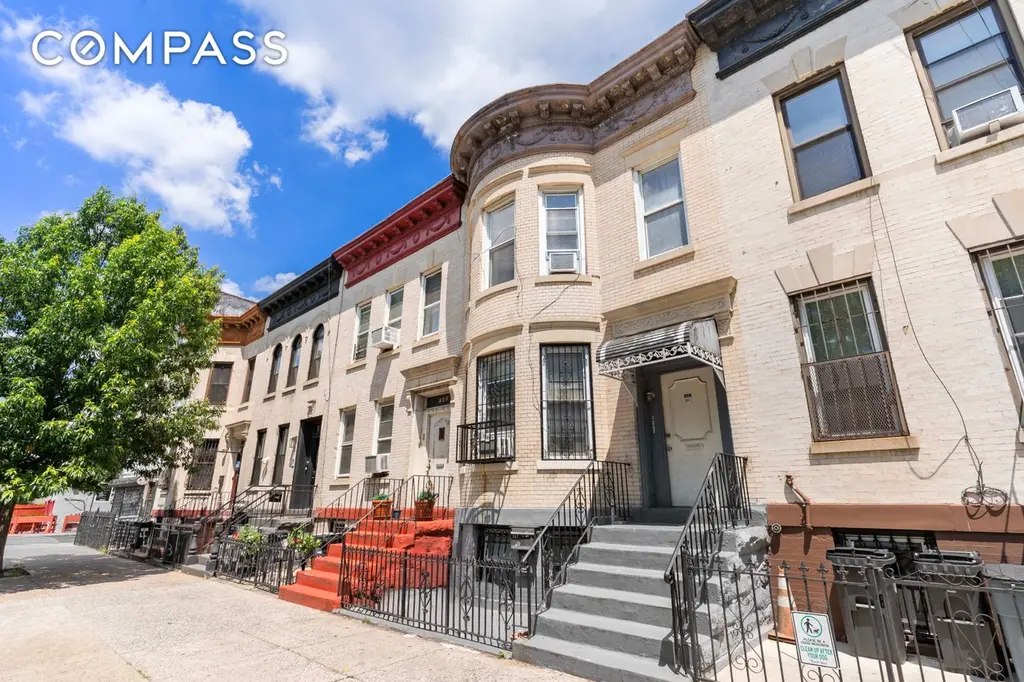
147 Schenectady Ave · New York, NY
Flood risk 1/10 · Minimal
- FEMA flood zone
- X (unshaded)
- Chance of flooding over 30 yrs
- 0.0%
- Est. flood insurance / yr
- $507 – $1,088
Fire risk 1/10 · Minimal
- Est. fire insurance / yr
- $691 – $1,283
Heat risk 6/10 · Moderate
- Hot days now (above 99°F)
- 7 days/yr
- Hot days in 30 yrs
- 14 days/yr
Wind risk 6/10 · Moderate
- Chance of severe wind over 30 yrs
- 64.0%
Air-quality risk 5/10 · Moderate
- Unhealthy air days now
- 6 days/yr
- Unhealthy air days in 30 yrs
- 8 days/yr
Risk factors via First Street. Map © Google.
Why this score? — see what drove the C grade
The composite is a weighted blend of 9 inputs, each scored 0–100. Each bar is that input's sub-score; the figure is the points it added to the 100-point composite (weight × sub-score).
- Cash flow +17.9/30.0
- Appreciation +10.0/10.0
- ARV discount +7.5/15.0
- DSCR +5.6/10.0
- Schools +5.0/10.0
- Rent growth +4.0/5.0
- Livability +3.8/5.0
- 1% rule +3.6/10.0
- Condition / age +2.5/5.0
$1,200,000
🖨 Deal sheet 📄 Offer letter ✓ Due diligence
Multi-family units
County records classify this as Multi-Family (2-4 Unit). Listing-text estimate: 1 unit. estimate disagrees with records
Listing remarks
Welcome to 147 Schenectady Ave, a stunning multi-family "Barrel front house townhouse offering an impressive 2964 square feet of versatile living space in vibrant Brooklyn. This magnificent home boasts five spacious bedrooms and three beautifully appointed ceramic bathrooms, providing ample space for comfortable living and entertaining. As you step inside, you'll be greeted by the charm of its decorative fireplaces, adding a touch of elegance and warmth to the living areas. With a total of seven rooms, this residence offers a flexible floor plan that can be tailored to suit your lifestyle needs. The full basement provides additional space, perfect for storage or potential for future cu
Key facts
- Flexible floor plan
- Convenient access
- Full basement
Tags
Property features AI
Finance
- Other: Total rooms: 8; Total units in property: 2; Lot area listed as 1,710
- Financial info: Pets not allowed in building
- HOA & community: Monthly association fee
Exterior
- Parking: Not specified
- Security: Not specified
- Utilities: Not specified
- Home design: 2-story building; Entry level: 1
- Construction: Not specified
- Exterior features: Private outdoor space (over 60 sqft); East and West exposures
Interior
- Kitchen: Details not provided
- Bedrooms: Not specified
- Flooring: Hardwood
- Bathrooms: 3 full bathrooms
- Heating & cooling: Not specified
- Interior features: Unfurnished; Hardwood floors; Decorative fireplace (1)
- Laundry & utility: See remarks for laundry details
Neighborhood map
What this means for you Summary
Snapshot
- This is a 5-bed/3.0-bath multifamily listed at $1.20M.
Deal economics
- At list price, monthly cash flow is $1k ($12k/yr) — positive.
- The deal already cash-flows at list — no discount required.
- To meet the 1% rule (rent ≥ 1% of price), the offer needs to be $1.03M (14.3% below list).
- Recommended offer: $1.03M (14.3% below list) — sets the bar for 1% rule.
- Cap rate 7.3% vs local median 2.6% in New York — top-decile yield for the area; either an underpriced asset or a hidden risk that comps aren't pricing in. Stress-test before assuming the spread holds.
Location & tenants
- Location reads 75/100 on livability (#268 in NY, #4,188 nationally) — a middle-class / working-renter tenant base. Strengths: amenities A+, commute A+, health & safety A; Watch: crime F, cost of living F.
- Market conditions: Rents rising fast (+6.0%/yr); 73 active listings in the ZIP; 10,063 units permitted in Kings County in 2024 (9,789 in 5+ unit buildings).
- At $10,281/mo this rent would consume 189% of the median local household income ($65k/yr) (locally 6603% of renters already pay >50% of income on rent) — very limited rent-growth headroom before tenants either downsize or default.
Forward outlook
- In year one you build about $128k of equity ($8k loan paydown + $120k appreciation (10.0% local appreciation)).
- Kings County population projected at +13% by 2050 — modest demand growth; plan on rents tracking national, not racing it.
- At projected returns (10.0% appreciation + 6.0% rent growth), your $336k cash investment doubles in ~3 years — after that, you're playing with house money.
- By year 2, paydown + projected appreciation supports a ~$206k cash-out refi (75% LTV) — recoverable capital for the next deal without selling this one.
Negotiation context
- It's been on market 23 days — a 2% lower offer ($1.18M) is reasonable based on typical stale-listing flexibility.
Risks & watch-outs
- Watch-outs: built in 1899 — expect roof / HVAC / electrical / plumbing capex.
- Climate carrying-cost: major wind risk, 64% chance of damaging wind over 30y; extreme-heat days projected 7→14/yr by 2055 (HVAC capex compounding) — expect insurance premiums to compound above CPI over the hold.
Questions for the listing agent
- Built in 1899 — when were the roof, HVAC, electrical panel, plumbing, and water heater last replaced?
- Is there a deadline driving the sale (1031 exchange, divorce, estate, relocation)? That informs how much negotiation room exists.
- Schools are B-rated — typically a magnet for longer-tenancy family renters. What's the average tenant stay here, and is there a school-zone premium baked into asking?
- Crime grade is F in this area — have there been break-ins, vandalism, or insurance claims at this property in the last 3 years? What carrier currently insures it and at what premium?
- What's the average days-on-market for RENTAL listings here right now (not sales)? A rising rental-DOM trend means longer vacancies and softer asking-rent achievability than the comps imply.
- What's the recent tenant-quality profile in this submarket — average credit score on applications, eviction rate, late-payment / NSF rate, and stable-employment percentage? A property-management company in the area should have these aggregated.
- How much new apartment / multifamily construction is in the pipeline within 1–3 miles? Heavy new supply (>2% of stock underway) typically softens rents 12–24 months out; light construction supports rent growth.
Investment metrics
- 1% rule
- 0.86% ✗
- Cap rate
- 7.29%
- Cash-on-cash
- 3.57%
- DSCR
- 1.16
- GRM
- 9.7
CMA / ARV
No comps found within radius.
Projected returns pro-forma
10.0% appreciation · 5.95% rent growth · sell at horizon
- IRR
- 27.8%
- Equity multiple
- 3.23×
- Total profit
- $748,142
- Equity at exit
- $1,081,055
- IRR
- 25.0%
- Equity multiple
- 7.62×
- Total profit
- $2,223,718
- Equity at exit
- $2,331,336
Cash invested: $336,000 (down + closing). Projections, not guarantees.
Landlord ↔ Tenant lean methodology
- Overall (CITY)
- 0 Strongly Tenant-Friendly
- State New York
- 15 Strongly Tenant-Friendly · D+10
- County
- — inherits STATE
- City New York
- 0 Strongly Tenant-Friendly · D+34
ZIP-level market 11213
- Home prices YoY
- 4.3%
- Rents YoY
- 6.0%
- Active inventory
- 73
- Price-to-rent
- 29.2×
Monthly cashflow live
- Estimated rent
- $10,281 high interval (Pro) →
- Mortgage (P&I)
- −$6,293
- Tax from tax record
- −$328 /mo · $3,939/yr
- Insurance
- −$500
- HOA
- −$0
- Vacancy / Maint / Mgmt
- −$2,159
- Net cashflow
- $1,001
Break-even live
3-unit breakdown (identical units grouped — click to expand)
| Units | Beds | Baths | Est. rent |
|---|---|---|---|
| 3× units | 2 | 1 | $10,281 |
| #1 | 2 | 1 | $3,427 |
| #2 | 2 | 1 | $3,427 |
| #3 | 2 | 1 | $3,427 |
| Total (3 units) | $10,281 | ||
UW: 25.0% down · 7.5% · 30yr · 1.5% tax · 5.0% vac · 8.0% maint · 8.0% mgmt
Financing live
Cash to close
- Down payment
- $300,000
- Closing costs
- $36,000
- Reserves months
- —
- Total cash needed
- —
Loan-product check · same deal, 3 products live
Conventional
25% down · 7.5% · 30yr
- Down + closing
- —
- Monthly P&I
- —
- Monthly cashflow
- —
- DSCR
- —
- Eligible?
- —
Personal DTI + credit; lowest rate.
DSCR
20% down · 8.5% · 30yr
- Down + closing
- —
- Monthly P&I
- —
- Monthly cashflow
- —
- DSCR
- —
- Eligible?
- —
No personal income docs; deal must DSCR.
Hard money
10% down · 12.0% · 12mo
- Down + closing
- —
- Monthly P&I
- —
- Monthly cashflow
- —
- DSCR
- —
- Eligible?
- —
Short-term bridge; refi at stabilization.
Listing history 14 events
-
2026-06-18days on market $1,200,000 Active 23 DOM
-
2026-06-17days on market $1,200,000 Active 22 DOM
-
2026-06-16days on market $1,200,000 Active 21 DOM
-
2026-06-15days on market $1,200,000 Active 20 DOM
-
2026-06-13days on market $1,200,000 Active 18 DOM
-
2026-06-10days on market $1,200,000 Active 14 DOM
-
2026-06-08days on market $1,200,000 Active 13 DOM
-
2026-06-08days on market $1,200,000 Active 12 DOM
-
2026-06-04days on market $1,200,000 Active 9 DOM
-
2026-06-03days on market $1,200,000 Active 8 DOM
-
2026-06-02days on market $1,200,000 Active 7 DOM
-
2026-06-01days on market $1,200,000 Active 6 DOM
-
2026-05-31days on market $1,200,000 Active 5 DOM
-
2026-05-05$1,200,000 Active
ⓘ Source: listings_history table (triggers on properties + properties_extension) + one-shot
backfill from property_details.listing_events for pre-trigger history.
Tax reassessment forecast NY · Partial reset (capped growth)
- Current annual tax
- $3,939 · $328/mo
- Projected year-2 tax
- $12,110 · $1,009/mo
- Expected delta
- +$8,170/yr (+$681/mo · 207.4%)
ⓘ Screening estimate from a state-policy table — verify with the county assessor before closing.
Climate risk First Street
- Flood 1/10 Low FEMA zone X (unshaded) · 0% chance over 30 yrs
- Wildfire 1/10 Low
- Heat 6/10 Major 7 d/yr ≥99°F today · 14 d/yr by 30 yrs out
- Wind 6/10 Major 64% chance of damaging wind over 30 yrs
- Air quality 5/10 Major 6 unhealthy d/yr today · 8 by 30 yrs out
Nearby sold comps map
Loading sold comps map…
Walkable amenities ~0.75 mi
Loading nearby amenities…
Taxation est. · year 1
- Rental income
- $123,372
- − Mortgage interest
- −$67,219
- − Property taxes
- −$3,939
- − Insurance
- −$6,000
- − Repairs & maintenance
- −$9,870
- − Management
- −$9,870
- − Depreciation
- −$34,909
- Taxable loss
- −$8,435
- Est. tax savings @ 24.0%
- +$2,024
- After-tax cash flow
- $14,034/yr
For passive investors: Depreciation is non-cash, so a rental often shows a tax loss while cash-flowing — sheltering income. Rental losses are passive: they offset passive income freely, and up to $25,000/yr can offset ordinary (W-2) income if you actively participate and your MAGI is under $100k (phasing out to $0 by $150k); unused losses carry forward. On sale, claimed depreciation is recaptured at up to 25%, and gains may owe capital-gains tax (a 1031 exchange can defer both). Figures are a year-1 estimate at your 24.0% rate — not tax advice; consult a CPA.
Schools (NCES district)
No district data.
Livability — New York
- Score
- 75/100
- State rank
- #268
- US rank
- #4188
Category grades
Schools grade is shown separately in the Schools card above.
Census & demographics
- Census place
- New York, NY
- County
- Kings County · 2,614,986 people
- City population
- 7,731,280
- Metro
- New York-Newark-Jersey City, NY-NJ-PA
- Population (ZIP)
- 68,846
- Household income
- $65,127
- Rent vs Own
- Severe rent burden
- 6603.0
Population outlook (Kings County) Hauer SSP2
- Today (2025)
- 2,847,441 people
- By 2030
- 2,937,006 · +3.1%
- By 2040
- 3,095,491 · +8.7%
- By 2050
- 3,228,968 · +13.4%
- By 2075
- 3,321,723 · +16.7%
- By 2100
- 3,111,387 · +9.3%
Race, ethnicity, and origin ACS 2023
- Neighborhood character
- Diverse neighborhood (Simpson 0.61)
- Race & ethnicity
- Black 56% White 23% Hispanic / Latino 13% Two or more races 8% Asian 2%
- Hispanic origin (detail)
- Mexican 1% Puerto Rican 3% Dominican 4%
- Common ancestry
- Hispanic 5% Scotch-Irish 2% Romanian 1%
- Foreign-born
- 32% · Canada, Mexico, China
- Languages at home
- 76% English-only · Spanish 9% French/Haitian/Cajun 6% German/W. Germanic 2%
Political lean MEDSL · Kings
- 2024 margin
- Solid D (+44.0) · D 72.0% · R 28.0%
- 2008→2024 swing
- -15.5pp toward R · 2008: 59.4pp · 2024: 44.0pp
- All cycles
- 2024: D+44.0 2020: D+54.8 2016: D+61.8 2012: D+63.9 2008: D+59.4
Not yet ingested
- Civics
- —
Market trends
- HPI YoY
- ▲ 23.71%
- Current HPI
- 577.3841
- Rent YoY
- ▲ 5.95%
- Metro
- New York-Newark-Jersey City, NY-NJ-PA
- State GDP YoY
- ▲ 2.60%
- F500 in state
- 92
Industry mix (Fortune 500 HQ in NY)
| Industry | F500 HQs | Revenue |
|---|---|---|
| Financial Services | 10 | $950B |
|
||
| Consumer Goods | 9 | $162B |
|
||
| Insurance | 4 | $225B |
|
||
| Telecommunications | 2 | $144B |
|
||
| Pharmaceuticals | 2 | $112B |
|
||
| Media / Entertainment | 2 | $69B |
|
||
Price history
1 event — show timeline
- 2026-05-05 Listed $1,200,000 RLS at REBNY
Property tax history
+6.8%/yrLatest (2025): $3,939 · -1.5% YoY. Source: county tax records.
Cash-flow waterfall
monthlySold comps — $/sqft
last 12 mo · ≤1 miLoading sold comps…