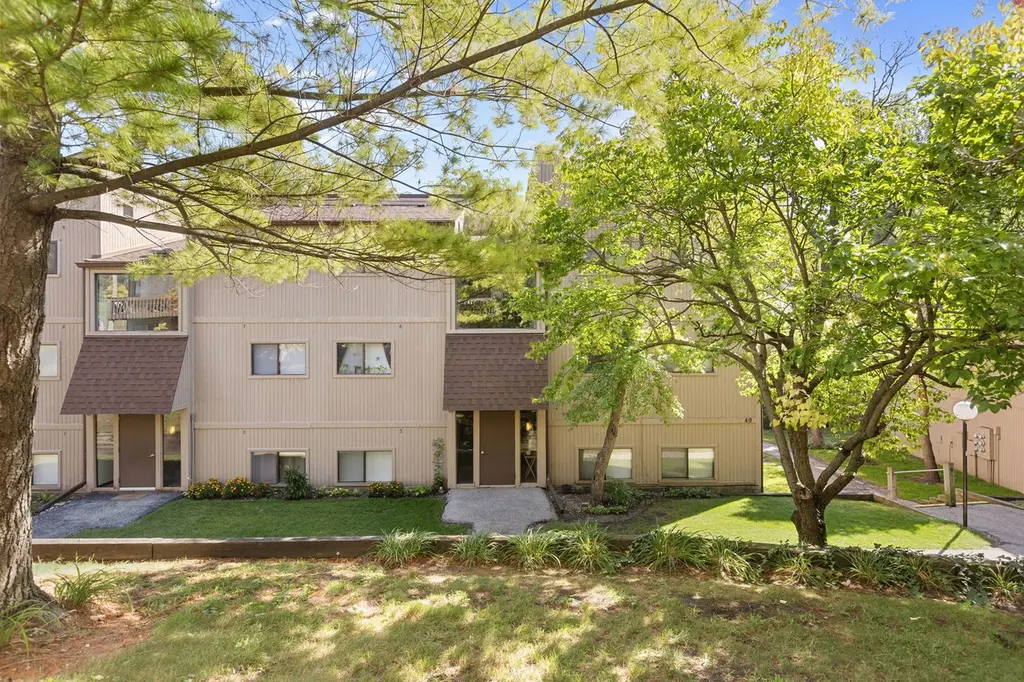
49 Oak Hill Colony #12 · Fox Lake, IL
Flood risk 1/10 · Minimal
- FEMA flood zone
- X (unshaded)
- Chance of flooding over 30 yrs
- 0.0%
- Est. flood insurance / yr
- $507 – $1,088
Fire risk 4/10 · Minor
- Est. fire insurance / yr
- $804 – $1,492
Heat risk 2/10 · Minimal
- Hot days now (above 101°F)
- 7 days/yr
- Hot days in 30 yrs
- 14 days/yr
Wind risk 2/10 · Minimal
- Chance of severe wind over 30 yrs
- —
Air-quality risk 2/10 · Minimal
- Unhealthy air days now
- 1 days/yr
- Unhealthy air days in 30 yrs
- 1 days/yr
Risk factors via First Street. Map © Google.
Why this score? — see what drove the D+ grade
The composite is a weighted blend of 9 inputs, each scored 0–100. Each bar is that input's sub-score; the figure is the points it added to the 100-point composite (weight × sub-score).
- Cash flow +13.3/30.0
- 1% rule +10.0/10.0
- ARV discount +7.5/15.0
- DSCR +4.0/10.0
- Livability +3.7/5.0
- Rent growth +2.5/5.0
- Condition / age +2.5/5.0
- Schools +2.3/10.0
- Appreciation +0.0/10.0
$119,900
🖨 Deal sheet 📄 Offer letter ✓ Due diligence
Listing remarks
Welcome to this bright, all One Level, Innsbruck Model, 2-bedroom, full bathroom condo at Vacation Village! Step into the condo and be greeted by an airy, open concept floor plan. This unit features rare dining area window offering plenty of sunlight and 2 separate sliding doors to covered balcony with pool and water views. Kitchen offers a plenty of cabinets, double sink, dishwasher, and a good amount of counter space for meal preparation as well as breakfast bar & eating area. This cozy and comfortable unit has plenty of storage space to keep your living space organized. 2 large bedrooms with roomy closets for all your possessions. Vacation Village includes Gated entry w/ Security G
Key facts
- Pool and water views
- Covered balcony
- Gated entry
Tags
Property features AI
Finance
- Other: On-site management and community services; Subdivision: Vacation Village; located in Fox Lake
- HOA & community: Monthly association fee of $578; Association fee covers parking, insurance, security, clubhouse, pool, exterior maintenance, lawn care, snow removal and lake rights; Community amenities include clubhouse, in-ground pool, boat dock, bike trails, tennis courts, park, picnic area, party room, coin laundry, school bus service and trails; Pets allowed (cats and dogs) with size and number limits; max pet weight 80 lbs
Exterior
- Parking: Two parking spaces (unassigned, off-street, guest parking available)
- Security: On-site manager Monday through Friday; Community security included in association
- Utilities: Public water; Public sewer; Electric service
- Home design: Attached single-family style condo (Innsbruck model); Condo ownership; Entry level 3; Built 51–60 years ago; Built before 1978
- Construction: Cedar construction; Asphalt roof
- Exterior features: Balcony; In-ground pool; Common grounds and landscaped areas; Beach access and water view
Interior
- Kitchen: Range; Microwave; Dishwasher; Refrigerator; Disposal
- Bedrooms: Master bedroom on main level (10 x 13) with blinds and carpet; Second bedroom on main level (10 x 10) with blinds and carpet; Two additional rooms listed as bedrooms (details not provided)
- Flooring: Carpet in living areas and bedrooms; Ceramic tile in dining room and kitchen
- Bathrooms: One full bathroom with soaking tub
- Heating & cooling: Electric heating; Central air conditioning; Ceiling fan(s)
- Interior features: Storage; Screens, window treatments and drapes throughout; 5 total rooms
- Laundry & utility: Laundry in common area; Electric water heater
Neighborhood map
What this means for you Summary
Snapshot
- This is a 2-bed/1.0-bath condo listed at $120k.
Deal economics
- At list price, monthly cash flow is $0 ($0/yr) — negative.
- To cash-flow at today's rent, offer at most $120k (0.0% below list).
- Meets the 1% rule at list price ($2k rent vs $120k).
- Recommended offer: $118k (1.5% below list) — sets the bar for market timing.
Location & tenants
- Location reads 74/100 on livability (#247 in IL, #4,462 nationally) — a middle-class / working-renter tenant base. Strengths: cost of living A+, housing A+, commute A; Watch: amenities D+, health & safety F.
- Grant Chsd 124 (suburban): math 23% / reading 27% proficiency, ranked #296 of 620 in IL (top 48%) — low school quality limits family demand, transient renter base, plan for 1-2y turnover.
- Zoned schools: Grant Community High School (math 23% / reading 27%, grade F, #247 of 693 statewide, top 36%, 1,837 students, 0% FRL).
- Market conditions: 78 active listings in the ZIP; 5 comparable units currently listed for rent nearby; rentals leasing fast (median 2d on market — plan ~1-2 weeks tenant-placement turnaround); 40% of comp listings sitting > 30 days — soft ceiling on asking rent; 948 units permitted in Lake County in 2024 (424 in 5+ unit buildings).
Forward outlook
- Local home prices are declining (-3.0%/yr); year-one equity from $829 of loan paydown is wiped out by about $4k of value loss. Plan a longer hold.
- Lake County population projected to shrink 8% by 2050 — rents likely to lag national; underwrite the cash flow, not the appreciation.
Negotiation context
- It's been on market 29 days — a 2% lower offer ($118k) is reasonable based on typical stale-listing flexibility.
- 2 sale attempts with the ask held roughly flat each time — persistent listings suggest the price (not the market) is what's stuck; bring a comps-based counter.
- Current owner paid $38k; list at $120k implies a 216% gain — meaningful room to come down on a strong offer.
Risks & watch-outs
- Watch-outs: HOA is 31% of rent.
Questions for the listing agent
- What do current leases actually rent for vs. the listed asking? Can we see a recent rent roll and the last 12 months of T-12 income?
- Built in 1970 — when were the roof, HVAC, electrical panel, plumbing, and water heater last replaced?
- What does the HOA fee cover, when was the last increase, and are there any pending special assessments or reserve-fund shortfalls?
- Any open or pending special assessments — roof, HVAC, plumbing, elevator, façade? What's the per-unit balance and payoff schedule, and is the seller paying it off at close or rolling it to the buyer?
- Is there a deadline driving the sale (1031 exchange, divorce, estate, relocation)? That informs how much negotiation room exists.
- Schools are F-rated, which usually means shorter tenancies and higher turnover. Who's the typical renter profile here, and what's been the actual vacancy rate?
- The area grade is low — what's the realistic commute time and amenity access for the typical tenant pool here? Any planned neighborhood developments (good or bad) we should know about?
- What's the average days-on-market for RENTAL listings here right now (not sales)? A rising rental-DOM trend means longer vacancies and softer asking-rent achievability than the comps imply.
- What's the recent tenant-quality profile in this submarket — average credit score on applications, eviction rate, late-payment / NSF rate, and stable-employment percentage? A property-management company in the area should have these aggregated.
- How much new apartment / multifamily construction is in the pipeline within 1–3 miles? Heavy new supply (>2% of stock underway) typically softens rents 12–24 months out; light construction supports rent growth.
Investment metrics
- 1% rule
- 1.54% ✓
- Cap rate
- 6.29%
- Cash-on-cash
- -0.00%
- DSCR
- 1.00
- GRM
- 5.4
CMA / ARV
No comps found within radius.
Projected returns pro-forma
-3.0% appreciation · 3.0% rent growth · sell at horizon
- IRR
- -15.9%
- Equity multiple
- 0.43×
- Total profit
- $-19,014
- Equity at exit
- $17,877
- IRR
- -6.8%
- Equity multiple
- 0.56×
- Total profit
- $-14,868
- Equity at exit
- $10,367
Cash invested: $33,572 (down + closing). Projections, not guarantees.
Landlord ↔ Tenant lean methodology
- Overall (STATE)
- 43 Moderately Tenant-Leaning
- State Illinois
- 43 Moderately Tenant-Leaning · D+7
- County
- — inherits STATE
- City
- — inherits STATE
ZIP-level market 60020
- Home prices YoY
- -30.7%
- Active inventory
- 78
- Price-to-rent
- 5.4×
Monthly cashflow live
- Estimated rent
- $1,849 medium interval (Pro) →
- Mortgage (P&I)
- −$629
- Tax from tax record
- −$204 /mo · $2,448/yr
- Insurance
- −$50
- HOA
- −$578
- Vacancy / Maint / Mgmt
- −$388
- Net cashflow
- $-0
Break-even live
UW: 25.0% down · 7.5% · 30yr · 1.5% tax · 5.0% vac · 8.0% maint · 8.0% mgmt
Financing live
Cash to close
- Down payment
- $29,975
- Closing costs
- $3,597
- Reserves months
- —
- Total cash needed
- —
Loan-product check · same deal, 3 products live
Conventional
25% down · 7.5% · 30yr
- Down + closing
- —
- Monthly P&I
- —
- Monthly cashflow
- —
- DSCR
- —
- Eligible?
- —
Personal DTI + credit; lowest rate.
DSCR
20% down · 8.5% · 30yr
- Down + closing
- —
- Monthly P&I
- —
- Monthly cashflow
- —
- DSCR
- —
- Eligible?
- —
No personal income docs; deal must DSCR.
Hard money
10% down · 12.0% · 12mo
- Down + closing
- —
- Monthly P&I
- —
- Monthly cashflow
- —
- DSCR
- —
- Eligible?
- —
Short-term bridge; refi at stabilization.
Rent comps 5 comps
| Address | Beds | Baths | Sqft | Rent | $/sqft | DOM | Units | Dist |
|---|---|---|---|---|---|---|---|---|
| 32 Montego Colony #1 Fox Lake, IL | 2.0 | 1.0 | 690 | $1,400 | $2.03 | 44d | 1 | 0.35mi |
| 306 Waverly St Unit 1244943P Spring Grove, IL | 3.0 | 1.0 | 742 | $8,714 | $11.74 | 44d | 1 | 0.57mi |
| 38464 N 8th St Spring Grove, IL | 1.0 | 1.0 | 625 | $2,000 | $3.20 | 1d | 1 | 0.74mi |
| 38381 N 6th Ave Spring Grove, IL | 2.0 | 1.0 | 600 | $1,095 | $1.82 | 1d | 1 | 0.87mi |
| 39259 N Jackson Dr Unit 1374781P Spring Grove, IL | 2.0 | 1.0 | 990 | $4,725 | $4.77 | 1d | 1 | 1.28mi |
HOA detail condo
- Monthly dues
- $578 · $6,936/yr
- Likely covers
- waterpoolsecurity
- Assessments
- None detected in remarks — confirm with the listing agent.
Listing history 19 events
-
2026-06-18days on market $119,900 Active 29 DOM
-
2026-06-17days on market $119,900 Active 28 DOM
-
2026-06-16days on market $119,900 Active 27 DOM
-
2026-06-15days on market $119,900 Active 26 DOM
-
2026-06-13pricedays on market $119,900 Active 24 DOM
-
2026-06-09days on market $122,000 Active 20 DOM
-
2026-06-08days on market $122,000 Active 19 DOM
-
2026-06-07days on market $122,000 Active 18 DOM
-
2026-06-04days on market $122,000 Active 15 DOM
-
2026-06-03days on market $122,000 Active 14 DOM
-
2026-06-02days on market $122,000 Active 13 DOM
-
2026-06-01days on market $122,000 Active 12 DOM
-
2026-05-31days on market $122,000 Active 11 DOM
-
2026-05-20historical
-
2026-05-20$122,000 Active
-
2026-05-04price
-
2026-03-12Active
-
1991-04-01soldstatus $38,000
-
1984-07-01soldstatus $27,750
ⓘ Source: listings_history table (triggers on properties + properties_extension) + one-shot
backfill from property_details.listing_events for pre-trigger history.
Tax reassessment forecast IL · Partial reset (capped growth)
- Current annual tax
- $2,448 · $204/mo
- Projected year-2 tax
- $2,585 · $215/mo
- Expected delta
- +$137/yr (+$11/mo · 5.6%)
ⓘ Screening estimate from a state-policy table — verify with the county assessor before closing.
Climate risk First Street
- Flood 1/10 Low FEMA zone X (unshaded) · 0% chance over 30 yrs
- Wildfire 4/10 Moderate
- Heat 2/10 Low 7 d/yr ≥101°F today · 14 d/yr by 30 yrs out
- Wind 2/10 Low
- Air quality 2/10 Low 1 unhealthy d/yr today · 1 by 30 yrs out
Nearby sold comps map
Loading sold comps map…
Walkable amenities ~0.75 mi
Loading nearby amenities…
Taxation est. · year 1
- Rental income
- $22,188
- − Mortgage interest
- −$6,716
- − Property taxes
- −$2,448
- − Insurance
- −$600
- − Repairs & maintenance
- −$1,775
- − Management
- −$1,775
- − HOA
- −$6,936
- − Depreciation
- −$3,488
- Taxable loss
- −$1,550
- Est. tax savings @ 24.0%
- +$372
- After-tax cash flow
- $372/yr
For passive investors: Depreciation is non-cash, so a rental often shows a tax loss while cash-flowing — sheltering income. Rental losses are passive: they offset passive income freely, and up to $25,000/yr can offset ordinary (W-2) income if you actively participate and your MAGI is under $100k (phasing out to $0 by $150k); unused losses carry forward. On sale, claimed depreciation is recaptured at up to 25%, and gains may owe capital-gains tax (a 1031 exchange can defer both). Figures are a year-1 estimate at your 24.0% rate — not tax advice; consult a CPA.
Schools (NCES district)
- District
- Grant Chsd 124
- NCES district ID
- 1717340
- Math proficiency
- 23% ▼ -9.00%
- Reading proficiency
- 27% ▼ -7.00%
- Median HH income
- $59,450
- Composite
- 22.95/100
- National rank
- #7989
- State rank
- #296 of 620 in IL
Livability — Fox Lake
- Score
- 74/100
- State rank
- #247
- US rank
- #4462
Category grades
Schools grade is shown separately in the Schools card above.
Census & demographics
- Census place
- Fox Lake, IL
- City population
- 10,846
- Population (ZIP)
- 10,846
Population outlook (Lake County) Hauer SSP2
- Today (2025)
- 700,217 people
- By 2030
- 693,290 · -1.0%
- By 2040
- 673,588 · -3.8%
- By 2050
- 643,556 · -8.1%
- By 2075
- 562,792 · -19.6%
- By 2100
- 457,715 · -34.6%
Race, ethnicity, and origin ACS 2023
- Neighborhood character
- Predominantly White (80%)
- Race & ethnicity
- White 80% Hispanic / Latino 12% Two or more races 10% Black 3%
- Hispanic origin (detail)
- Mexican 10% Puerto Rican 1%
- Common ancestry
- Romanian 15% Portuguese 2% Italian 2%
- Foreign-born
- 10% · Canada, South Korea
- Languages at home
- 87% English-only · Spanish 6% Russian/Polish/Slavic 3% Other Indo-European 1%
Political lean MEDSL · Lake
- 2024 margin
- Strong D (+20.8) · D 59.7% · R 38.9% · Other 1.4%
- 2008→2024 swing
- +1.1pp toward D · 2008: 19.6pp · 2024: 20.8pp
- All cycles
- 2024: D+20.8 2020: D+24.1 2016: D+20.3 2012: D+8.1 2008: D+19.6
Not yet ingested
- Civics
- —
Market trends
- HPI YoY
- ▼ -97.19%
- Current HPI
- 219.6301
- Rent YoY
- —
- Metro
- —
- State GDP YoY
- ▲ 1.59%
- F500 in state
- 60
Industry mix (Fortune 500 HQ in IL)
| Industry | F500 HQs | Revenue |
|---|---|---|
| Insurance | 4 | $201B |
|
||
| Consumer Goods | 4 | $87B |
|
||
| Industrial Machinery | 3 | $64B |
|
||
| Healthcare | 2 | $55B |
|
||
| Retail / Pharmacy | 1 | $148B |
|
||
| Agriculture / Food | 1 | $86B |
|
||
Price history
+339.6% since first listed6 events — show timeline
- 2026-05-20 Listed $122,000 MRED as Distributed by MLS Grid
- 2026-05-20 Listing Removed — MRED as Distributed by MLS Grid
- 2026-05-04 Price Changed — MRED as Distributed by MLS Grid
- 2026-03-12 Listed — MRED as Distributed by MLS Grid
- 1991-04-01 Sold (Public Records) $38,000 Public Records
- 1984-07-01 Sold (Public Records) $27,750 Public Records
Property tax history
+2.5%/yrLatest (2024): $2,448 · +4.1% YoY. Source: county tax records.
Cash-flow waterfall
monthlySold comps — $/sqft
last 12 mo · ≤1 miLoading sold comps…