 12-Plex
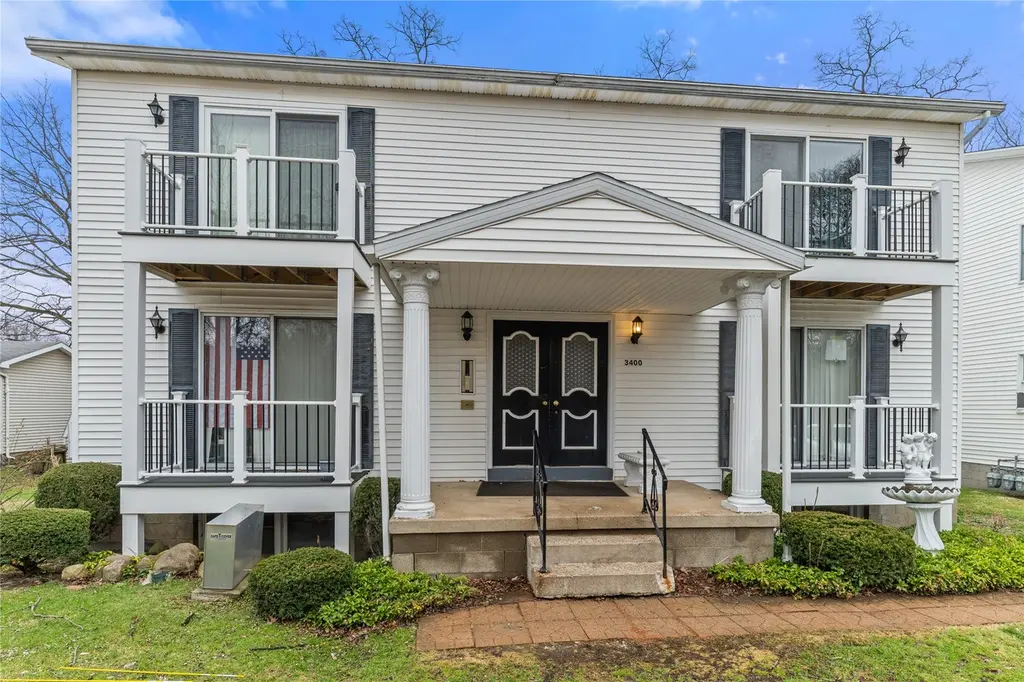
3400 Francis St · Wesleyville, PA
Flood risk 1/10 · Minimal
- FEMA flood zone
- X (unshaded)
- Chance of flooding over 30 yrs
- 0.0%
- Est. flood insurance / yr
- $507 – $1,088
Fire risk 1/10 · Minimal
- Est. fire insurance / yr
- $511 – $949
Heat risk 2/10 · Minimal
- Hot days now (above 89°F)
- 7 days/yr
- Hot days in 30 yrs
- 17 days/yr
Wind risk 1/10 · Minimal
- Chance of severe wind over 30 yrs
- —
Air-quality risk 4/10 · Minor
- Unhealthy air days now
- 3 days/yr
- Unhealthy air days in 30 yrs
- 7 days/yr
Risk factors via First Street. Map © Google.
Why this score? — see what drove the B- grade
The composite is a weighted blend of 9 inputs, each scored 0–100. Each bar is that input's sub-score; the figure is the points it added to the 100-point composite (weight × sub-score).
- Cash flow +29.8/30.0
- DSCR +10.0/10.0
- 1% rule +7.8/10.0
- ARV discount +7.5/15.0
- Schools +4.0/10.0
- Livability +4.0/5.0
- Rent growth +2.5/5.0
- Condition / age +2.5/5.0
- Appreciation +0.0/10.0
$899,900
🖨 Deal sheet 📄 Offer letter ✓ Due diligence
Multi-family units
County records classify this as Multi-Family (5+ Unit). Listing-text estimate: 12 units. confirmed
5+ unit building — per-unit beds/baths from public records are typically unavailable; the breakdown below (if shown) is an estimate from the listing text.
Listing remarks MLS
Discover a rare 12-unit investment opportunity tucked away on a quiet dead-end street in Wesleyville Borough, located within the highly desirable Iroquois School District. This well-maintained, family-owned asset offers massive cash flow potential with strong in-place fundamentals and clear upside. The property features oversized 1-bedroom, 1-bath units with full kitchens, spacious living rooms, private balconies, and A/C in each unit. Tenants pay all utilities except sewer and garbage, keeping expenses low with separately metered systems throughout. Positioned with peaceful creek views and off-street parking, the setting delivers both tenant appeal and long-term stability. This is a true sleeper—rarely do properties like this hit the market. Whether you're looking to expand your portfolio or step into a high-performing asset, this is your chance to unlock serious value.
Key facts
- 0.29 acre lot
- 14 parking spots
- Built 1979
Neighborhood map
What this means for you Summary
Snapshot
- This is a 12 × 1-bed/1-bath units multifamily listed at $900k.
Deal economics
- At list price, monthly cash flow is $3k ($40k/yr) — positive. Per door: $275/mo.
- The deal already cash-flows at list — no discount required.
- Meets the 1% rule at list price ($12k rent vs $900k).
- Recommended offer: $846k (6.0% below list) — sets the bar for market timing.
Location & tenants
- Location reads 80/100 on livability (#195 in PA, #1,671 nationally) — a professional / high-income tenant draw. Strengths: commute A+, cost of living A+, health & safety A+; Watch: schools D+, crime D+, employment D.
- Iroquois SD (suburban): math 39% / reading 55% proficiency, ranked #236 of 539 in PA (top 44%) — families likely to look elsewhere, expect single-tenant / working-renter base with shorter leases.
- Market conditions: 76 active listings in the ZIP; 364 units permitted in Erie County in 2024 (188 in 5+ unit buildings).
Forward outlook
- Local home prices are declining (-3.0%/yr); year-one equity from $6k of loan paydown is wiped out by about $27k of value loss. Plan a longer hold.
- Erie County population projected at -14% by 2050 — secular population decline; favor cash flow + early exit over multi-decade hold.
- At projected returns (-3.0% appreciation + 3.0% rent growth), your $252k cash investment doubles in ~8 years — after that, you're playing with house money.
Negotiation context
- It's been on market 80 days — a 6% lower offer ($846k) is reasonable based on typical stale-listing flexibility.
Questions for the listing agent
- It's been on market 80 days. Have you received any prior offers? Is the seller open to a 6% concession, seller financing, or rate buy-down credit?
- Can we see the unit-by-unit rent roll, current vacancy, and any below-market leases? What's the average tenancy length?
- What capital expenditures (roof, boiler, parking lot, exteriors) have been made in the last 5 years, and what's planned in the next 2?
- Built in 1979 — when were the roof, HVAC, electrical panel, plumbing, and water heater last replaced?
- Why hasn't it sold? Are there any deal-killer items the seller is aware of (foundation, flood, title, zoning, code violations)?
- Is there a deadline driving the sale (1031 exchange, divorce, estate, relocation)? That informs how much negotiation room exists.
- Schools are D-rated, which usually means shorter tenancies and higher turnover. Who's the typical renter profile here, and what's been the actual vacancy rate?
- Crime grade is D in this area — have there been break-ins, vandalism, or insurance claims at this property in the last 3 years? What carrier currently insures it and at what premium?
- What's the average days-on-market for RENTAL listings here right now (not sales)? A rising rental-DOM trend means longer vacancies and softer asking-rent achievability than the comps imply.
- What's the recent tenant-quality profile in this submarket — average credit score on applications, eviction rate, late-payment / NSF rate, and stable-employment percentage? A property-management company in the area should have these aggregated.
- How much new apartment / multifamily construction is in the pipeline within 1–3 miles? Heavy new supply (>2% of stock underway) typically softens rents 12–24 months out; light construction supports rent growth.
Investment metrics
- 1% rule
- 1.28% ✓
- Cap rate
- 10.70%
- Cash-on-cash
- 15.72%
- DSCR
- 1.70
- GRM
- 6.5
CMA / ARV
No comps found within radius.
Projected returns pro-forma
-3.0% appreciation · 3.0% rent growth · sell at horizon
- IRR
- 6.6%
- Equity multiple
- 1.26×
- Total profit
- $64,381
- Equity at exit
- $134,178
- IRR
- 15.9%
- Equity multiple
- 2.30×
- Total profit
- $326,518
- Equity at exit
- $77,807
Cash invested: $251,972 (down + closing). Projections, not guarantees.
Landlord ↔ Tenant lean methodology
- Overall (STATE)
- 62 Landlord-Friendly
- State Pennsylvania
- 62 Landlord-Friendly · EVEN
- County
- — inherits STATE
- City
- — inherits STATE
ZIP-level market 16510
- Home prices YoY
- -33.7%
- Active inventory
- 76
- Price-to-rent
- 78.0×
Monthly cashflow live
- Estimated rent
- $11,533 medium interval (Pro) →
- Mortgage (P&I)
- −$4,719
- Tax from tax record
- −$715 /mo · $8,584/yr
- Insurance
- −$375
- HOA
- −$0
- Vacancy / Maint / Mgmt
- −$2,422
- Net cashflow
- $3,302
Break-even live
12-unit breakdown (identical units grouped — click to expand)
| Units | Beds | Baths | Est. rent |
|---|---|---|---|
| 12× units | 1 | 1 | $11,532 |
| #1 | 1 | 1 | $961 |
| #2 | 1 | 1 | $961 |
| #3 | 1 | 1 | $961 |
| #4 | 1 | 1 | $961 |
| #5 | 1 | 1 | $961 |
| #6 | 1 | 1 | $961 |
| #7 | 1 | 1 | $961 |
| #8 | 1 | 1 | $961 |
| #9 | 1 | 1 | $961 |
| #10 | 1 | 1 | $961 |
| #11 | 1 | 1 | $961 |
| #12 | 1 | 1 | $961 |
| Total (12 units) | $11,533 | ||
UW: 25.0% down · 7.5% · 30yr · 1.5% tax · 5.0% vac · 8.0% maint · 8.0% mgmt
Financing live
Cash to close
- Down payment
- $224,975
- Closing costs
- $26,997
- Reserves months
- —
- Total cash needed
- —
Loan-product check · same deal, 3 products live
Conventional
25% down · 7.5% · 30yr
- Down + closing
- —
- Monthly P&I
- —
- Monthly cashflow
- —
- DSCR
- —
- Eligible?
- —
Personal DTI + credit; lowest rate.
DSCR
20% down · 8.5% · 30yr
- Down + closing
- —
- Monthly P&I
- —
- Monthly cashflow
- —
- DSCR
- —
- Eligible?
- —
No personal income docs; deal must DSCR.
Hard money
10% down · 12.0% · 12mo
- Down + closing
- —
- Monthly P&I
- —
- Monthly cashflow
- —
- DSCR
- —
- Eligible?
- —
Short-term bridge; refi at stabilization.
Listing history 12 events
-
2026-06-15statusdays on market $899,900 Pending 80 DOM
-
2026-06-13days on market $899,900 Active 79 DOM
-
2026-06-12days on market $899,900 Active 78 DOM
-
2026-06-09days on market $899,900 Active 75 DOM
-
2026-06-08days on market $899,900 Active 74 DOM
-
2026-06-08days on market $899,900 Active 73 DOM
-
2026-06-07days on market $899,900 Active 72 DOM
-
2026-06-04pricedays on market $899,900 Active 69 DOM
-
2026-06-02days on market $965,000 Active 68 DOM
-
2026-06-01days on market $965,000 Active 67 DOM
-
2026-05-31days on market $965,000 Active 66 DOM
-
2026-03-26$965,000 Active 889-char remark
Show marketing remark (889 chars)
Discover a rare 12-unit investment opportunity tucked away on a quiet dead-end street in Wesleyville Borough, located within the highly desirable Iroquois School District. This well-maintained, family-owned asset offers massive cash flow potential with strong in-place fundamentals and clear upside. The property features oversized 1-bedroom, 1-bath units with full kitchens, spacious living rooms, private balconies, and A/C in each unit. Tenants pay all utilities except sewer and garbage, keeping expenses low with separately metered systems throughout. Positioned with peaceful creek views and off-street parking, the setting delivers both tenant appeal and long-term stability. This is a true sleeper—rarely do properties like this hit the market. Whether you're looking to expand your portfolio or step into a high-performing asset, this is your chance to unlock serious value.
ⓘ Source: listings_history table (triggers on properties + properties_extension) + one-shot
backfill from property_details.listing_events for pre-trigger history.
Tax reassessment forecast PA · Partial reset (capped growth)
- Current annual tax
- $8,584 · $715/mo
- Projected year-2 tax
- $11,401 · $950/mo
- Expected delta
- +$2,817/yr (+$235/mo · 32.8%)
ⓘ Screening estimate from a state-policy table — verify with the county assessor before closing.
Climate risk First Street
- Flood 1/10 Low FEMA zone X (unshaded) · 0% chance over 30 yrs
- Wildfire 1/10 Low
- Heat 2/10 Low 7 d/yr ≥89°F today · 17 d/yr by 30 yrs out
- Wind 1/10 Low
- Air quality 4/10 Moderate 3 unhealthy d/yr today · 7 by 30 yrs out
Nearby sold comps map
Loading sold comps map…
Walkable amenities ~0.75 mi
Loading nearby amenities…
Taxation est. · year 1
- Rental income
- $138,396
- − Mortgage interest
- −$50,408
- − Property taxes
- −$8,584
- − Insurance
- −$4,500
- − Repairs & maintenance
- −$11,072
- − Management
- −$11,072
- − Depreciation
- −$26,179
- Taxable income
- $26,582
- Est. tax owed @ 24.0%
- −$6,380
- After-tax cash flow
- $33,240/yr
For passive investors: Depreciation is non-cash, so a rental often shows a tax loss while cash-flowing — sheltering income. Rental losses are passive: they offset passive income freely, and up to $25,000/yr can offset ordinary (W-2) income if you actively participate and your MAGI is under $100k (phasing out to $0 by $150k); unused losses carry forward. On sale, claimed depreciation is recaptured at up to 25%, and gains may owe capital-gains tax (a 1031 exchange can defer both). Figures are a year-1 estimate at your 24.0% rate — not tax advice; consult a CPA.
Schools (NCES district)
- District
- Iroquois SD
- NCES district ID
- 4212210
- Math proficiency
- 39% ▼ -13.00%
- Reading proficiency
- 55% ▼ -12.00%
- Median HH income
- $50,338
- Composite
- 40.27/100
- National rank
- #3766
- State rank
- #236 of 539 in PA
Livability — Wesleyville
- Score
- 80/100
- State rank
- #195
- US rank
- #1671
Category grades
Schools grade is shown separately in the Schools card above.
Census & demographics
- Census place
- Wesleyville, PA
- Population (ZIP)
- 25,152
Population outlook (Erie County) Hauer SSP2
- Today (2025)
- 272,159 people
- By 2030
- 266,299 · -2.2%
- By 2040
- 250,987 · -7.8%
- By 2050
- 234,925 · -13.7%
- By 2075
- 199,164 · -26.8%
- By 2100
- 162,985 · -40.1%
Race, ethnicity, and origin ACS 2023
- Neighborhood character
- Predominantly White (80%)
- Race & ethnicity
- White 80% Hispanic / Latino 6% Black 6% Asian 4% Two or more races 4%
- Hispanic origin (detail)
- Mexican 1% Puerto Rican 4%
- Common ancestry
- Romanian 12% Subsaharan African 2% Lithuanian 2%
- Foreign-born
- 8% · Vietnam, India, Canada
- Languages at home
- 88% English-only · Arabic 3% Spanish 3% Other Indo-European 2%
Political lean MEDSL · Erie
- 2024 margin
- Toss-up / Even · D 49.0% · R 50.0%
- 2008→2024 swing
- -20.9pp toward R · 2008: 19.9pp · 2024: -1.0pp
- All cycles
- 2024: R+1.0 2020: D+1.0 2016: R+2.0 2012: D+16.9 2008: D+19.9
Not yet ingested
- Civics
- —
Market trends
- HPI YoY
- ▼ -122.36%
- Current HPI
- 240.7222
- Rent YoY
- —
- Metro
- —
- State GDP YoY
- ▲ 1.68%
- F500 in state
- 34
Industry mix (Fortune 500 HQ in PA)
| Industry | F500 HQs | Revenue |
|---|---|---|
| Healthcare | 2 | $309B |
|
||
| Insurance | 2 | $27B |
|
||
| Telecommunications / Media | 1 | $124B |
|
||
| Industrial Distribution | 1 | $22B |
|
||
| Financial Services | 1 | $20B |
|
||
| Chemicals / Materials | 1 | $18B |
|
||
Price history
1 event — show timeline
- 2026-03-26 Listed $965,000 GEBOR
Property tax history
+1.0%/yrLatest (2026): $8,584 · -21.6% YoY. Source: county tax records.
Cash-flow waterfall
monthlySold comps — $/sqft
last 12 mo · ≤1 miLoading sold comps…