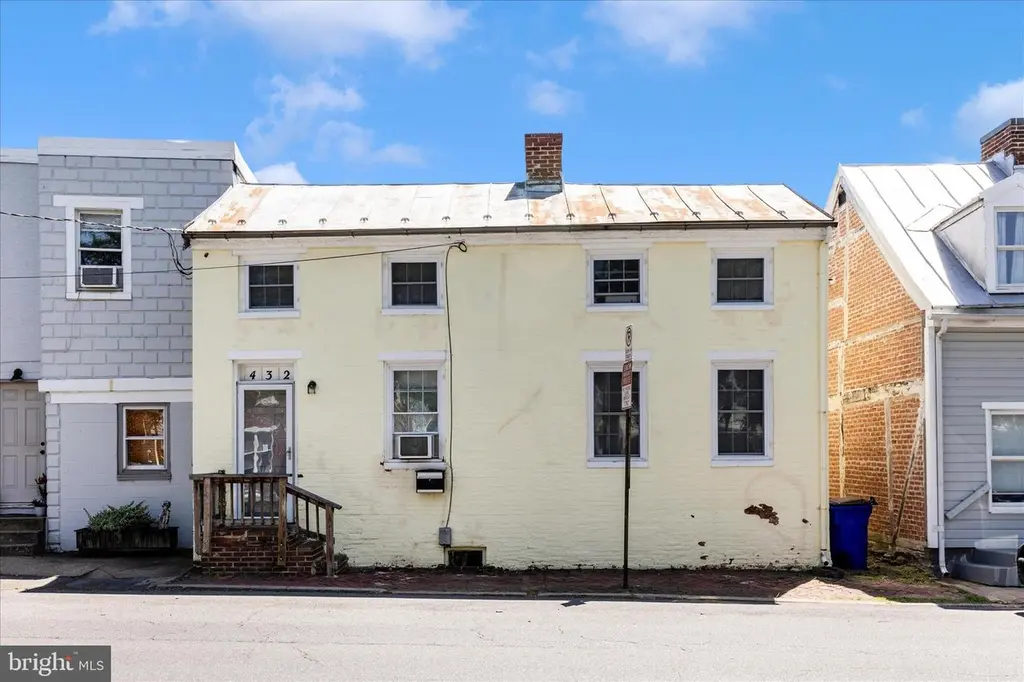
432 N Bentz · Frederick, MD
Flood risk 1/10 · Minimal
- FEMA flood zone
- X (unshaded)
- Chance of flooding over 30 yrs
- 0.0%
- Est. flood insurance / yr
- $473 – $860
Fire risk 1/10 · Minimal
- Est. fire insurance / yr
- $755 – $1,403
Heat risk 6/10 · Moderate
- Hot days now (above 106°F)
- 7 days/yr
- Hot days in 30 yrs
- 16 days/yr
Wind risk 3/10 · Minor
- Chance of severe wind over 30 yrs
- 6.0%
Air-quality risk 2/10 · Minimal
- Unhealthy air days now
- 1 days/yr
- Unhealthy air days in 30 yrs
- 2 days/yr
Risk factors via First Street. Map © Google.
Why this score? — see what drove the D grade
The composite is a weighted blend of 9 inputs, each scored 0–100. Each bar is that input's sub-score; the figure is the points it added to the 100-point composite (weight × sub-score).
- ARV discount +15.0/15.0
- Cash flow +11.0/30.0
- Livability +3.9/5.0
- Schools +3.4/10.0
- DSCR +3.2/10.0
- 1% rule +3.0/10.0
- Rent growth +2.7/5.0
- Condition / age +2.5/5.0
- Appreciation +0.0/10.0
$285,000
🖨 Deal sheet (PDF) 📄 Offer letter ✓ Due diligence
Listing remarks
LOCATION and POTENTIAL. This fixer-upper is ripe for the picking for the right person to see its potential. If you have a creative eye for design and spaces, this house will speak to you. Such a unique layout and piece of property in Downtown Frederick. It's double wide compared to most rowhomes in Downtown. Main level has a living room, kitchen with fireplace, an added room off of living room, small bedroom and full bath. Off the back is an enclosed room that is just waiting for someone to do something with it. This main level could be reimagined to be FABULOUS. The upper level offers two small rooms that make darling bedrooms. The back yard could be an absolutely delightful little courtya
Key facts
- Back yard
- Unique layout
- Prime location
Tags
Property features AI
Exterior
- Parking: On-street parking
- Utilities: Public water; Public sewer; Municipal trash service
- Home design: Detached property; Historic designation; Building not winterized
- Construction: Brick construction; Stone foundation; Metal roof
- Exterior features: Located in downtown area; Not in federal flood zone
Interior
- Kitchen: Stove; Refrigerator; Built-in microwave; Dishwasher; Exhaust fan
- Bedrooms: One bedroom on the main level; Two bedrooms on the upper level
- Flooring: Carpet; Vinyl
- Bathrooms: One full bathroom on the main level; One full bathroom total
- Heating & cooling: Electric baseboard heating; Window air conditioning units; Electric hot water
- Interior features: Tub/shower; Combination kitchen and dining area; Family room off the kitchen; Eat-in kitchen; Unfinished walkout basement with rear entrance; Non-functioning fireplace (1)
- Laundry & utility: Stacked washer/dryer; Main-floor laundry
Neighborhood map
What this means for you Summary
Snapshot
- This is a 3-bed/1.0-bath single-family listed at $285k.
Deal economics
- At list price, monthly cash flow is $-119 ($-1k/yr) — negative.
- To cash-flow at today's rent, offer at most $264k (7.4% below list).
- To meet the 1% rule (rent ≥ 1% of price), the offer needs to be $229k (19.5% below list).
- Recommended offer: $229k (19.5% below list) — sets the bar for 1% rule.
- Cap rate 5.8% vs local median 3.3% in Frederick — top-decile yield for the area; either an underpriced asset or a hidden risk that comps aren't pricing in. Stress-test before assuming the spread holds.
Location & tenants
- Location reads 77/100 on livability (#80 in MD, #3,041 nationally) — a middle-class / working-renter tenant base. Strengths: employment A+, housing A+, health & safety A+; Watch: amenities C-, crime D+, cost of living D+.
- Frederick County Public Schools (other): math 27% / reading 43% proficiency, ranked #4 of 24 in MD (top 17%) — families likely to look elsewhere, expect single-tenant / working-renter base with shorter leases.
- Zoned schools: Parkway Elementary (math 22% / reading 37%, grade F, #201 of 860 statewide, top 25%, 258 students, 45% FRL); West Frederick Middle (math 11% / reading 36%, grade F, #118 of 225 statewide, top 54%, 776 students, 61% FRL); Frederick High (math 42% / reading 64%, grade C-, #95 of 222 statewide, top 43%, 1,829 students, 51% FRL) — zoned schools average 52% FRL vs 20% district-wide (32 pts higher); higher-poverty schools than district average — tighter screening recommended.
- Market conditions: Rents flat; 275 active listings in the ZIP; 24 comparable units currently listed for rent nearby; rentals at typical pace (median 27d on market — plan ~3-4 weeks tenant-placement turnaround); 42% of comp listings sitting > 30 days — soft ceiling on asking rent; solid renter incomes; 1,562 units permitted in Frederick County in 2024 (374 in 5+ unit buildings).
Forward outlook
- Local home prices are declining (-3.0%/yr); year-one equity from $2k of loan paydown is wiped out by about $9k of value loss. Plan a longer hold.
- Frederick County population projected at +15% by 2050 — long-run rental-demand tailwind backs the buy-and-hold thesis.
Negotiation context
- It's been on market 39 days — a 3% lower offer ($276k) is reasonable based on typical stale-listing flexibility.
- 5 sale attempts since 29y ago with the ask held roughly flat each time — persistent listings suggest the price (not the market) is what's stuck; bring a comps-based counter.
- Current owner paid $49k; list at $285k implies a 482% gain — meaningful room to come down on a strong offer.
Risks & watch-outs
- Watch-outs: built in 1895 — expect roof / HVAC / electrical / plumbing capex.
- Climate carrying-cost: extreme-heat days projected 7→16/yr by 2055 (HVAC capex compounding) — expect insurance premiums to compound above CPI over the hold.
Questions for the listing agent
- What do current leases actually rent for vs. the listed asking? Can we see a recent rent roll and the last 12 months of T-12 income?
- It's been on market 39 days. Have you received any prior offers? Is the seller open to a 20% concession, seller financing, or rate buy-down credit?
- Built in 1895 — when were the roof, HVAC, electrical panel, plumbing, and water heater last replaced?
- Is there a deadline driving the sale (1031 exchange, divorce, estate, relocation)? That informs how much negotiation room exists.
- Schools are B-rated — typically a magnet for longer-tenancy family renters. What's the average tenant stay here, and is there a school-zone premium baked into asking?
- Crime grade is D in this area — have there been break-ins, vandalism, or insurance claims at this property in the last 3 years? What carrier currently insures it and at what premium?
- The area grade is low — what's the realistic commute time and amenity access for the typical tenant pool here? Any planned neighborhood developments (good or bad) we should know about?
- What's the average days-on-market for RENTAL listings here right now (not sales)? A rising rental-DOM trend means longer vacancies and softer asking-rent achievability than the comps imply.
- What's the recent tenant-quality profile in this submarket — average credit score on applications, eviction rate, late-payment / NSF rate, and stable-employment percentage? A property-management company in the area should have these aggregated.
- How much new for-sale + rental construction is in the pipeline within 1–3 miles? Heavy new supply typically softens prices + rents 12–24 months out; constrained supply supports both.
Investment metrics
- 1% rule
- 0.80% ✗
- Cap rate
- 5.79%
- Cash-on-cash
- -1.79%
- DSCR
- 0.92
- GRM
- 10.4
CMA / ARV
- ARV (median comp)
- $366,774
- List price
- $285,000
- Delta
- -22.30%
- Verdict
- UNDERPRICED
- Comps
- 20 within 1.0 mi
Show comp detail 2 sales within ~0.75 mi
| Address | Dist | Beds/Ba | Sqft | Sold | Price | $/sf | Match |
|---|---|---|---|---|---|---|---|
| 426 N Bentz St | 0.01mi | 2/1.5 (-1) | 1,089 (+13%) | 5mo | $280,000 | $257 | 66 |
| 200 Washington St | 0.75mi | 3/1.0 | 902 (-6%) | 13mo | $262,000 | $290 | 44 |
Match score weights: distance 35% · size 25% · config 20% · recency 20%. Top-matched comps best support the ARV.
Projected returns pro-forma
-3.0% appreciation · 0.82% rent growth · sell at horizon
- IRR
- -21.7%
- Equity multiple
- 0.26×
- Total profit
- $-58,670
- Equity at exit
- $42,494
- IRR
- -21.5%
- Equity multiple
- -0.00×
- Total profit
- $-80,137
- Equity at exit
- $24,642
Cash invested: $79,800 (down + closing). Projections, not guarantees.
Landlord ↔ Tenant lean methodology
- Overall (STATE)
- 27 Tenant-Leaning
- State Maryland
- 27 Tenant-Leaning · D+14
- County
- — inherits STATE
- City
- — inherits STATE
ZIP-level market 21701
- Rents YoY
- 0.8%
- Active inventory
- 275
- Price-to-rent
- 10.4×
Monthly cashflow live
- Estimated rent
- $2,293 high interval (Pro) →
- Mortgage (P&I)
- −$1,495
- Tax from tax record
- −$317 /mo · $3,809/yr
- Insurance
- −$119
- HOA
- −$0
- Vacancy / Maint / Mgmt
- −$482
- Net cashflow
- $-119
Break-even live
Sensitivity live
| Price | -10% $42 | -5% $-38 | +0% $-119 | +5% $-200 | +10% $-280 |
|---|---|---|---|---|---|
| Rent | -10% $-300 | -5% $-210 | +0% $-119 | +5% $-28 | +10% $62 |
| Rate | -1.0pp $25 | -0.5pp $-46 | base $-119 | +0.5pp $-193 | +1.0pp $-268 |
UW: 25.0% down · 7.5% · 30yr · 1.5% tax · 5.0% vac · 8.0% maint · 8.0% mgmt
Financing live
Cash to close
- Down payment
- $71,250
- Closing costs
- $8,550
- Reserves months
- —
- Total cash needed
- —
Loan-product check · same deal, 3 products live
Conventional
25% down · 7.5% · 30yr
- Down + closing
- —
- Monthly P&I
- —
- Monthly cashflow
- —
- DSCR
- —
- Eligible?
- —
Personal DTI + credit; lowest rate.
DSCR
20% down · 8.5% · 30yr
- Down + closing
- —
- Monthly P&I
- —
- Monthly cashflow
- —
- DSCR
- —
- Eligible?
- —
No personal income docs; deal must DSCR.
Hard money
10% down · 12.0% · 12mo
- Down + closing
- —
- Monthly P&I
- —
- Monthly cashflow
- —
- DSCR
- —
- Eligible?
- —
Short-term bridge; refi at stabilization.
Rent comps 24 comps
| Address | Beds | Baths | Sqft | Rent | $/sqft | DOM | Units | Dist |
|---|---|---|---|---|---|---|---|---|
| 232 Dill Ave Frederick, MD | 2.0 | 1.0 | 1122 | $2,475 | $2.21 | 45d | 1 | 0.09mi |
| 31 W Patrick St Frederick, MD | 2.0 | 1.5–2.0 | 1040 | $1,648 | $1.58 | 19d | 1 | 0.39mi |
| 123 E 8th St Frederick, MD | 2.0 | 1.0 | 1000 | $1,550 | $1.55 | 45d | 2 | 0.48mi |
| 110 Ice St Unit 110 Frederick, MD | 2.0 | 1.0 | 983 | $1,650 | $1.68 | 45d | 1 | 0.58mi |
| 400 E 7th St Frederick, MD | 3.0 | 1.0–2.0 | 920 | $3,164 | $3.44 | 0d | 31 | 0.77mi |
| 128 Water St Frederick, MD | 2.0 | 2.0 | 870 | $2,400 | $2.76 | 7d | 1 | 0.81mi |
| 524 W South St Frederick, MD | 1.0–3.0 | 1.0–2.0 | 1022 | $2,100 | $2.05 | 45d | 1 | 0.81mi |
| 1313 Motter Ave Frederick, MD | 1.0–2.0 | 1.0 | 536 | $1,600 | $2.99 | 7d | 6 | 0.86mi |
| 423 E Patrick St Frederick, MD | 1.0–3.0 | 1.0–1.5 | 1127 | $2,275 | $2.02 | 5d | 1 | 0.87mi |
| 900 Taney Ave Frederick, MD | 2.0 | 1.0 | 900 | $1,570 | $1.74 | 45d | 1 | 0.88mi |
| 815 Aztec Dr Unit B Frederick, MD | 3.0 | 1.0 | 1100 | $2,300 | $2.09 | 45d | 1 | 0.97mi |
| 1418 Taney Ave Frederick, MD | 1.0–3.0 | 1.0–2.0 | 851 | $2,194 | $2.58 | 5d | 9 | 1.02mi |
| 1418 A Taney Ave Frederick, MD | 1.0–3.0 | 1.0–1.5 | 1162 | $2,394 | $2.06 | 1d | 7 | 1.03mi |
| 100 Alessandra Ct Frederick, MD | 1.0–3.0 | 1.0–2.0 | 932 | $2,526 | $2.71 | 0d | 22 | 1.12mi |
| 1601 Pinder St Frederick, MD | 1.0–3.0 | 1.0–2.0 | 1134 | $3,485 | $3.07 | 0d | 25 | 1.15mi |
| 1707 N Market St Frederick, MD | 1.0–2.0 | 1.0–2.0 | 1101 | $2,857 | $2.59 | 7d | 11 | 1.23mi |
| 302 Baughmans Ln Unit M Frederick, MD | 2.0 | 2.0 | 1100 | $2,000 | $1.82 | 24d | 1 | 1.30mi |
| 349 Prospect Blvd Frederick, MD | 1.0–3.0 | 1.0–2.0 | 951 | $2,879 | $3.03 | 1d | 17 | 1.31mi |
| 360 Prospect Blvd Frederick, MD | 1.0–2.0 | 1.0–2.0 | 797 | $1,758 | $2.21 | 45d | 1 | 1.36mi |
| 808 Stratford Way Unit D Frederick, MD | 2.0 | 1.0 | 963 | $1,800 | $1.87 | 45d | 1 | 1.41mi |
| 812 Stratford Way Unit J Frederick, MD | 2.0 | 2.0 | 1000 | $1,750 | $1.75 | 26d | 1 | 1.46mi |
| 700 Heather Ridge Dr Unit 13M Frederick, MD | 2.0 | 1.0 | 950 | $1,700 | $1.79 | 26d | 1 | 1.47mi |
| 830 Heather Ridge Dr Frederick, MD | 2.0 | 1.0 | 980 | $1,600 | $1.63 | 45d | 1 | 1.47mi |
| 830 Heather Ridge Dr Unit 22C Frederick, MD | 2.0 | 1.0 | 980 | $1,600 | $1.63 | 45d | 1 | 1.47mi |
Listing history 28 events
-
2026-06-21days on market $285,000 Active 39 DOM
-
2026-06-18days on market $285,000 Active 36 DOM
-
2026-06-17days on market $285,000 Active 35 DOM
-
2026-06-16days on market $285,000 Active 34 DOM
-
2026-06-15days on market $285,000 Active 33 DOM
-
2026-06-13days on market $285,000 Active 31 DOM
-
2026-06-13days on market $285,000 Active 30 DOM
-
2026-06-09days on market $285,000 Active 27 DOM
-
2026-06-08days on market $285,000 Active 26 DOM
-
2026-06-07days on market $285,000 Active 25 DOM
-
2026-06-04days on market $285,000 Active 22 DOM
-
2026-06-03days on market $285,000 Active 21 DOM
-
2026-06-02days on market $285,000 Active 20 DOM
-
2026-06-01days on market $285,000 Active 19 DOM
-
2026-05-31days on market $285,000 Active 18 DOM
-
2026-05-13$285,000 Active 1039-char remark
-
2013-04-26historical
-
2013-04-26historical
-
2012-12-04Active
-
2012-12-04$115,000
-
2000-03-30soldstatus $49,000
-
2000-03-20soldstatus $49,000
-
2000-02-25historical
-
1998-02-19$54,900
-
1997-12-02historical
-
1997-06-11
-
1987-06-08soldstatus $53,000
-
1982-11-22soldstatus $18,000
ⓘ Source: listings_history table (triggers on properties + properties_extension) + one-shot
backfill from property_details.listing_events for pre-trigger history.
Tax reassessment forecast MD · Partial reset (capped growth)
- Current annual tax
- $3,809 · $317/mo
- Projected year-2 tax
- $3,809 · $317/mo
- Expected delta
- $0/yr ($0/mo · 0.0%)
ⓘ Screening estimate from a state-policy table — verify with the county assessor before closing.
Climate risk First Street
- Flood 1/10 Low FEMA zone X (unshaded) · 0% chance over 30 yrs
- Wildfire 1/10 Low
- Heat 6/10 Major 7 d/yr ≥106°F today · 16 d/yr by 30 yrs out
- Wind 3/10 Moderate 6% chance of damaging wind over 30 yrs
- Air quality 2/10 Low 1 unhealthy d/yr today · 2 by 30 yrs out
Nearby sold comps map
Loading sold comps map…
Walkable amenities ~0.75 mi
Loading nearby amenities…
Taxation est. · year 1
- Rental income
- $27,522
- − Mortgage interest
- −$15,964
- − Property taxes
- −$3,809
- − Insurance
- −$1,425
- − Repairs & maintenance
- −$2,202
- − Management
- −$2,202
- − Depreciation
- −$8,291
- Taxable loss
- −$6,371
- Est. tax savings @ 24.0%
- +$1,529
- After-tax cash flow
- $102/yr
For passive investors: Depreciation is non-cash, so a rental often shows a tax loss while cash-flowing — sheltering income. Rental losses are passive: they offset passive income freely, and up to $25,000/yr can offset ordinary (W-2) income if you actively participate and your MAGI is under $100k (phasing out to $0 by $150k); unused losses carry forward. On sale, claimed depreciation is recaptured at up to 25%, and gains may owe capital-gains tax (a 1031 exchange can defer both). Figures are a year-1 estimate at your 24.0% rate — not tax advice; consult a CPA.
Schools (NCES district)
- District
- Frederick County Public Schools
- NCES district ID
- 2400330
- Math proficiency
- 27% ▼ -23.00%
- Reading proficiency
- 43% ▼ -15.00%
- Median HH income
- $84,020
- Composite
- 33.54/100
- National rank
- #5429
- State rank
- #4 of 24 in MD
Livability — Frederick
- Score
- 77/100
- State rank
- #80
- US rank
- #3041
Category grades
Schools grade is shown separately in the Schools card above.
Census & demographics
- Census place
- Frederick, MD
- County
- Frederick County · 171,753 people
- City population
- 154,619
- Metro
- Washington-Arlington-Alexandria, DC-VA-MD-WV
- Population (ZIP)
- 43,048
- Household income
- $106,577
- Rent vs Own
- Severe rent burden
- 1440.0
Population outlook (Frederick County) Hauer SSP2
- Today (2025)
- 269,438 people
- By 2030
- 280,160 · +4.0%
- By 2040
- 298,408 · +10.8%
- By 2050
- 311,062 · +15.4%
- By 2075
- 342,819 · +27.2%
- By 2100
- 351,361 · +30.4%
Race, ethnicity, and origin ACS 2023
- Neighborhood character
- Predominantly White (71%)
- Race & ethnicity
- White 71% Black 12% Two or more races 9% Hispanic / Latino 8% Asian 3%
- Hispanic origin (detail)
- Mexican 2% Puerto Rican 1%
- Common ancestry
- Romanian 4% Lithuanian 3% Slovak 3%
- Foreign-born
- 10% · Canada, China, Vietnam
- Languages at home
- 88% English-only · Spanish 6% Other Indo-European 2% Chinese 1%
Political lean MEDSL · Frederick
- 2024 margin
- Lean D (+8.8) · D 53.2% · R 44.4% · Other 2.5%
- 2008→2024 swing
- +9.9pp toward D · 2008: -1.0pp · 2024: 8.8pp
- All cycles
- 2024: D+8.8 2020: D+9.6 2016: R+4.0 2012: R+3.9 2008: R+1.0
Not yet ingested
- Civics
- —
Market trends
- HPI YoY
- ▼ -260.35%
- Current HPI
- 276.5028
- Rent YoY
- ▲ 0.82%
- Metro
- Washington-Arlington-Alexandria, DC-VA-MD-WV
- State GDP YoY
- ▲ 2.97%
- F500 in state
- 12
Industry mix (Fortune 500 HQ in MD)
| Industry | F500 HQs | Revenue |
|---|---|---|
| Aerospace / Defense | 1 | $71B |
|
||
| Utilities | 1 | $25B |
|
||
| Hotels | 1 | $24B |
|
||
| Consumer Goods | 1 | $7B |
|
||
| Real Estate | 1 | $6B |
|
||
| Chemicals | 1 | $2B |
|
||
Price history
+1483.3% since first listed13 events — show timeline
- 2026-05-13 Listed $285,000 BRIGHT MLS
- 2013-04-26 Delisted — MRIS
- 2013-04-26 Listing Removed — BRIGHT MLS
- 2012-12-04 Listed — MRIS
- 2012-12-04 Listed $115,000 BRIGHT MLS
- 2000-03-30 Sold (Public Records) $49,000 Public Records
- 2000-03-20 Sold (MLS) $49,000 MRIS
- 2000-02-25 Delisted — MRIS
- 1998-02-19 Listed $54,900 MRIS
- 1997-12-02 Delisted — MRIS
- 1997-06-11 Listed — MRIS
- 1987-06-08 Sold (Public Records) $53,000 Public Records
- 1982-11-22 Sold (Public Records) $18,000 Public Records
Property tax history
+4.2%/yrLatest (2025): $3,809 · +7.8% YoY. Source: county tax records.
Cash-flow waterfall
monthlySold comps — $/sqft
last 12 mo · ≤1 miLoading sold comps…