206 N Riverside Dr · Truth or Consequences, NM
Flood risk 10/10 · Severe
- FEMA flood zone
- AE
- Chance of flooding over 30 yrs
- 0.99%
- Est. flood insurance / yr
- $1,737 – $8,500
Fire risk 5/10 · Moderate
- Est. fire insurance / yr
- $706 – $1,312
Heat risk 6/10 · Moderate
- Hot days now (above 97°F)
- 7 days/yr
- Hot days in 30 yrs
- 24 days/yr
Wind risk 1/10 · Minimal
- Chance of severe wind over 30 yrs
- —
Air-quality risk 1/10 · Minimal
- Unhealthy air days now
- 0 days/yr
- Unhealthy air days in 30 yrs
- 0 days/yr
Risk factors via First Street. Map © Google.
Why this score? — see what drove the B- grade
The composite is a weighted blend of 9 inputs, each scored 0–100. Each bar is that input's sub-score; the figure is the points it added to the 100-point composite (weight × sub-score).
- Cash flow +30.0/30.0
- 1% rule +10.0/10.0
- DSCR +10.0/10.0
- ARV discount +7.5/15.0
- Livability +3.2/5.0
- Rent growth +2.5/5.0
- Condition / age +2.5/5.0
- Schools +2.0/10.0
- Appreciation +0.4/10.0
$45,000
🖨 Deal sheet 📄 Offer letter ✓ Due diligence
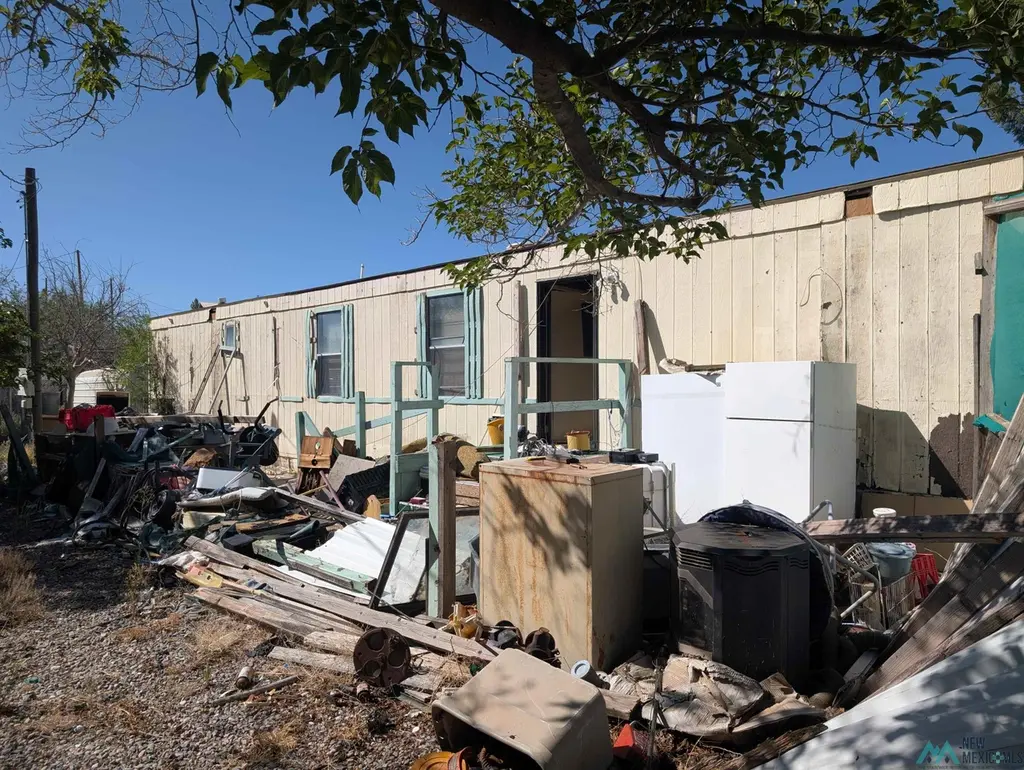
Listing remarks
Opportunity awaits with this fully fenced . 20-acre property featuring a mobile home ready for renovation or replacement. The lot includes a carport and storage shed, offering added functionality and space for tools, equipment, or hobbies. With utilities already in place and plenty of potential, this property could make a great investment, fixer-upper project, or future homesite. Bring your vision and transform this property into something special!
Key facts
- Fully fenced
- Mobile home
- Utilities in place
Tags
Property features AI
Finance
- Financial info: Annual tax amount listed
Exterior
- Parking: Detached carport; 2 covered parking spaces; 2 total parking spaces; 2-car garage
- Home design: Manufactured home; Residential property
- Construction: Manufactured house
- Exterior features: Lot is approximately 0.2 acres (8,712 sq ft)
Interior
- Bathrooms: 1 full bathroom
- Heating & cooling: No heating
- Interior features: No central heating listed
Neighborhood map
What this means for you Summary
Snapshot
- This is a 2-bed/1.0-bath other listed at $45k.
Deal economics
- At list price, monthly cash flow is $73 ($879/yr) — positive.
- The deal already cash-flows at list — no discount required.
- Meets the 1% rule at list price ($1k rent vs $45k).
- Recommended offer: $44k (1.5% below list) — sets the bar for market timing.
Location & tenants
- Location reads 65/100 on livability (#60 in NM) — a middle-class / working-renter tenant base. Strengths: cost of living A+, housing A, health & safety A; Watch: schools F, crime F, commute F.
- T Or C Municipal Schools (town): math 25% / reading 25% proficiency, ranked #29 of 29 in NM (top 100%) — low school quality limits family demand, transient renter base, plan for 1-2y turnover; 70% free/reduced lunch — lower-income household profile, screen leases tightly.
- Market conditions: 104 active listings in the ZIP.
Forward outlook
- Local home prices are declining (-3.0%/yr); year-one equity from $311 of loan paydown is wiped out by about $1k of value loss. Plan a longer hold.
- Sierra County population projected at -38% by 2050 — secular population decline; favor cash flow + early exit over multi-decade hold.
Negotiation context
- It's been on market 19 days — a 2% lower offer ($44k) is reasonable based on typical stale-listing flexibility.
Risks & watch-outs
- Watch-outs: flood insurance adds $427/mo.
- Climate carrying-cost: in FEMA flood zone AE (mandatory federal flood insurance); moderate wildfire risk; extreme-heat days projected 7→24/yr by 2055 (HVAC capex compounding) — expect insurance premiums to compound above CPI over the hold.
Questions for the listing agent
- What's the actual annual flood-insurance premium (NFIP or private), and is the property in a SFHA with mandatory coverage?
- Is there a deadline driving the sale (1031 exchange, divorce, estate, relocation)? That informs how much negotiation room exists.
- Schools are F-rated, which usually means shorter tenancies and higher turnover. Who's the typical renter profile here, and what's been the actual vacancy rate?
- Crime grade is F in this area — have there been break-ins, vandalism, or insurance claims at this property in the last 3 years? What carrier currently insures it and at what premium?
- What's the average days-on-market for RENTAL listings here right now (not sales)? A rising rental-DOM trend means longer vacancies and softer asking-rent achievability than the comps imply.
- What's the recent tenant-quality profile in this submarket — average credit score on applications, eviction rate, late-payment / NSF rate, and stable-employment percentage? A property-management company in the area should have these aggregated.
- How much new for-sale + rental construction is in the pipeline within 1–3 miles? Heavy new supply typically softens prices + rents 12–24 months out; constrained supply supports both.
Investment metrics
- 1% rule
- 2.28% ✓
- Cap rate
- 19.62%
- Cash-on-cash
- 47.60%
- DSCR
- 3.12
- GRM
- 3.7
CMA / ARV
No comps found within radius.
Projected returns pro-forma
-3.0% appreciation · 3.0% rent growth · sell at horizon
- IRR
- -5.0%
- Equity multiple
- 0.81×
- Total profit
- $-2,351
- Equity at exit
- $6,710
- IRR
- 5.3%
- Equity multiple
- 1.40×
- Total profit
- $5,084
- Equity at exit
- $3,891
Cash invested: $12,600 (down + closing). Projections, not guarantees.
Landlord ↔ Tenant lean methodology
- Overall (STATE)
- 55 Moderately Landlord-Leaning
- State New Mexico
- 55 Moderately Landlord-Leaning · D+3
- County
- — inherits STATE
- City
- — inherits STATE
ZIP-level market 87935
- Home prices YoY
- -6.1%
- Active inventory
- 104
- Price-to-rent
- 3.7×
Monthly cashflow live
- Estimated rent
- $1,026 medium interval (Pro) →
- Mortgage (P&I)
- −$236
- Tax est. 1.5%
- −$56 /mo · $675/yr
- Insurance
- −$19
- Flood insurance flood zone
- −$427 /mo · $5,118/yr
- HOA
- −$0
- Vacancy / Maint / Mgmt
- −$216
- Net cashflow
- $73
Break-even live
UW: 25.0% down · 7.5% · 30yr · 1.5% tax · 5.0% vac · 8.0% maint · 8.0% mgmt
Financing live
Cash to close
- Down payment
- $11,250
- Closing costs
- $1,350
- Reserves months
- —
- Total cash needed
- —
Loan-product check · same deal, 3 products live
Conventional
25% down · 7.5% · 30yr
- Down + closing
- —
- Monthly P&I
- —
- Monthly cashflow
- —
- DSCR
- —
- Eligible?
- —
Personal DTI + credit; lowest rate.
DSCR
20% down · 8.5% · 30yr
- Down + closing
- —
- Monthly P&I
- —
- Monthly cashflow
- —
- DSCR
- —
- Eligible?
- —
No personal income docs; deal must DSCR.
Hard money
10% down · 12.0% · 12mo
- Down + closing
- —
- Monthly P&I
- —
- Monthly cashflow
- —
- DSCR
- —
- Eligible?
- —
Short-term bridge; refi at stabilization.
Listing history 14 events
-
2026-06-18days on market $45,000 Active 19 DOM
-
2026-06-17days on market $45,000 Active 18 DOM
-
2026-06-16days on market $45,000 Active 17 DOM
-
2026-06-15days on market $45,000 Active 16 DOM
-
2026-06-14days on market $45,000 Active 14 DOM
-
2026-06-13days on market $45,000 Active 13 DOM
-
2026-06-10days on market $45,000 Active 11 DOM
-
2026-06-09days on market $45,000 Active 10 DOM
-
2026-06-08days on market $45,000 Active 9 DOM
-
2026-06-07days on market $45,000 Active 8 DOM
-
2026-06-02days on market $45,000 Active 3 DOM
-
2026-06-01days on market $45,000 Active 2 DOM
-
2026-05-30remarks 452-char remark
-
2026-05-30$45,000 Active 1 DOM
ⓘ Source: listings_history table (triggers on properties + properties_extension) + one-shot
backfill from property_details.listing_events for pre-trigger history.
Climate risk First Street
- Flood 10/10 Extreme FEMA zone AE · 99% chance over 30 yrs
- Wildfire 5/10 Major
- Heat 6/10 Major 7 d/yr ≥97°F today · 24 d/yr by 30 yrs out
- Wind 1/10 Low
- Air quality 1/10 Low 0 unhealthy d/yr today · 0 by 30 yrs out
Nearby sold comps map
Loading sold comps map…
Walkable amenities ~0.75 mi
Loading nearby amenities…
Taxation est. · year 1
- Rental income
- $12,315
- − Mortgage interest
- −$2,521
- − Property taxes
- −$675
- − Insurance
- −$5,344
- − Repairs & maintenance
- −$985
- − Management
- −$985
- − Depreciation
- −$1,309
- Taxable income
- $496
- Est. tax owed @ 24.0%
- −$119
- After-tax cash flow
- $759/yr
For passive investors: Depreciation is non-cash, so a rental often shows a tax loss while cash-flowing — sheltering income. Rental losses are passive: they offset passive income freely, and up to $25,000/yr can offset ordinary (W-2) income if you actively participate and your MAGI is under $100k (phasing out to $0 by $150k); unused losses carry forward. On sale, claimed depreciation is recaptured at up to 25%, and gains may owe capital-gains tax (a 1031 exchange can defer both). Figures are a year-1 estimate at your 24.0% rate — not tax advice; consult a CPA.
Schools (NCES district)
- District
- T Or C Municipal Schools
- NCES district ID
- 3502610
- Math proficiency
- 25% ▲ 1.00%
- Reading proficiency
- 25% ▼ -7.00%
- Median HH income
- $28,449
- Composite
- 20.0/100
- National rank
- #8666
- State rank
- #29 of 29 in NM
Livability — Truth or Consequences
- Score
- 65/100
- State rank
- #60
- US rank
- #13470
Category grades
Schools grade is shown separately in the Schools card above.
Census & demographics
- Census place
- Truth or Consequences, NM
- Population (ZIP)
- 1,848
Population outlook (Sierra County) Hauer SSP2
- Today (2025)
- 9,498 people
- By 2030
- 8,580 · -9.7%
- By 2040
- 6,994 · -26.4%
- By 2050
- 5,914 · -37.7%
- By 2075
- 4,083 · -57.0%
- By 2100
- 2,499 · -73.7%
Race, ethnicity, and origin ACS 2023
- Neighborhood character
- Predominantly White (80%)
- Race & ethnicity
- White 80% Hispanic / Latino 15% Two or more races 13%
- Hispanic origin (detail)
- Mexican 5%
- Common ancestry
- Serbian 2% Portuguese 1% Slovak 1%
- Foreign-born
- 2%
- Languages at home
- 89% English-only · Spanish 10% Tagalog/Filipino 1% German/W. Germanic 1%
Political lean MEDSL · Sierra
- 2024 margin
- R (+19.2) · D 39.2% · R 58.3% · Other 2.5%
- 2008→2024 swing
- -7.1pp toward R · 2008: -12.1pp · 2024: -19.2pp
- All cycles
- 2024: R+19.2 2020: R+21.5 2016: R+27.2 2012: R+18.9 2008: R+12.1
Not yet ingested
- Civics
- —
Market trends
- HPI YoY
- ▼ -9.28%
- Current HPI
- 143.564
- Rent YoY
- —
- Metro
- —
- State GDP YoY
- —
- F500 in state
- 0
Price history
1 event — show timeline
- 2026-05-30 Listed $45,000 NMMLS
Property tax history
+3.3%/yrLatest (2025): $69 · +0.8% YoY. Source: county tax records.
Cash-flow waterfall
monthlySold comps — $/sqft
last 12 mo · ≤1 miLoading sold comps…