 Triplex
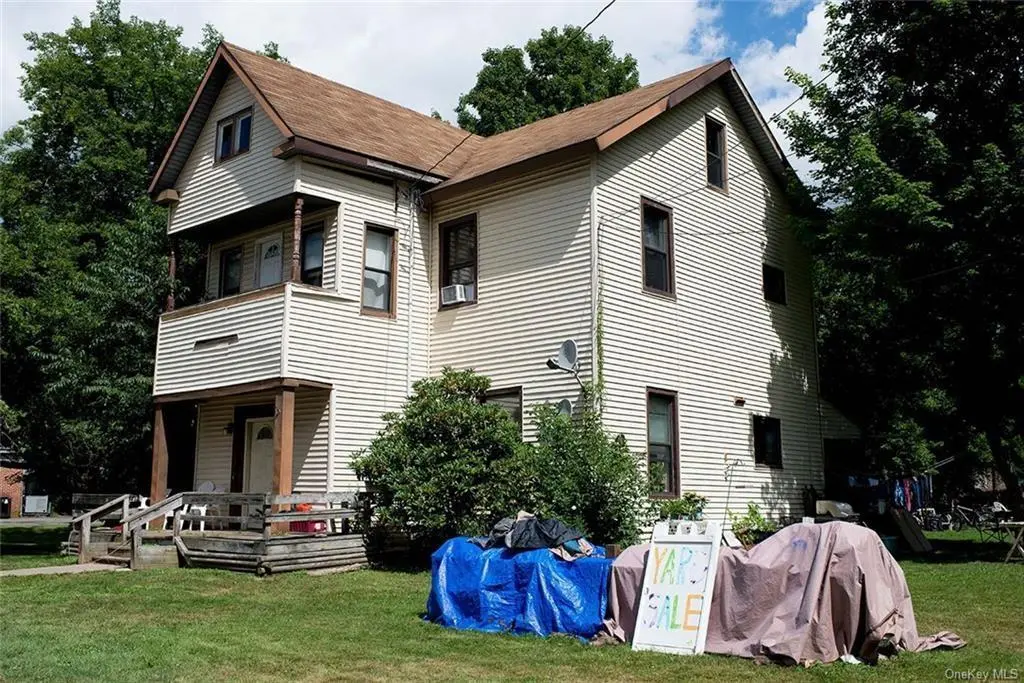
15 Pearl St · Livingston Manor, NY
Flood risk 6/10 · Moderate
- FEMA flood zone
- AE
- Chance of flooding over 30 yrs
- 0.74%
- Est. flood insurance / yr
- $1,737 – $8,500
Fire risk 1/10 · Minimal
- Est. fire insurance / yr
- $691 – $1,283
Heat risk 2/10 · Minimal
- Hot days now (above 89°F)
- 8 days/yr
- Hot days in 30 yrs
- 19 days/yr
Wind risk 2/10 · Minimal
- Chance of severe wind over 30 yrs
- 2.0%
Air-quality risk 2/10 · Minimal
- Unhealthy air days now
- 0 days/yr
- Unhealthy air days in 30 yrs
- 1 days/yr
Risk factors via First Street. Map © Google.
Why this score? — see what drove the A grade
The composite is a weighted blend of 9 inputs, each scored 0–100. Each bar is that input's sub-score; the figure is the points it added to the 100-point composite (weight × sub-score).
- Cash flow +30.0/30.0
- ARV discount +13.8/15.0
- 1% rule +10.0/10.0
- DSCR +10.0/10.0
- Appreciation +10.0/10.0
- Schools +4.5/10.0
- Rent growth +2.5/5.0
- Livability +2.5/5.0
- Condition / age +2.5/5.0
$294,500
🖨 Deal sheet 📄 Offer letter ✓ Due diligence
Multi-family units
County records classify this as Multi-Family (2-4 Unit). Listing-text estimate: 3 units. confirmed
Listing remarks MLS
Three family money maker located in the highly desired up-and-coming Livingston Manor area with an additional lot for sale as well to the left of the house. Spacious two-bedroom apartment on the first floor, two additional one-bedroom apartments, and a detached two-car garage. Lots of great restaurants and shops close by. Don't wait, or you will miss out on this opportunity. Additional Information: HeatingFuel:Oil Above Ground,ParkingFeatures:2 Car Detached,
Key facts
- 8,455 sq ft lot
- 2 parking spots
- Built 1930
Neighborhood map
What this means for you Summary
Snapshot
- This is a 1×2bd/1ba + 2×1bd/1ba units multifamily listed at $294k.
Deal economics
- At list price, monthly cash flow is $1k ($16k/yr) — positive. Per door: $454/mo.
- The deal already cash-flows at list — no discount required.
- Meets the 1% rule at list price ($5k rent vs $294k).
- Recommended offer: $259k (12.0% below list) — sets the bar for market timing.
- Cap rate 13.6% vs local median 3.0% in Livingston Manor — top-decile yield for the area; either an underpriced asset or a hidden risk that comps aren't pricing in. Stress-test before assuming the spread holds.
Location & tenants
- Location reads 50/100 on livability (#1,173 in NY) — a working-class tenant base; expect higher turnover. Strengths: crime A; Watch: schools D, amenities F, commute F.
- Livingston Manor Central School District (rural): math 55% / reading 45% proficiency, ranked #456 of 755 in NY (top 60%) — acceptable for families but not a draw, mixed tenant base, ~2y average lease.
- Market conditions: 81 active listings in the ZIP; 739 units permitted in Sullivan County in 2024 (5 in 5+ unit buildings).
Forward outlook
- In year one you build about $31k of equity ($2k loan paydown + $29k appreciation (10.0% local appreciation)).
- Sullivan County population projected at -24% by 2050 — secular population decline; favor cash flow + early exit over multi-decade hold.
- At projected returns (10.0% appreciation + 3.0% rent growth), your $82k cash investment doubles in ~2 years — after that, you're playing with house money.
- By year 2, paydown + projected appreciation supports a ~$51k cash-out refi (75% LTV) — recoverable capital for the next deal without selling this one.
Negotiation context
- It's been on market 864 days — a 12% lower offer ($259k) is reasonable based on typical stale-listing flexibility.
- 8 sale attempts since 15y ago with the ask held roughly flat each time — persistent listings suggest the price (not the market) is what's stuck; bring a comps-based counter.
- Current owner paid $150k; list at $294k implies a 96% gain — meaningful room to come down on a strong offer.
Risks & watch-outs
- Watch-outs: flood insurance adds $427/mo; built in 1930 — expect roof / HVAC / electrical / plumbing capex.
- Climate carrying-cost: in FEMA flood zone AE (mandatory federal flood insurance) — expect insurance premiums to compound above CPI over the hold.
Questions for the listing agent
- It's been on market 864 days. Have you received any prior offers? Is the seller open to a 12% concession, seller financing, or rate buy-down credit?
- Can we see the unit-by-unit rent roll, current vacancy, and any below-market leases? What's the average tenancy length?
- What capital expenditures (roof, boiler, parking lot, exteriors) have been made in the last 5 years, and what's planned in the next 2?
- Built in 1930 — when were the roof, HVAC, electrical panel, plumbing, and water heater last replaced?
- What's the actual annual flood-insurance premium (NFIP or private), and is the property in a SFHA with mandatory coverage?
- Why hasn't it sold? Are there any deal-killer items the seller is aware of (foundation, flood, title, zoning, code violations)?
- Is there a deadline driving the sale (1031 exchange, divorce, estate, relocation)? That informs how much negotiation room exists.
- Schools are D-rated, which usually means shorter tenancies and higher turnover. Who's the typical renter profile here, and what's been the actual vacancy rate?
- What's the average days-on-market for RENTAL listings here right now (not sales)? A rising rental-DOM trend means longer vacancies and softer asking-rent achievability than the comps imply.
- What's the recent tenant-quality profile in this submarket — average credit score on applications, eviction rate, late-payment / NSF rate, and stable-employment percentage? A property-management company in the area should have these aggregated.
- How much new apartment / multifamily construction is in the pipeline within 1–3 miles? Heavy new supply (>2% of stock underway) typically softens rents 12–24 months out; light construction supports rent growth.
Investment metrics
- 1% rule
- 1.69% ✓
- Cap rate
- 13.58%
- Cash-on-cash
- 26.04%
- DSCR
- 2.16
- GRM
- 4.9
CMA / ARV
- ARV (median comp)
- $342,549
- List price
- $294,500
- Delta
- -14.03%
- Verdict
- UNDERPRICED
- Comps
- 2 within 1.0 mi
Projected returns pro-forma
10.0% appreciation · 3.0% rent growth · sell at horizon
- IRR
- 39.1%
- Equity multiple
- 4.00×
- Total profit
- $247,602
- Equity at exit
- $265,309
- IRR
- 33.7%
- Equity multiple
- 9.02×
- Total profit
- $661,672
- Equity at exit
- $572,149
Cash invested: $82,460 (down + closing). Projections, not guarantees.
Landlord ↔ Tenant lean methodology
- Overall (STATE)
- 15 Strongly Tenant-Friendly
- State New York
- 15 Strongly Tenant-Friendly · D+10
- County
- — inherits STATE
- City
- — inherits STATE
ZIP-level market 12758
- Home prices YoY
- 15.4%
- Active inventory
- 81
- Price-to-rent
- 14.8×
Monthly cashflow live
- Estimated rent
- $4,968 medium interval (Pro) →
- Mortgage (P&I)
- −$1,544
- Tax from tax record
- −$468 /mo · $5,617/yr
- Insurance
- −$123
- Flood insurance flood zone
- −$427 /mo · $5,118/yr
- HOA
- −$0
- Vacancy / Maint / Mgmt
- −$1,043
- Net cashflow
- $1,363
Break-even live
3-unit breakdown (identical units grouped — click to expand)
| Units | Beds | Baths | Est. rent |
|---|---|---|---|
| 1× unit | 2 | 1 | $1,656 |
| 2× units | 1 | 1 | $3,312 |
| #2 | 1 | 1 | $1,656 |
| #3 | 1 | 1 | $1,656 |
| Total (3 units) | $4,968 | ||
UW: 25.0% down · 7.5% · 30yr · 1.5% tax · 5.0% vac · 8.0% maint · 8.0% mgmt
Financing live
Cash to close
- Down payment
- $73,625
- Closing costs
- $8,835
- Reserves months
- —
- Total cash needed
- —
Loan-product check · same deal, 3 products live
Conventional
25% down · 7.5% · 30yr
- Down + closing
- —
- Monthly P&I
- —
- Monthly cashflow
- —
- DSCR
- —
- Eligible?
- —
Personal DTI + credit; lowest rate.
DSCR
20% down · 8.5% · 30yr
- Down + closing
- —
- Monthly P&I
- —
- Monthly cashflow
- —
- DSCR
- —
- Eligible?
- —
No personal income docs; deal must DSCR.
Hard money
10% down · 12.0% · 12mo
- Down + closing
- —
- Monthly P&I
- —
- Monthly cashflow
- —
- DSCR
- —
- Eligible?
- —
Short-term bridge; refi at stabilization.
Listing history 35 events
-
2026-06-18days on market $294,500 Active 864 DOM
-
2026-06-17days on market $294,500 Active 863 DOM
-
2026-06-16days on market $294,500 Active 862 DOM
-
2026-06-15days on market $294,500 Active 861 DOM
-
2026-06-13days on market $294,500 Active 859 DOM
-
2026-06-12days on market $294,500 Active 858 DOM
-
2026-06-09days on market $294,500 Active 855 DOM
-
2026-06-08days on market $294,500 Active 854 DOM
-
2026-06-07days on market $294,500 Active 853 DOM
-
2026-06-07days on market $294,500 Active 852 DOM
-
2026-06-04days on market $294,500 Active 849 DOM
-
2026-06-03days on market $294,500 Active 848 DOM
-
2026-06-01days on market $294,500 Active 847 DOM
-
2026-05-31days on market $294,500 Active 846 DOM
-
2025-03-31status Active 462-char remark
Show marketing remark (462 chars)
Three family money maker located in the highly desired up-and-coming Livingston Manor area with an additional lot for sale as well to the left of the house. Spacious two-bedroom apartment on the first floor, two additional one-bedroom apartments, and a detached two-car garage. Lots of great restaurants and shops close by. Don't wait, or you will miss out on this opportunity. Additional Information: HeatingFuel:Oil Above Ground,ParkingFeatures:2 Car Detached,
-
2025-03-16historical 462-char remark
Show marketing remark (462 chars)
Three family money maker located in the highly desired up-and-coming Livingston Manor area with an additional lot for sale as well to the left of the house. Spacious two-bedroom apartment on the first floor, two additional one-bedroom apartments, and a detached two-car garage. Lots of great restaurants and shops close by. Don't wait, or you will miss out on this opportunity. Additional Information: HeatingFuel:Oil Above Ground,ParkingFeatures:2 Car Detached,
-
2024-08-20status Active 462-char remark
Show marketing remark (462 chars)
Three family money maker located in the highly desired up-and-coming Livingston Manor area with an additional lot for sale as well to the left of the house. Spacious two-bedroom apartment on the first floor, two additional one-bedroom apartments, and a detached two-car garage. Lots of great restaurants and shops close by. Don't wait, or you will miss out on this opportunity. Additional Information: HeatingFuel:Oil Above Ground,ParkingFeatures:2 Car Detached,
-
2024-08-04historical 462-char remark
Show marketing remark (462 chars)
Three family money maker located in the highly desired up-and-coming Livingston Manor area with an additional lot for sale as well to the left of the house. Spacious two-bedroom apartment on the first floor, two additional one-bedroom apartments, and a detached two-car garage. Lots of great restaurants and shops close by. Don't wait, or you will miss out on this opportunity. Additional Information: HeatingFuel:Oil Above Ground,ParkingFeatures:2 Car Detached,
-
2024-01-05$294,500 Active 462-char remark
Show marketing remark (462 chars)
Three family money maker located in the highly desired up-and-coming Livingston Manor area with an additional lot for sale as well to the left of the house. Spacious two-bedroom apartment on the first floor, two additional one-bedroom apartments, and a detached two-car garage. Lots of great restaurants and shops close by. Don't wait, or you will miss out on this opportunity. Additional Information: HeatingFuel:Oil Above Ground,ParkingFeatures:2 Car Detached,
-
2023-08-01historical
-
2023-01-29status Active
-
2023-01-29price $295,000
-
2022-12-31historical
-
2022-08-09$300,000 Active
-
2019-12-19soldstatus $150,000
-
2019-03-01historical
-
2019-01-30price $59,999
-
2018-11-07status Active
-
2018-11-01historical
-
2018-09-12price $79,950
-
2018-05-09$109,000 Active
-
2012-10-30historical
-
2011-05-03
-
2003-07-18soldstatus $75,000
-
1987-10-29soldstatus $62,000
ⓘ Source: listings_history table (triggers on properties + properties_extension) + one-shot
backfill from property_details.listing_events for pre-trigger history.
Tax reassessment forecast NY · Partial reset (capped growth)
- Current annual tax
- $5,617 · $468/mo
- Projected year-2 tax
- $5,617 · $468/mo
- Expected delta
- $0/yr ($0/mo · 0.0%)
ⓘ Screening estimate from a state-policy table — verify with the county assessor before closing.
Climate risk First Street
- Flood 6/10 Major FEMA zone AE · 74% chance over 30 yrs
- Wildfire 1/10 Low
- Heat 2/10 Low 8 d/yr ≥89°F today · 19 d/yr by 30 yrs out
- Wind 2/10 Low 2% chance of damaging wind over 30 yrs
- Air quality 2/10 Low 0 unhealthy d/yr today · 1 by 30 yrs out
Nearby sold comps map
Loading sold comps map…
Walkable amenities ~0.75 mi
Loading nearby amenities…
Taxation est. · year 1
- Rental income
- $59,616
- − Mortgage interest
- −$16,497
- − Property taxes
- −$5,617
- − Insurance
- −$6,591
- − Repairs & maintenance
- −$4,769
- − Management
- −$4,769
- − Depreciation
- −$8,567
- Taxable income
- $12,806
- Est. tax owed @ 24.0%
- −$3,073
- After-tax cash flow
- $13,283/yr
For passive investors: Depreciation is non-cash, so a rental often shows a tax loss while cash-flowing — sheltering income. Rental losses are passive: they offset passive income freely, and up to $25,000/yr can offset ordinary (W-2) income if you actively participate and your MAGI is under $100k (phasing out to $0 by $150k); unused losses carry forward. On sale, claimed depreciation is recaptured at up to 25%, and gains may owe capital-gains tax (a 1031 exchange can defer both). Figures are a year-1 estimate at your 24.0% rate — not tax advice; consult a CPA.
Schools (NCES district)
- District
- Livingston Manor Central School District
- NCES district ID
- 3617580
- Math proficiency
- 55% ▲ 5.00%
- Reading proficiency
- 45% ▬ 0.00%
- Median HH income
- $51,401
- Composite
- 44.96/100
- National rank
- #5872
- State rank
- #456 of 755 in NY
Livability — Livingston Manor
- Score
- 50/100
- State rank
- #1173
- US rank
- #25609
Category grades
Schools grade is shown separately in the Schools card above.
Census & demographics
- Census place
- Livingston Manor, NY
- Population (ZIP)
- 4,061
Population outlook (Sullivan County) Hauer SSP2
- Today (2025)
- 68,974 people
- By 2030
- 65,609 · -4.9%
- By 2040
- 58,878 · -14.6%
- By 2050
- 52,500 · -23.9%
- By 2075
- 39,941 · -42.1%
- By 2100
- 28,880 · -58.1%
Race, ethnicity, and origin ACS 2023
- Neighborhood character
- Predominantly White (85%)
- Race & ethnicity
- White 85% Two or more races 8% Hispanic / Latino 7% Asian 3%
- Hispanic origin (detail)
- Puerto Rican 3%
- Common ancestry
- Danish 4% Subsaharan African 4% Lithuanian 3%
- Foreign-born
- 9% · Canada, Jamaica, South Korea
- Languages at home
- 90% English-only · Spanish 3% Other Indo-European 3% Russian/Polish/Slavic 2%
Political lean MEDSL · Sullivan
- 2024 margin
- R (+16.7) · D 41.6% · R 58.4%
- 2008→2024 swing
- -26.2pp toward R · 2008: 9.5pp · 2024: -16.7pp
- All cycles
- 2024: R+16.7 2020: R+9.2 2016: R+13.7 2012: D+10.4 2008: D+9.5
Not yet ingested
- Civics
- —
Market trends
- HPI YoY
- ▲ 59.59%
- Current HPI
- 446.6757
- Rent YoY
- —
- Metro
- —
- State GDP YoY
- ▲ 2.60%
- F500 in state
- 92
Industry mix (Fortune 500 HQ in NY)
| Industry | F500 HQs | Revenue |
|---|---|---|
| Financial Services | 10 | $950B |
|
||
| Consumer Goods | 9 | $162B |
|
||
| Insurance | 4 | $225B |
|
||
| Telecommunications | 2 | $144B |
|
||
| Pharmaceuticals | 2 | $112B |
|
||
| Media / Entertainment | 2 | $69B |
|
||
Price history
+375.0% since first listed21 events — show timeline
- 2025-03-31 Relisted — OneKey® MLS as Distributed by MLS Grid
- 2025-03-16 Listing Removed — OneKey® MLS as Distributed by MLS Grid
- 2024-08-20 Relisted — OneKey® MLS as Distributed by MLS Grid
- 2024-08-04 Listing Removed — OneKey® MLS as Distributed by MLS Grid
- 2024-01-05 Listed $294,500 OneKey® MLS as Distributed by MLS Grid
- 2023-08-01 Listing Removed — OneKey® MLS as Distributed by MLS Grid
- 2023-01-29 Relisted — OneKey® MLS as Distributed by MLS Grid
- 2023-01-29 Price Changed $295,000 OneKey® MLS as Distributed by MLS Grid
- 2022-12-31 Listing Removed — OneKey® MLS as Distributed by MLS Grid
- 2022-08-09 Listed $300,000 OneKey® MLS as Distributed by MLS Grid
- 2019-12-19 Sold (Public Records) $150,000 Public Records
- 2019-03-01 Listing Removed — OneKey® MLS as Distributed by MLS Grid
- 2019-01-30 Price Changed $59,999 OneKey® MLS as Distributed by MLS Grid
- 2018-11-07 Relisted — OneKey® MLS as Distributed by MLS Grid
- 2018-11-01 Listing Removed — OneKey® MLS as Distributed by MLS Grid
- 2018-09-12 Price Changed $79,950 OneKey® MLS as Distributed by MLS Grid
- 2018-05-09 Listed $109,000 OneKey® MLS as Distributed by MLS Grid
- 2012-10-30 Delisted — HGMLS
- 2011-05-03 Listed — HGMLS
- 2003-07-18 Sold (Public Records) $75,000 Public Records
- 1987-10-29 Sold (Public Records) $62,000 Public Records
Property tax history
+2.6%/yrLatest (2025): $5,617 · +0.4% YoY. Source: county tax records.
Cash-flow waterfall
monthlySold comps — $/sqft
last 12 mo · ≤1 miLoading sold comps…