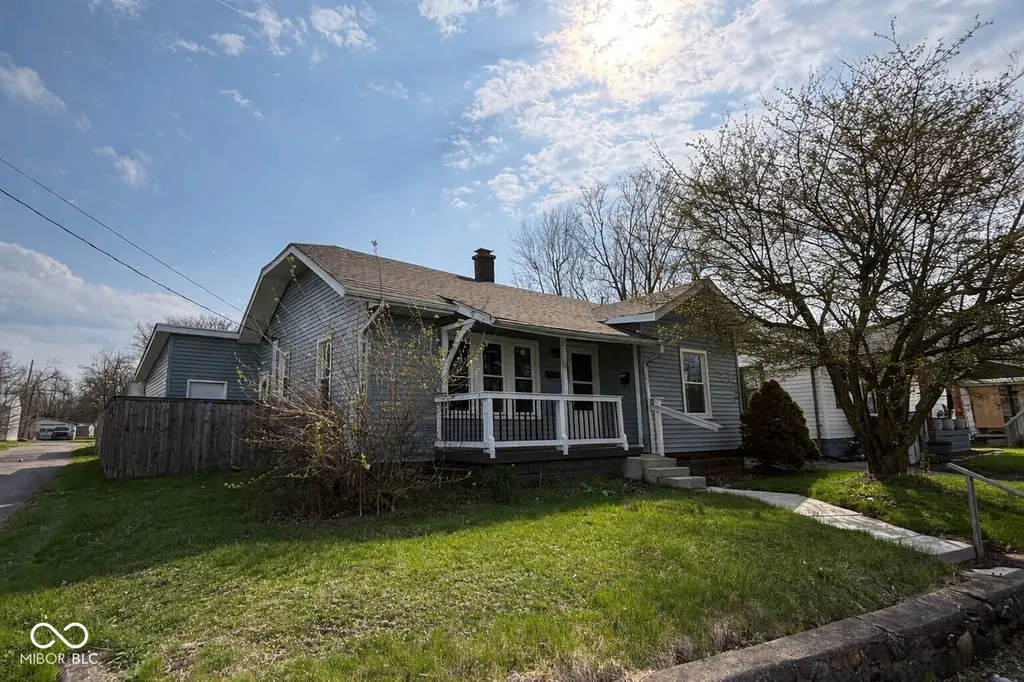
2029 Lincoln Ave · New Castle, IN
Flood risk 6/10 · Moderate
- FEMA flood zone
- X (unshaded)
- Chance of flooding over 30 yrs
- 0.68%
- Est. flood insurance / yr
- $473 – $860
Fire risk 1/10 · Minimal
- Est. fire insurance / yr
- $717 – $1,331
Heat risk 3/10 · Minor
- Hot days now (above 99°F)
- 7 days/yr
- Hot days in 30 yrs
- 18 days/yr
Wind risk 2/10 · Minimal
- Chance of severe wind over 30 yrs
- 0.0%
Air-quality risk 2/10 · Minimal
- Unhealthy air days now
- 1 days/yr
- Unhealthy air days in 30 yrs
- 2 days/yr
Risk factors via First Street. Map © Google.
Why this score? — see what drove the F grade
The composite is a weighted blend of 9 inputs, each scored 0–100. Each bar is that input's sub-score; the figure is the points it added to the 100-point composite (weight × sub-score).
- Cash flow +12.8/30.0
- DSCR +3.8/10.0
- Livability +3.8/5.0
- Rent growth +3.6/5.0
- 1% rule +3.0/10.0
- Schools +2.7/10.0
- ARV discount +2.6/15.0
- Condition / age +2.5/5.0
- Appreciation +0.0/10.0
$109,900
🖨 Deal sheet 📄 Offer letter ✓ Due diligence
Listing remarks MLS
Updated 2-bedroom home with immediate possession available! This property features numerous recent improvements including newer roof shingles, vinyl siding, vinyl replacement windows, and updated kitchen cabinets with granite countertops. Interior highlights include vinyl plank flooring throughout the main living areas and carpeted bedrooms for added comfort. The living room offers an electric fireplace, creating a warm and inviting space. The eat-in kitchen provides ample cabinet space and functionality, along with a convenient main-level laundry room. The bathroom has been tastefully updated with a claw foot tub, subway tile, and shiplap accents, blending modern updates with classic charm. Additional features include a partial basement with a 90+ high-efficiency gas furnace and central air, a one-car detached garage with built-in storage, and a partially fenced backyard. A great opportunity for owner-occupants or investors alike!
Key facts
- Vinyl siding
- Newer roof shingles
- Granite countertops
Tags
Neighborhood map
What this means for you Summary
Snapshot
- This is a 2-bed/1.0-bath single-family listed at $110k.
Deal economics
- At list price, monthly cash flow is $-11 ($-131/yr) — negative.
- To cash-flow at today's rent, offer at most $108k (1.8% below list).
- To meet the 1% rule (rent ≥ 1% of price), the offer needs to be $88k (19.8% below list).
- Recommended offer: $88k (19.8% below list) — sets the bar for 1% rule.
- Cap rate 6.2% vs local median 4.8% in New Castle — meaningfully above typical; check what's discounted (condition, days-on-market, listing class) to confirm the premium yield is real.
Location & tenants
- Location reads 75/100 on livability (#64 in IN, #4,219 nationally) — a middle-class / working-renter tenant base. Strengths: crime A+, cost of living A+, housing A+; Watch: schools D+, amenities F, commute F.
- New Castle Community School Corporation (town): math 30% / reading 35% proficiency, ranked #229 of 301 in IN (top 76%) — families likely to look elsewhere, expect single-tenant / working-renter base with shorter leases.
- Market conditions: Rents rising fast (+4.6%/yr); 214 active listings in the ZIP; 7 comparable units currently listed for rent nearby; rentals at typical pace (median 15d on market — plan ~3-4 weeks tenant-placement turnaround); 47 units permitted in Henry County in 2024 (0 in 5+ unit buildings).
- This rent is only 18% of the median local income ($60k/yr) — well below the 30% rent-burden line; pricing power to push rent on renewal without tenant pushback.
Forward outlook
- Local home prices are declining (-3.0%/yr); year-one equity from $760 of loan paydown is wiped out by about $3k of value loss. Plan a longer hold.
- Henry County population projected at -12% by 2050 — secular population decline; favor cash flow + early exit over multi-decade hold.
Negotiation context
- It's been on market 80 days — a 6% lower offer ($103k) is reasonable based on typical stale-listing flexibility.
- 16 sale attempts since 7y ago; this cycle's ask has dropped $10k (8%) from the opening price — seller is motivated, your offer sets the floor, not the list.
Risks & watch-outs
- Watch-outs: built in 1928 — expect roof / HVAC / electrical / plumbing capex.
- Climate carrying-cost: major flood risk — expect insurance premiums to compound above CPI over the hold.
Questions for the listing agent
- What do current leases actually rent for vs. the listed asking? Can we see a recent rent roll and the last 12 months of T-12 income?
- It's been on market 80 days. Have you received any prior offers? Is the seller open to a 20% concession, seller financing, or rate buy-down credit?
- Built in 1928 — when were the roof, HVAC, electrical panel, plumbing, and water heater last replaced?
- Why hasn't it sold? Are there any deal-killer items the seller is aware of (foundation, flood, title, zoning, code violations)?
- Is there a deadline driving the sale (1031 exchange, divorce, estate, relocation)? That informs how much negotiation room exists.
- Schools are D-rated, which usually means shorter tenancies and higher turnover. Who's the typical renter profile here, and what's been the actual vacancy rate?
- The area grade is low — what's the realistic commute time and amenity access for the typical tenant pool here? Any planned neighborhood developments (good or bad) we should know about?
- What's the average days-on-market for RENTAL listings here right now (not sales)? A rising rental-DOM trend means longer vacancies and softer asking-rent achievability than the comps imply.
- What's the recent tenant-quality profile in this submarket — average credit score on applications, eviction rate, late-payment / NSF rate, and stable-employment percentage? A property-management company in the area should have these aggregated.
- How much new for-sale + rental construction is in the pipeline within 1–3 miles? Heavy new supply typically softens prices + rents 12–24 months out; constrained supply supports both.
Investment metrics
- 1% rule
- 0.80% ✗
- Cap rate
- 6.17%
- Cash-on-cash
- -0.43%
- DSCR
- 0.98
- GRM
- 10.4
CMA / ARV
- ARV (median comp)
- $99,095
- List price
- $109,900
- Delta
- 10.90%
- Verdict
- OVERPRICED
- Comps
- 20 within 1.0 mi
Show comp detail 12 sales within ~0.75 mi
| Address | Dist | Beds/Ba | Sqft | Sold | Price | $/sf | Match |
|---|---|---|---|---|---|---|---|
| 1318 S 22nd St | 0.47mi | 2/1.0 | 780 (-2%) | 2mo | $140,000 | $179 | 74 |
| 2128 Grand Ave | 0.27mi | 2/1.0 | 861 (+9%) | 0mo | $93,000 | $108 | 72 |
| 944 S 21st St | 0.22mi | 2/1.0 | 728 (-8%) | 6mo | $65,000 | $89 | 71 |
| 2318 A Ave | 0.27mi | 2/1.0 | 728 (-8%) | 4mo | $23,000 | $32 | 70 |
| 919 S 23rd St | 0.30mi | 2/1.0 | 816 (+3%) | 18mo | $100,000 | $123 | 66 |
| 2118 Vine St | 0.45mi | 2/1.0 | 840 (+6%) | 4mo | $128,000 | $152 | 66 |
| 1516 S 20th St | 0.58mi | 2/1.0 | 756 (-4%) | 7mo | $106,000 | $140 | 60 |
| 2422 Spring St | 0.60mi | 2/1.0 | 853 (+8%) | 0mo | $100,000 | $117 | 59 |
| 1418 S 20th St | 0.51mi | 2/1.0 | 825 (+4%) | 13mo | $85,400 | $104 | 58 |
| 1144 S Main St | 0.72mi | 2/1.0 | 842 (+6%) | 16mo | $119,000 | $141 | 43 |
| 1302 S 23rd St | 0.46mi | 2/1.0 | 898 (+13%) | 16mo | $52,000 | $58 | 43 |
| 1126 Webster Ave | 0.75mi | 2/1.0 | 896 (+13%) | 13mo | $40,000 | $45 | 33 |
Match score weights: distance 35% · size 25% · config 20% · recency 20%. Top-matched comps best support the ARV.
Projected returns pro-forma
-3.0% appreciation · 4.59% rent growth · sell at horizon
- IRR
- -15.4%
- Equity multiple
- 0.44×
- Total profit
- $-17,093
- Equity at exit
- $16,386
- IRR
- -4.5%
- Equity multiple
- 0.68×
- Total profit
- $-9,789
- Equity at exit
- $9,502
Cash invested: $30,772 (down + closing). Projections, not guarantees.
Landlord ↔ Tenant lean methodology
- Overall (STATE)
- 90 Strongly Landlord-Friendly
- State Indiana
- 90 Strongly Landlord-Friendly · R+11
- County
- — inherits STATE
- City
- — inherits STATE
ZIP-level market 47362
- Home prices YoY
- -16.0%
- Rents YoY
- 4.6%
- Active inventory
- 214
- Price-to-rent
- 10.4×
Monthly cashflow live
- Estimated rent
- $881 high interval (Pro) →
- Mortgage (P&I)
- −$576
- Tax from tax record
- −$85 /mo · $1,019/yr
- Insurance
- −$46
- HOA
- −$0
- Vacancy / Maint / Mgmt
- −$185
- Net cashflow
- $-11
Break-even live
UW: 25.0% down · 7.5% · 30yr · 1.5% tax · 5.0% vac · 8.0% maint · 8.0% mgmt
Financing live
Cash to close
- Down payment
- $27,475
- Closing costs
- $3,297
- Reserves months
- —
- Total cash needed
- —
Loan-product check · same deal, 3 products live
Conventional
25% down · 7.5% · 30yr
- Down + closing
- —
- Monthly P&I
- —
- Monthly cashflow
- —
- DSCR
- —
- Eligible?
- —
Personal DTI + credit; lowest rate.
DSCR
20% down · 8.5% · 30yr
- Down + closing
- —
- Monthly P&I
- —
- Monthly cashflow
- —
- DSCR
- —
- Eligible?
- —
No personal income docs; deal must DSCR.
Hard money
10% down · 12.0% · 12mo
- Down + closing
- —
- Monthly P&I
- —
- Monthly cashflow
- —
- DSCR
- —
- Eligible?
- —
Short-term bridge; refi at stabilization.
Rent comps 7 comps
| Address | Beds | Baths | Sqft | Rent | $/sqft | DOM | Units | Dist |
|---|---|---|---|---|---|---|---|---|
| 1216 S 19th St New Castle, IN | 2.0 | 1.0 | 824 | $1,000 | $1.21 | 24d | 1 | 0.43mi |
| 940 S 15th St New Castle, IN | 1.0–2.0 | 1.0–1.5 | 816 | $1,075 | $1.32 | 2d | 2 | 0.44mi |
| 701 S 14th St Unit 4A New Castle, IN | 1.0 | 1.0 | 600 | $615 | $1.02 | 12d | 1 | 0.50mi |
| 417 S 12th St Unit D New Castle, IN | 1.0 | 1.0 | 525 | $685 | $1.30 | 15d | 1 | 0.65mi |
| 1104 Thornburg St New Castle, IN | 2.0 | 1.0 | 645 | $685 | $1.06 | 44d | 1 | 0.88mi |
| 1618 P Ave New Castle, IN | 3.0 | 1.5 | 1064 | $950 | $0.89 | 2d | 1 | 1.09mi |
| 1402 Alabama St New Castle, IN | 2.0 | 1.0 | 912 | $795 | $0.87 | 24d | 1 | 1.30mi |
Listing history 50 events
-
2026-06-19days on market $109,900 Active 80 DOM
-
2026-06-18days on market $109,900 Active 79 DOM
-
2026-06-17days on market $109,900 Active 78 DOM
-
2026-06-16days on market $109,900 Active 77 DOM
-
2026-06-15days on market $109,900 Active 76 DOM
-
2026-06-14days on market $109,900 Active 74 DOM
-
2026-06-12days on market $109,900 Active 73 DOM
-
2026-06-09days on market $109,900 Active 70 DOM
-
2026-06-08days on market $109,900 Active 69 DOM
-
2026-06-07days on market $109,900 Active 68 DOM
-
2026-06-05days on market $109,900 Active 65 DOM
-
2026-06-03days on market $109,900 Active 64 DOM
-
2026-06-02days on market $109,900 Active 63 DOM
-
2026-06-01days on market $109,900 Active 62 DOM
-
2026-05-31days on market $109,900 Active 61 DOM
-
2026-05-30days on market $109,900 Active 60 DOM
-
2026-05-06price $109,900 945-char remark
Show marketing remark (945 chars)
Updated 2-bedroom home with immediate possession available! This property features numerous recent improvements including newer roof shingles, vinyl siding, vinyl replacement windows, and updated kitchen cabinets with granite countertops. Interior highlights include vinyl plank flooring throughout the main living areas and carpeted bedrooms for added comfort. The living room offers an electric fireplace, creating a warm and inviting space. The eat-in kitchen provides ample cabinet space and functionality, along with a convenient main-level laundry room. The bathroom has been tastefully updated with a claw foot tub, subway tile, and shiplap accents, blending modern updates with classic charm. Additional features include a partial basement with a 90+ high-efficiency gas furnace and central air, a one-car detached garage with built-in storage, and a partially fenced backyard. A great opportunity for owner-occupants or investors alike!
-
2026-03-30$119,900 Active 945-char remark
Show marketing remark (945 chars)
Updated 2-bedroom home with immediate possession available! This property features numerous recent improvements including newer roof shingles, vinyl siding, vinyl replacement windows, and updated kitchen cabinets with granite countertops. Interior highlights include vinyl plank flooring throughout the main living areas and carpeted bedrooms for added comfort. The living room offers an electric fireplace, creating a warm and inviting space. The eat-in kitchen provides ample cabinet space and functionality, along with a convenient main-level laundry room. The bathroom has been tastefully updated with a claw foot tub, subway tile, and shiplap accents, blending modern updates with classic charm. Additional features include a partial basement with a 90+ high-efficiency gas furnace and central air, a one-car detached garage with built-in storage, and a partially fenced backyard. A great opportunity for owner-occupants or investors alike!
-
2023-07-14soldstatus $125,000 Closed
-
2023-07-14soldstatus $125,000
-
2023-07-14soldstatus $125,000 Closed
-
2023-06-13status Pending
-
2023-06-13status Active
-
2023-06-13status Pending
-
2023-06-13status Active
-
2023-05-25status Pending
-
2023-05-25status Pending
-
2023-05-23$114,900 Active
-
2023-05-23$114,900
-
2023-05-23$114,900 Active
-
2023-02-24soldstatus $39,900 Closed
-
2023-02-24soldstatus $39,900
-
2023-02-24soldstatus $39,900 Closed
-
2023-01-23status Pending
-
2023-01-23status Pending
-
2023-01-18$39,900 Active
-
2023-01-18$39,900
-
2023-01-18$39,900 Active
-
2020-05-29soldstatus $25,000
-
2020-05-29soldstatus $25,000
-
2020-05-29soldstatus $25,000
-
2020-05-05$27,900
-
2020-05-05$27,900
-
2020-05-05$27,900
-
2019-11-10$34,900
-
2019-04-24historical
-
2019-01-23$35,900
-
2019-01-23$35,900
ⓘ Source: listings_history table (triggers on properties + properties_extension) + one-shot
backfill from property_details.listing_events for pre-trigger history.
Tax reassessment forecast IN · Partial reset (capped growth)
- Current annual tax
- $1,019 · $85/mo
- Projected year-2 tax
- $1,019 · $85/mo
- Expected delta
- $0/yr ($0/mo · 0.0%)
ⓘ Screening estimate from a state-policy table — verify with the county assessor before closing.
Climate risk First Street
- Flood 6/10 Major FEMA zone X (unshaded) · 68% chance over 30 yrs
- Wildfire 1/10 Low
- Heat 3/10 Moderate 7 d/yr ≥99°F today · 18 d/yr by 30 yrs out
- Wind 2/10 Low 0% chance of damaging wind over 30 yrs
- Air quality 2/10 Low 1 unhealthy d/yr today · 2 by 30 yrs out
Nearby sold comps map
Loading sold comps map…
Walkable amenities ~0.75 mi
Loading nearby amenities…
Taxation est. · year 1
- Rental income
- $10,574
- − Mortgage interest
- −$6,156
- − Property taxes
- −$1,019
- − Insurance
- −$550
- − Repairs & maintenance
- −$846
- − Management
- −$846
- − Depreciation
- −$3,197
- Taxable loss
- −$2,040
- Est. tax savings @ 24.0%
- +$490
- After-tax cash flow
- $358/yr
For passive investors: Depreciation is non-cash, so a rental often shows a tax loss while cash-flowing — sheltering income. Rental losses are passive: they offset passive income freely, and up to $25,000/yr can offset ordinary (W-2) income if you actively participate and your MAGI is under $100k (phasing out to $0 by $150k); unused losses carry forward. On sale, claimed depreciation is recaptured at up to 25%, and gains may owe capital-gains tax (a 1031 exchange can defer both). Figures are a year-1 estimate at your 24.0% rate — not tax advice; consult a CPA.
Schools (NCES district)
- District
- New Castle Community School Corporation
- NCES district ID
- 1807440
- Math proficiency
- 30% ▼ -13.00%
- Reading proficiency
- 35% ▼ -9.00%
- Median HH income
- $36,717
- Composite
- 26.99/100
- National rank
- #7067
- State rank
- #229 of 301 in IN
Livability — New Castle
- Score
- 75/100
- State rank
- #64
- US rank
- #4219
Category grades
Schools grade is shown separately in the Schools card above.
Census & demographics
- Census place
- New Castle, IN
- County
- Henry County · 29,337 people
- City population
- 29,337
- Metro
- New Castle, IN
- Population (ZIP)
- 29,337
- Household income
- $60,258
- Rent vs Own
- Severe rent burden
- 545.0
Population outlook (Henry County) Hauer SSP2
- Today (2025)
- 48,028 people
- By 2030
- 47,125 · -1.9%
- By 2040
- 44,820 · -6.7%
- By 2050
- 42,207 · -12.1%
- By 2075
- 35,814 · -25.4%
- By 2100
- 26,779 · -44.2%
Race, ethnicity, and origin ACS 2023
- Neighborhood character
- Predominantly White (90%)
- Race & ethnicity
- White 90% Two or more races 3% Black 3% Hispanic / Latino 3%
- Common ancestry
- Italian 2% Slovak 1% Lithuanian 1%
- Foreign-born
- 2% · Canada
- Languages at home
- 97% English-only · Spanish 2%
Political lean MEDSL · Henry
- 2024 margin
- Solid R (+47.7) · D 25.3% · R 73.0% · Other 1.7%
- 2008→2024 swing
- -43.8pp toward R · 2008: -3.9pp · 2024: -47.7pp
- All cycles
- 2024: R+47.7 2020: R+45.2 2016: R+43.7 2012: R+17.0 2008: R+3.9
Not yet ingested
- Civics
- —
Market trends
- HPI YoY
- ▼ -43.70%
- Current HPI
- 228.8885
- Rent YoY
- ▲ 4.59%
- Metro
- New Castle, IN
- State GDP YoY
- ▲ 2.90%
- F500 in state
- 18
Industry mix (Fortune 500 HQ in IN)
| Industry | F500 HQs | Revenue |
|---|---|---|
| Industrial Machinery | 2 | $37B |
|
||
| Healthcare | 1 | $177B |
|
||
| Pharmaceuticals | 1 | $45B |
|
||
| Metals / Steel | 1 | $18B |
|
||
| Agriculture | 1 | $17B |
|
||
| Packaging | 1 | $12B |
|
||
Price history
+206.1% since first listed34 events — show timeline
- 2026-05-06 Price Changed $109,900 MIBOR as Distributed by MLS Grid
- 2026-05-06 Price Changed $109,900 IRMLS
- 2026-03-30 Listed $119,900 IRMLS
- 2026-03-30 Listed $119,900 MIBOR as Distributed by MLS Grid
- 2023-07-14 Sold (MLS) $125,000 MIBOR as Distributed by MLS Grid
- 2023-07-14 Sold (MLS) $125,000 RRELMS
- 2023-07-14 Sold (MLS) $125,000 IRMLS
- 2023-06-13 Pending — IRMLS
- 2023-06-13 Relisted — IRMLS
- 2023-06-13 Pending — MIBOR as Distributed by MLS Grid
- 2023-06-13 Relisted — MIBOR as Distributed by MLS Grid
- 2023-05-25 Pending — IRMLS
- 2023-05-25 Pending — MIBOR as Distributed by MLS Grid
- 2023-05-23 Listed $114,900 MIBOR as Distributed by MLS Grid
- 2023-05-23 Listed $114,900 RRELMS
- 2023-05-23 Listed $114,900 IRMLS
- 2023-02-24 Sold (MLS) $39,900 MIBOR as Distributed by MLS Grid
- 2023-02-24 Sold (MLS) $39,900 RRELMS
- 2023-02-24 Sold (MLS) $39,900 IRMLS
- 2023-01-23 Pending — MIBOR as Distributed by MLS Grid
- 2023-01-23 Pending — IRMLS
- 2023-01-18 Listed $39,900 MIBOR as Distributed by MLS Grid
- 2023-01-18 Listed $39,900 RRELMS
- 2023-01-18 Listed $39,900 IRMLS
- 2020-05-29 Sold (MLS) $25,000 IRMLS
- 2020-05-29 Sold (MLS) $25,000 RRELMS
- 2020-05-29 Sold (MLS) $25,000 MIBOR as Distributed by MLS Grid
- 2020-05-05 Listed $27,900 RRELMS
- 2020-05-05 Listed $27,900 MIBOR as Distributed by MLS Grid
- 2020-05-05 Listed $27,900 IRMLS
- 2019-11-10 Listed $34,900 IRMLS
- 2019-04-24 Listing Removed — MIBOR as Distributed by MLS Grid
- 2019-01-23 Listed $35,900 MIBOR as Distributed by MLS Grid
- 2019-01-23 Listed $35,900 IRMLS
Property tax history
+59.8%/yrLatest (2024): $1,019 · +1.6% YoY. Source: county tax records.
Cash-flow waterfall
monthlySold comps — $/sqft
last 12 mo · ≤1 miLoading sold comps…