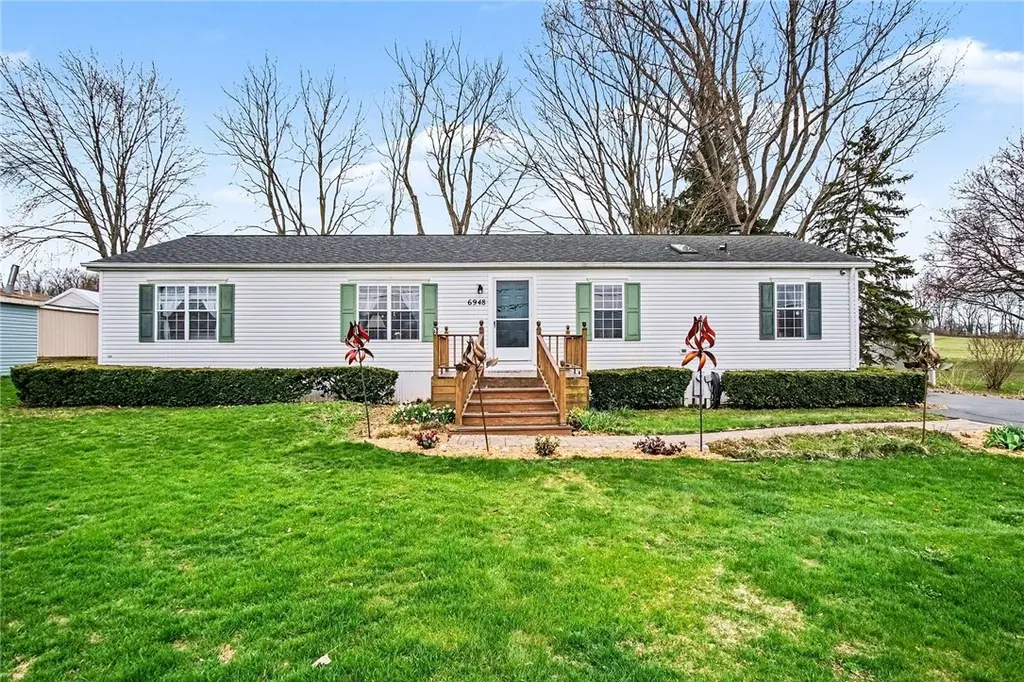
6948 Swamp Rd · Bergen, NY
Flood risk 1/10 · Minimal
- FEMA flood zone
- —
- Chance of flooding over 30 yrs
- 0.0%
- Est. flood insurance / yr
- —
Fire risk 1/10 · Minimal
- Est. fire insurance / yr
- $691 – $1,283
Heat risk 2/10 · Minimal
- Hot days now (above 95°F)
- 7 days/yr
- Hot days in 30 yrs
- 15 days/yr
Wind risk 1/10 · Minimal
- Chance of severe wind over 30 yrs
- —
Air-quality risk 2/10 · Minimal
- Unhealthy air days now
- 1 days/yr
- Unhealthy air days in 30 yrs
- 2 days/yr
Risk factors via First Street. Map © Google.
Why this score? — see what drove the D grade
The composite is a weighted blend of 9 inputs, each scored 0–100. Each bar is that input's sub-score; the figure is the points it added to the 100-point composite (weight × sub-score).
- Cash flow +9.8/30.0
- ARV discount +7.5/15.0
- Appreciation +5.7/10.0
- Schools +4.5/10.0
- Livability +3.7/5.0
- 1% rule +3.5/10.0
- DSCR +2.8/10.0
- Rent growth +2.5/5.0
- Condition / age +2.5/5.0
$154,900
🖨 Deal sheet (PDF) 📄 Offer letter ✓ Due diligence
Listing remarks
Welcome home to this spacious ranch-style property offering 1,680 sq ft of comfortable living! Built in 1995 and set on a generous . 40-acre lot, this 3-bedroom, 2 full bath home combines modern updates with a peaceful country setting. Step inside to an inviting open floor plan, perfect for both everyday living and entertaining. Enjoy the convenience of first-floor laundry and central air for year-round comfort. Major updates include a newer furnace (2018), roof (2020), and added leaf guards on the gutters for low-maintenance exterior care—giving peace of mind to the next owner. The oversized primary suite is a true retreat, featuring a private bath with a relaxing soaking tub, separa
Key facts
- Open floor plan
- Newer furnace
- Ranch-style property
Tags
Neighborhood map
What this means for you Summary
Snapshot
- This is a 3-bed/2.0-bath single-family listed at $155k.
Deal economics
- At list price, monthly cash flow is $-100 ($-1k/yr) — negative.
- To cash-flow at today's rent, offer at most $137k (11.5% below list).
- To meet the 1% rule (rent ≥ 1% of price), the offer needs to be $131k (15.3% below list).
- Recommended offer: $131k (15.3% below list) — sets the bar for 1% rule.
Location & tenants
- Location reads 73/100 on livability (#318 in NY) — a middle-class / working-renter tenant base. Strengths: cost of living A+, housing A+, crime A; Watch: amenities F, commute F, health & safety D-.
- Byron-Bergen Central School District (rural): math 52% / reading 51% proficiency, ranked #348 of 590 in NY (top 59%) — acceptable for families but not a draw, mixed tenant base, ~2y average lease.
- Zoned schools: Byron-Bergen Elementary School (math 47% / reading 54%, grade D+, #1,053 of 2,108 statewide, top 50%, 410 students, 54% FRL); Byron-Bergen Junior/Senior High School (math 57% / reading 42%, grade D, #974 of 1,100 statewide, top 91%, 434 students, 43% FRL) — zoned schools average 48% FRL vs 26% district-wide (22 pts higher); higher-poverty schools than district average — tighter screening recommended.
- Market conditions: 5 active listings in the ZIP; 55 units permitted in Genesee County in 2024 (0 in 5+ unit buildings).
Forward outlook
- In year one you build about $3k of equity ($1k loan paydown + $2k appreciation (1.5% local appreciation)).
- Genesee County population projected at -22% by 2050 — secular population decline; favor cash flow + early exit over multi-decade hold.
- By year 10, paydown + projected appreciation supports a ~$34k cash-out refi (75% LTV) — recoverable capital for the next deal without selling this one.
Negotiation context
- Only 6 days on market — expect competitive offers; lowballing is unlikely to land.
Questions for the listing agent
- What do current leases actually rent for vs. the listed asking? Can we see a recent rent roll and the last 12 months of T-12 income?
- Is there a deadline driving the sale (1031 exchange, divorce, estate, relocation)? That informs how much negotiation room exists.
- Schools are B-rated — typically a magnet for longer-tenancy family renters. What's the average tenant stay here, and is there a school-zone premium baked into asking?
- The area grade is low — what's the realistic commute time and amenity access for the typical tenant pool here? Any planned neighborhood developments (good or bad) we should know about?
- What's the average days-on-market for RENTAL listings here right now (not sales)? A rising rental-DOM trend means longer vacancies and softer asking-rent achievability than the comps imply.
- What's the recent tenant-quality profile in this submarket — average credit score on applications, eviction rate, late-payment / NSF rate, and stable-employment percentage? A property-management company in the area should have these aggregated.
- How much new for-sale + rental construction is in the pipeline within 1–3 miles? Heavy new supply typically softens prices + rents 12–24 months out; constrained supply supports both.
Investment metrics
- 1% rule
- 0.85% ✗
- Cap rate
- 5.51%
- Cash-on-cash
- -2.78%
- DSCR
- 0.88
- GRM
- 9.8
CMA / ARV
No comps found within radius.
Projected returns pro-forma
1.48% appreciation · 3.0% rent growth · sell at horizon
- IRR
- 0.1%
- Equity multiple
- 1.01×
- Total profit
- $253
- Equity at exit
- $56,812
- IRR
- 4.6%
- Equity multiple
- 1.60×
- Total profit
- $25,959
- Equity at exit
- $78,638
Cash invested: $43,372 (down + closing). Projections, not guarantees.
Landlord ↔ Tenant lean methodology
- Overall (STATE)
- 15 Strongly Tenant-Friendly
- State New York
- 15 Strongly Tenant-Friendly · D+10
- County
- — inherits STATE
- City
- — inherits STATE
ZIP-level market 14422
- Home prices YoY
- 0.6%
- Active inventory
- 5
- Price-to-rent
- 9.8×
Monthly cashflow live
- Estimated rent
- $1,312 medium interval (Pro) →
- Mortgage (P&I)
- −$812
- Tax from tax record
- −$260 /mo · $3,123/yr
- Insurance
- −$65
- HOA
- −$0
- Vacancy / Maint / Mgmt
- −$276
- Net cashflow
- $-100
Break-even live
Sensitivity live
| Price | -10% $-13 | -5% $-57 | +0% $-100 | +5% $-144 | +10% $-188 |
|---|---|---|---|---|---|
| Rent | -10% $-204 | -5% $-152 | +0% $-100 | +5% $-49 | +10% $3 |
| Rate | -1.0pp $-22 | -0.5pp $-61 | base $-100 | +0.5pp $-141 | +1.0pp $-181 |
UW: 25.0% down · 7.5% · 30yr · 1.5% tax · 5.0% vac · 8.0% maint · 8.0% mgmt
Financing live
Cash to close
- Down payment
- $38,725
- Closing costs
- $4,647
- Reserves months
- —
- Total cash needed
- —
Loan-product check · same deal, 3 products live
Conventional
25% down · 7.5% · 30yr
- Down + closing
- —
- Monthly P&I
- —
- Monthly cashflow
- —
- DSCR
- —
- Eligible?
- —
Personal DTI + credit; lowest rate.
DSCR
20% down · 8.5% · 30yr
- Down + closing
- —
- Monthly P&I
- —
- Monthly cashflow
- —
- DSCR
- —
- Eligible?
- —
No personal income docs; deal must DSCR.
Hard money
10% down · 12.0% · 12mo
- Down + closing
- —
- Monthly P&I
- —
- Monthly cashflow
- —
- DSCR
- —
- Eligible?
- —
Short-term bridge; refi at stabilization.
Listing history 2 events
-
2026-04-17status Pending
-
2026-04-11$154,900 Active
ⓘ Source: listings_history table (triggers on properties + properties_extension) + one-shot
backfill from property_details.listing_events for pre-trigger history.
Tax reassessment forecast NY · Partial reset (capped growth)
- Current annual tax
- $3,123 · $260/mo
- Projected year-2 tax
- $3,123 · $260/mo
- Expected delta
- $0/yr ($0/mo · 0.0%)
ⓘ Screening estimate from a state-policy table — verify with the county assessor before closing.
Climate risk First Street
- Flood 1/10 Low 0% chance over 30 yrs
- Wildfire 1/10 Low
- Heat 2/10 Low 7 d/yr ≥95°F today · 15 d/yr by 30 yrs out
- Wind 1/10 Low
- Air quality 2/10 Low 1 unhealthy d/yr today · 2 by 30 yrs out
Nearby sold comps map
Loading sold comps map…
Walkable amenities ~0.75 mi
Loading nearby amenities…
Taxation est. · year 1
- Rental income
- $15,746
- − Mortgage interest
- −$8,677
- − Property taxes
- −$3,123
- − Insurance
- −$774
- − Repairs & maintenance
- −$1,260
- − Management
- −$1,260
- − Depreciation
- −$4,506
- Taxable loss
- −$3,854
- Est. tax savings @ 24.0%
- +$925
- After-tax cash flow
- $-281/yr
For passive investors: Depreciation is non-cash, so a rental often shows a tax loss while cash-flowing — sheltering income. Rental losses are passive: they offset passive income freely, and up to $25,000/yr can offset ordinary (W-2) income if you actively participate and your MAGI is under $100k (phasing out to $0 by $150k); unused losses carry forward. On sale, claimed depreciation is recaptured at up to 25%, and gains may owe capital-gains tax (a 1031 exchange can defer both). Figures are a year-1 estimate at your 24.0% rate — not tax advice; consult a CPA.
Schools (NCES district)
- District
- Byron-Bergen Central School District
- NCES district ID
- 3606090
- Math proficiency
- 52% ▼ -5.00%
- Reading proficiency
- 51% ▼ -2.00%
- Median HH income
- $55,527
- Composite
- 44.57/100
- National rank
- #2785
- State rank
- #348 of 590 in NY
Livability — Bergen
- Score
- 73/100
- State rank
- #318
- US rank
- #5278
Category grades
Schools grade is shown separately in the Schools card above.
Census & demographics
- Population (ZIP)
- 1,693
Population outlook (Genesee County) Hauer SSP2
- Today (2025)
- 56,113 people
- By 2030
- 54,140 · -3.5%
- By 2040
- 49,368 · -12.0%
- By 2050
- 43,911 · -21.7%
- By 2075
- 32,511 · -42.1%
- By 2100
- 21,695 · -61.3%
Race, ethnicity, and origin ACS 2023
- Neighborhood character
- Predominantly White (87%)
- Race & ethnicity
- White 87% Two or more races 9% Black 2% Hispanic / Latino 2%
- Common ancestry
- Slovak 6% Romanian 6% Italian 5%
- Foreign-born
- 0%
- Languages at home
- 98% English-only · Spanish 2%
Political lean MEDSL · Genesee
- 2024 margin
- Solid R (+34.0) · D 33.0% · R 67.0%
- 2008→2024 swing
- -15.6pp toward R · 2008: -18.4pp · 2024: -34.0pp
- All cycles
- 2024: R+34.0 2020: R+31.7 2016: R+37.0 2012: R+20.9 2008: R+18.4
Not yet ingested
- Civics
- —
Market trends
- HPI YoY
- ▲ 1.48%
- Current HPI
- 236.8367
- Rent YoY
- —
- Metro
- —
- State GDP YoY
- ▲ 2.60%
- F500 in state
- 92
Industry mix (Fortune 500 HQ in NY)
| Industry | F500 HQs | Revenue |
|---|---|---|
| Financial Services | 10 | $950B |
|
||
| Consumer Goods | 9 | $162B |
|
||
| Insurance | 4 | $225B |
|
||
| Telecommunications | 2 | $144B |
|
||
| Pharmaceuticals | 2 | $112B |
|
||
| Media / Entertainment | 2 | $69B |
|
||
Price history
2 events — show timeline
- 2026-04-17 Pending — UNYREIS
- 2026-04-11 Listed $154,900 UNYREIS
Property tax history
+2.8%/yrLatest (2025): $3,123 · -8.2% YoY. Source: county tax records.
Cash-flow waterfall
monthlySold comps — $/sqft
last 12 mo · ≤1 miLoading sold comps…