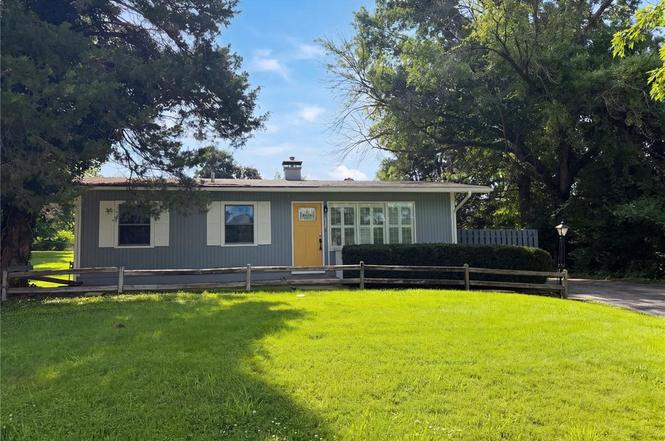
238 W Skyline Dr · Ballwin, MO
Flood risk 1/10 · Minimal
- FEMA flood zone
- X (unshaded)
- Chance of flooding over 30 yrs
- 0.0%
- Est. flood insurance / yr
- $473 – $860
Fire risk 1/10 · Minimal
- Est. fire insurance / yr
- $1,054 – $1,958
Heat risk 5/10 · Moderate
- Hot days now (above 106°F)
- 7 days/yr
- Hot days in 30 yrs
- 20 days/yr
Wind risk 2/10 · Minimal
- Chance of severe wind over 30 yrs
- 1.0%
Air-quality risk 2/10 · Minimal
- Unhealthy air days now
- 0 days/yr
- Unhealthy air days in 30 yrs
- 2 days/yr
Risk factors via First Street. Map © Google.
Why this score? — see what drove the D+ grade
The composite is a weighted blend of 9 inputs, each scored 0–100. Each bar is that input's sub-score; the figure is the points it added to the 100-point composite (weight × sub-score).
- ARV discount +13.0/15.0
- Cash flow +12.5/30.0
- Schools +5.4/10.0
- Livability +4.3/5.0
- DSCR +3.7/10.0
- 1% rule +2.9/10.0
- Rent growth +2.7/5.0
- Condition / age +2.5/5.0
- Appreciation +0.0/10.0
$268,000
🖨 Deal sheet 📄 Offer letter ✓ Due diligence
Listing remarks MLS
Beautiful three bedroom home in Rockwood School District shines inside and out. Freshly painted stylish interior includes living room with gleaming hardwood floors, built in bookcases and large picture windows with plantation shutters. You'll love the eat in kitchen with rich wood cabinets and a pantry. Separate dining room has built in display shelves. The master bedroom is spacious with a walk in closet. Two additional bedrooms with hardwood floors and a full bath complete the main floor. Outside don't miss the covered attached workshop and beautiful patio surrounded by a wooden privacy fence, perfect for outdoor gatherings or enjoying your favorite book. There is a potting shed for the gardener's delight and a separate utility shed. Plenty of outdoor space in the large level backyard. This home has it all! Seller offering home warranty too!
Key facts
- Fenced in backyard
- 0.46 acre lot
- Built 1955
Tags
Property features AI
Finance
- Other: Home warranty included; Seller may consider concessions
Exterior
- Parking: No designated parking
- Utilities: Public water; Public sewer; Electric service (other)
- Home design: Single-family residence; Residential property; Private ownership; Entry level: main/one level
- Construction: Constructed with other materials
- Exterior features: Lot approximately 0.46 acre; Lot dimensions about 100 ft × 200 ft; Other lot features
Interior
- Bedrooms: 6 bedrooms total; 3 bedrooms on the main level; 3 bedrooms on the upper level
- Bathrooms: 2 full bathrooms total; 1 full bathroom on the main level; 1 full bathroom on the upper level
- Heating & cooling: Forced air heating (natural gas); Electric cooling
- Interior features: Partial basement; One level
Neighborhood map
What this means for you Summary
Snapshot
- This is a 3-bed/1.0-bath single-family listed at $268k.
Deal economics
- At list price, monthly cash flow is $-37 ($-442/yr) — negative.
- To cash-flow at today's rent, offer at most $261k (2.4% below list).
- To meet the 1% rule (rent ≥ 1% of price), the offer needs to be $212k (20.7% below list).
- Recommended offer: $212k (20.7% below list) — sets the bar for 1% rule.
- Cap rate 6.1% vs local median 4.0% in Ballwin — top-decile yield for the area; either an underpriced asset or a hidden risk that comps aren't pricing in. Stress-test before assuming the spread holds.
Location & tenants
- Location reads 86/100 on livability (#2 in MO, #357 nationally) — a professional / high-income tenant draw. Strengths: crime A+, employment A+, housing A+; Watch: commute D.
- Rockwood R-VI (suburban): math 51% / reading 64% proficiency, ranked #9 of 324 in MO (top 3%) — acceptable for families but not a draw, mixed tenant base, ~2y average lease; only 10% free/reduced lunch — higher-income household profile.
- Zoned schools: Westridge Elem. (math 47% / reading 57%, grade C-, #231 of 1,115 statewide, top 24%, 400 students, 20% FRL); Marquette Sr. High (math 53% / reading 79%, grade B, #17 of 521 statewide, top 3%, 2,155 students, 13% FRL).
- Market conditions: Rents flat; 139 active listings in the ZIP; 5 comparable units currently listed for rent nearby; rentals at typical pace (median 15d on market — plan ~3-4 weeks tenant-placement turnaround); 40% of comp listings sitting > 30 days — soft ceiling on asking rent; high-income renter base; 920 units permitted in St. Louis County in 2024 (250 in 5+ unit buildings).
Forward outlook
- Local home prices are declining (-3.0%/yr); year-one equity from $2k of loan paydown is wiped out by about $8k of value loss. Plan a longer hold.
Negotiation context
- Only 2 days on market — expect competitive offers; lowballing is unlikely to land.
- 3 sale attempts since 12y ago; this cycle's ask is 15665% above the opening price — seller raised mid-cycle; expect resistance to lowballs.
- Current owner paid $126k; list at $268k implies a 113% gain — meaningful room to come down on a strong offer.
Risks & watch-outs
- Watch-outs: built in 1955 — expect roof / HVAC / electrical / plumbing capex.
- Climate carrying-cost: extreme-heat days projected 7→20/yr by 2055 (HVAC capex compounding) — expect insurance premiums to compound above CPI over the hold.
Questions for the listing agent
- What do current leases actually rent for vs. the listed asking? Can we see a recent rent roll and the last 12 months of T-12 income?
- Built in 1955 — when were the roof, HVAC, electrical panel, plumbing, and water heater last replaced?
- Is there a deadline driving the sale (1031 exchange, divorce, estate, relocation)? That informs how much negotiation room exists.
- Schools are A-rated — typically a magnet for longer-tenancy family renters. What's the average tenant stay here, and is there a school-zone premium baked into asking?
- The area grade is low — what's the realistic commute time and amenity access for the typical tenant pool here? Any planned neighborhood developments (good or bad) we should know about?
- What's the average days-on-market for RENTAL listings here right now (not sales)? A rising rental-DOM trend means longer vacancies and softer asking-rent achievability than the comps imply.
- What's the recent tenant-quality profile in this submarket — average credit score on applications, eviction rate, late-payment / NSF rate, and stable-employment percentage? A property-management company in the area should have these aggregated.
- How much new for-sale + rental construction is in the pipeline within 1–3 miles? Heavy new supply typically softens prices + rents 12–24 months out; constrained supply supports both.
Investment metrics
- 1% rule
- 0.79% ✗
- Cap rate
- 6.13%
- Cash-on-cash
- -0.59%
- DSCR
- 0.97
- GRM
- 10.5
CMA / ARV
- ARV (on-the-fly)
- $305,214
- Comps found
- 12
Show comp detail 12 sales within ~0.75 mi
| Address | Dist | Beds/Ba | Sqft | Sold | Price | $/sf | Match |
|---|---|---|---|---|---|---|---|
| 239 E Skyline Dr | 0.05mi | 3/1.0 | 1,104 (-7%) | 2mo | $299,900 | $272 | 84 |
| 737 Smith Dr | 0.18mi | 3/2.0 | 1,225 (+4%) | 10mo | $275,000 | $224 | 73 |
| 119 Smith Dr | 0.23mi | 3/2.0 | 1,270 (+7%) | 8mo | $329,900 | $260 | 66 |
| 332 Providence Rd | 0.60mi | 3/2.5 | 1,189 (+0%) | 1mo | $249,900 | $210 | 64 |
| 120 Birchwood Dr | 0.46mi | 3/1.5 | 1,280 (+8%) | 4mo | $278,000 | $217 | 59 |
| 127 Ivy Ct | 0.23mi | 3/2.0 | 1,360 (+15%) | 2mo | $339,000 | $249 | 58 |
| 611 Parker Dr | 0.68mi | 3/1.5 | 1,123 (-5%) | 7mo | $289,999 | $258 | 52 |
| 812 Kehrs Mill Rd | 0.39mi | 3/1.5 | 1,009 (-15%) | 6mo | $214,900 | $213 | 50 |
| 112 Shirley Ln | 0.75mi | 3/2.0 | 1,116 (-6%) | 6mo | $250,000 | $224 | 47 |
| 117 Birchwood Dr | 0.45mi | 3/1.5 | 1,020 (-14%) | 12mo | $299,900 | $294 | 44 |
| 930 Crestland Dr | 0.41mi | 3/2.0 | 1,025 (-13%) | 13mo | $284,900 | $278 | 44 |
| 909 Salem Way | 0.70mi | 3/1.5 | 1,064 (-10%) | 11mo | $289,000 | $272 | 39 |
Match score weights: distance 35% · size 25% · config 20% · recency 20%. Top-matched comps best support the ARV.
Projected returns pro-forma
-3.0% appreciation · 0.83% rent growth · sell at horizon
- IRR
- -19.6%
- Equity multiple
- 0.33×
- Total profit
- $-50,365
- Equity at exit
- $39,960
- IRR
- -17.3%
- Equity multiple
- 0.13×
- Total profit
- $-64,927
- Equity at exit
- $23,172
Cash invested: $75,040 (down + closing). Projections, not guarantees.
Landlord ↔ Tenant lean methodology
- Overall (STATE)
- 81 Strongly Landlord-Friendly
- State Missouri
- 81 Strongly Landlord-Friendly · R+10
- County
- — inherits STATE
- City
- — inherits STATE
ZIP-level market 63011
- Rents YoY
- 0.8%
- Active inventory
- 139
- Price-to-rent
- 10.5×
Monthly cashflow live
- Estimated rent
- $2,125 high interval (Pro) →
- Mortgage (P&I)
- −$1,405
- Tax from tax record
- −$198 /mo · $2,380/yr
- Insurance
- −$112
- HOA
- −$0
- Vacancy / Maint / Mgmt
- −$446
- Net cashflow
- $-37
Break-even live
UW: 25.0% down · 7.5% · 30yr · 1.5% tax · 5.0% vac · 8.0% maint · 8.0% mgmt
Financing live
Cash to close
- Down payment
- $67,000
- Closing costs
- $8,040
- Reserves months
- —
- Total cash needed
- —
Loan-product check · same deal, 3 products live
Conventional
25% down · 7.5% · 30yr
- Down + closing
- —
- Monthly P&I
- —
- Monthly cashflow
- —
- DSCR
- —
- Eligible?
- —
Personal DTI + credit; lowest rate.
DSCR
20% down · 8.5% · 30yr
- Down + closing
- —
- Monthly P&I
- —
- Monthly cashflow
- —
- DSCR
- —
- Eligible?
- —
No personal income docs; deal must DSCR.
Hard money
10% down · 12.0% · 12mo
- Down + closing
- —
- Monthly P&I
- —
- Monthly cashflow
- —
- DSCR
- —
- Eligible?
- —
Short-term bridge; refi at stabilization.
Rent comps 5 comps
| Address | Beds | Baths | Sqft | Rent | $/sqft | DOM | Units | Dist |
|---|---|---|---|---|---|---|---|---|
| 204 Hillsdale Dr Ballwin, MO | 3.0 | 1.0 | 925 | $1,995 | $2.16 | 43d | 1 | 0.34mi |
| 170 Steamboat Ln Ballwin, MO | 1.0–3.0 | 1.0–2.5 | 1177 | $2,302 | $1.95 | 1d | 10 | 0.63mi |
| 500 Seven Trails Dr Ballwin, MO | 1.0–2.0 | 1.0–2.0 | 1171 | $1,904 | $1.63 | 1d | 18 | 1.11mi |
| 1212 Clarkson Ct #1212 Ellisville, MO | 2.0 | 1.5 | 800 | $1,700 | $2.12 | 43d | 1 | 1.26mi |
| 284 Ramsey Ln Ballwin, MO | 4.0 | 1.0 | 1296 | $2,300 | $1.77 | 14d | 1 | 1.49mi |
Listing history 2 events
-
2026-06-13remarks 370-char remark
-
2026-06-13$268,000 Pending 2 DOM
ⓘ Source: listings_history table (triggers on properties + properties_extension) + one-shot
backfill from property_details.listing_events for pre-trigger history.
Tax reassessment forecast MO · Resets to sale price
- Current annual tax
- $2,380 · $198/mo
- Projected year-2 tax
- $2,600 · $217/mo
- Expected delta
- +$220/yr (+$18/mo · 9.2%)
ⓘ Screening estimate from a state-policy table — verify with the county assessor before closing.
Climate risk First Street
- Flood 1/10 Low FEMA zone X (unshaded) · 0% chance over 30 yrs
- Wildfire 1/10 Low
- Heat 5/10 Major 7 d/yr ≥106°F today · 20 d/yr by 30 yrs out
- Wind 2/10 Low 100% chance of damaging wind over 30 yrs
- Air quality 2/10 Low 0 unhealthy d/yr today · 2 by 30 yrs out
Nearby sold comps map
Loading sold comps map…
Walkable amenities ~0.75 mi
Loading nearby amenities…
Taxation est. · year 1
- Rental income
- $25,498
- − Mortgage interest
- −$15,012
- − Property taxes
- −$2,380
- − Insurance
- −$1,340
- − Repairs & maintenance
- −$2,040
- − Management
- −$2,040
- − Depreciation
- −$7,796
- Taxable loss
- −$5,110
- Est. tax savings @ 24.0%
- +$1,226
- After-tax cash flow
- $785/yr
For passive investors: Depreciation is non-cash, so a rental often shows a tax loss while cash-flowing — sheltering income. Rental losses are passive: they offset passive income freely, and up to $25,000/yr can offset ordinary (W-2) income if you actively participate and your MAGI is under $100k (phasing out to $0 by $150k); unused losses carry forward. On sale, claimed depreciation is recaptured at up to 25%, and gains may owe capital-gains tax (a 1031 exchange can defer both). Figures are a year-1 estimate at your 24.0% rate — not tax advice; consult a CPA.
Schools (NCES district)
- District
- Rockwood R-VI
- NCES district ID
- 2926850
- Math proficiency
- 51% ▼ -7.00%
- Reading proficiency
- 64% ▼ -2.00%
- Median HH income
- $98,721
- Composite
- 53.61/100
- National rank
- #1438
- State rank
- #9 of 324 in MO
Livability — Ballwin
- Score
- 86/100
- State rank
- #2
- US rank
- #357
Category grades
Schools grade is shown separately in the Schools card above.
Census & demographics
- Census place
- Ballwin, MO
- County
- Saint Louis County · 888,823 people
- City population
- 91,586
- Metro
- St. Louis, MO-IL
- Population (ZIP)
- 35,920
- Household income
- $124,454
- Rent vs Own
- Severe rent burden
- 455.0
Population outlook (St. Louis County) Hauer SSP2
- Today (2025)
- 1,025,227 people
- By 2030
- 1,028,023 · +0.3%
- By 2040
- 1,020,940 · -0.4%
- By 2050
- 1,007,280 · -1.8%
- By 2075
- 987,277 · -3.7%
- By 2100
- 921,984 · -10.1%
Race, ethnicity, and origin ACS 2023
- Neighborhood character
- Predominantly White (78%)
- Race & ethnicity
- White 78% Two or more races 8% Asian 8% Hispanic / Latino 5% Black 2%
- Common ancestry
- Lithuanian 4% Romanian 3% Italian 2%
- Foreign-born
- 8% · Canada, South Korea, China
- Languages at home
- 89% English-only · Spanish 3% Other Indo-European 2% Other Asian/Pacific 1%
Political lean MEDSL · St. Louis
- 2024 margin
- Strong D (+23.4) · D 60.8% · R 37.4% · Other 1.7%
- 2008→2024 swing
- +3.5pp toward D · 2008: 19.9pp · 2024: 23.4pp
- All cycles
- 2024: D+23.4 2020: D+24.0 2016: D+16.2 2012: D+13.7 2008: D+19.9
Not yet ingested
- Civics
- —
Market trends
- HPI YoY
- ▼ -271.82%
- Current HPI
- 234.1279
- Rent YoY
- ▲ 0.83%
- Metro
- St. Louis, MO-IL
- State GDP YoY
- ▲ 1.84%
- F500 in state
- 20
Industry mix (Fortune 500 HQ in MO)
| Industry | F500 HQs | Revenue |
|---|---|---|
| Healthcare | 1 | $163B |
|
||
| Insurance | 1 | $21B |
|
||
| Industrial Technology | 1 | $17B |
|
||
| Retail | 1 | $16B |
|
||
| Industrial Distribution | 1 | $10B |
|
||
| Utilities | 1 | $9B |
|
||
Price history
-98.6% since first listed6 events — show timeline
- 2026-06-12 Pending — MARIS as Distributed by MLS Grid
- 2026-06-11 Listed for Rent $1,700 MARIS
- 2026-06-10 Listed $268,000 MARIS as Distributed by MLS Grid
- 2014-10-03 Sold (Public Records) $126,000 Public Records
- 2014-09-30 Sold (MLS) — MARIS as Distributed by MLS Grid
- 2014-08-28 Listed $124,900 MARIS as Distributed by MLS Grid
Property tax history
+2.6%/yrLatest (2022): $2,380 · +0.7% YoY. Source: county tax records.
Cash-flow waterfall
monthlySold comps — $/sqft
last 12 mo · ≤1 miLoading sold comps…