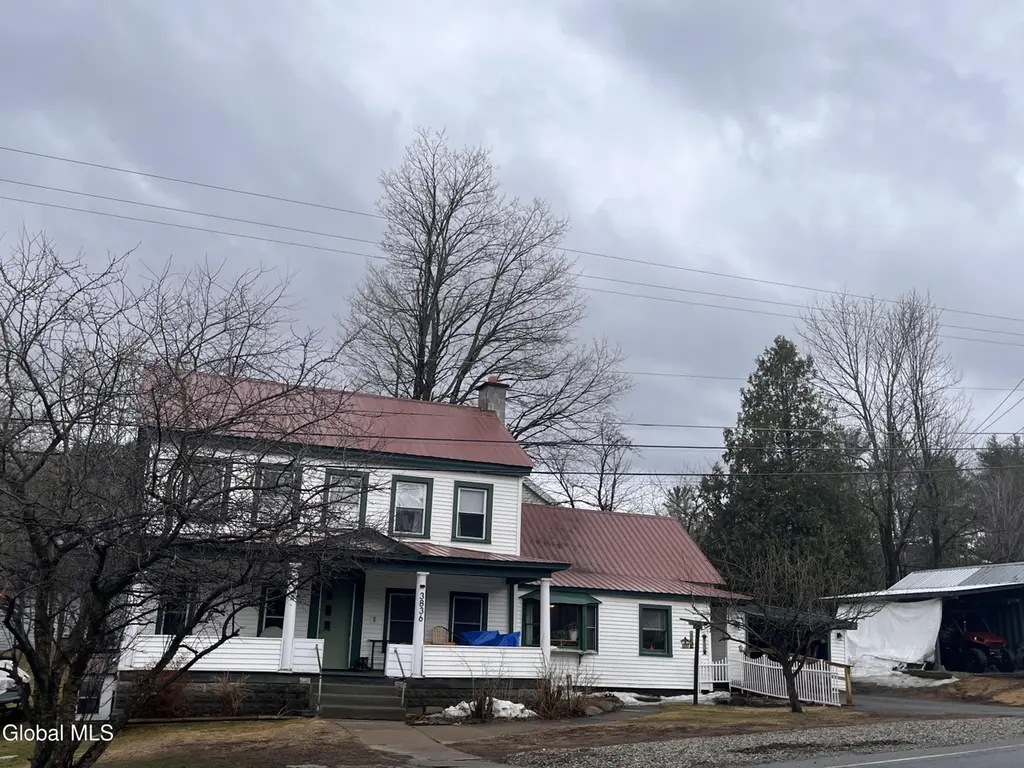
3836 State Route 8 · North Creek, NY
Flood risk 1/10 · Minimal
- FEMA flood zone
- X
- Chance of flooding over 30 yrs
- 0.0%
- Est. flood insurance / yr
- $473 – $860
Fire risk 4/10 · Minor
- Est. fire insurance / yr
- $691 – $1,283
Heat risk 1/10 · Minimal
- Hot days now (above 89°F)
- 7 days/yr
- Hot days in 30 yrs
- 17 days/yr
Wind risk 2/10 · Minimal
- Chance of severe wind over 30 yrs
- 1.0%
Air-quality risk 1/10 · Minimal
- Unhealthy air days now
- 0 days/yr
- Unhealthy air days in 30 yrs
- 0 days/yr
Risk factors via First Street. Map © Google.
Why this score? — see what drove the D grade
The composite is a weighted blend of 9 inputs, each scored 0–100. Each bar is that input's sub-score; the figure is the points it added to the 100-point composite (weight × sub-score).
- ARV discount +15.0/15.0
- Appreciation +9.1/10.0
- Cash flow +6.3/30.0
- Schools +4.2/10.0
- Livability +3.2/5.0
- Rent growth +2.5/5.0
- Condition / age +2.5/5.0
- 1% rule +0.9/10.0
- DSCR +0.6/10.0
$255,000
🖨 Deal sheet (PDF) 📄 Offer letter ✓ Due diligence
Listing remarks MLS
Attention first time homebuyers, Skiers & Adirondack Area Enthusiasts and/or anyone looking for a home to create memories. Come see this ''neat and clean'' home. Originally built in the 1860's and owned and lovingly cared for by one family for over 50 years. In recent years, the home has seen new plumbing, heating, and wiring, with recent full interior new painting. Structurally very sound. The home has 4 bedrooms, with upstairs guest living area, 2 bathrooms, handicap accessible, bright sunny kitchen, stand-up attic space for extra storage room and creation of another room, full basement, perennial garden. Enjoy easy access to Adirondack recreation, Gore Ski area, hiking trails, area lakes and Hudson River. Septic and drilled well in up-to-date condition. Located and bordered on two NYS roads allows for easy access in all directions. Priced at $255,000.00
Key facts
- Stand up attic space
- New plumbing
- New wiring
Tags
Neighborhood map
What this means for you Summary
Snapshot
- This is a 4-bed/1.0-bath single-family listed at $255k.
Deal economics
- At list price, monthly cash flow is $-448 ($-5k/yr) — negative.
- To cash-flow at today's rent, offer at most $176k (31.0% below list).
- To meet the 1% rule (rent ≥ 1% of price), the offer needs to be $150k (41.0% below list).
- Recommended offer: $150k (41.0% below list) — sets the bar for 1% rule.
- Cap rate 4.2% vs local median 2.3% in North Creek — top-decile yield for the area; either an underpriced asset or a hidden risk that comps aren't pricing in. Stress-test before assuming the spread holds.
Location & tenants
- Location reads 65/100 on livability (#683 in NY) — a middle-class / working-renter tenant base. Strengths: housing A+, health & safety A+, cost of living B; Watch: schools D+, crime F, amenities F.
- Johnsburg Central School District (rural): math 50% / reading 45% proficiency, ranked #521 of 755 in NY (top 69%) — families likely to look elsewhere, expect single-tenant / working-renter base with shorter leases.
- Market conditions: 16 active listings in the ZIP; 180 units permitted in Warren County in 2024 (40 in 5+ unit buildings).
Forward outlook
- In year one you build about $22k of equity ($2k loan paydown + $21k appreciation (8.1% local appreciation)).
- Warren County population projected at -19% by 2050 — secular population decline; favor cash flow + early exit over multi-decade hold.
- By year 2, paydown + projected appreciation supports a ~$36k cash-out refi (75% LTV) — recoverable capital for the next deal without selling this one.
Negotiation context
- It's been on market 80 days — a 6% lower offer ($240k) is reasonable based on typical stale-listing flexibility.
Risks & watch-outs
- Watch-outs: built in 1870 — expect roof / HVAC / electrical / plumbing capex.
Questions for the listing agent
- What do current leases actually rent for vs. the listed asking? Can we see a recent rent roll and the last 12 months of T-12 income?
- It's been on market 80 days. Have you received any prior offers? Is the seller open to a 41% concession, seller financing, or rate buy-down credit?
- Built in 1870 — when were the roof, HVAC, electrical panel, plumbing, and water heater last replaced?
- Why hasn't it sold? Are there any deal-killer items the seller is aware of (foundation, flood, title, zoning, code violations)?
- Is there a deadline driving the sale (1031 exchange, divorce, estate, relocation)? That informs how much negotiation room exists.
- Schools are D-rated, which usually means shorter tenancies and higher turnover. Who's the typical renter profile here, and what's been the actual vacancy rate?
- Crime grade is F in this area — have there been break-ins, vandalism, or insurance claims at this property in the last 3 years? What carrier currently insures it and at what premium?
- The area grade is low — what's the realistic commute time and amenity access for the typical tenant pool here? Any planned neighborhood developments (good or bad) we should know about?
- What's the average days-on-market for RENTAL listings here right now (not sales)? A rising rental-DOM trend means longer vacancies and softer asking-rent achievability than the comps imply.
- What's the recent tenant-quality profile in this submarket — average credit score on applications, eviction rate, late-payment / NSF rate, and stable-employment percentage? A property-management company in the area should have these aggregated.
- How much new for-sale + rental construction is in the pipeline within 1–3 miles? Heavy new supply typically softens prices + rents 12–24 months out; constrained supply supports both.
Investment metrics
- 1% rule
- 0.59% ✗
- Cap rate
- 4.18%
- Cash-on-cash
- -7.53%
- DSCR
- 0.66
- GRM
- 14.1
CMA / ARV
- ARV (median comp)
- $414,839
- List price
- $255,000
- Delta
- -38.53%
- Verdict
- UNDERPRICED
- Comps
- 6 within 2.0 mi
Projected returns pro-forma
8.11% appreciation · 3.0% rent growth · sell at horizon
- IRR
- 14.6%
- Equity multiple
- 2.10×
- Total profit
- $78,184
- Equity at exit
- $195,570
- IRR
- 14.4%
- Equity multiple
- 4.47×
- Total profit
- $248,005
- Equity at exit
- $389,973
Cash invested: $71,400 (down + closing). Projections, not guarantees.
Landlord ↔ Tenant lean methodology
- Overall (STATE)
- 15 Strongly Tenant-Friendly
- State New York
- 15 Strongly Tenant-Friendly · D+10
- County
- — inherits STATE
- City
- — inherits STATE
ZIP-level market 12886
- Home prices YoY
- 3.0%
- Active inventory
- 16
- Price-to-rent
- 14.1×
Monthly cashflow live
- Estimated rent
- $1,505 medium interval (Pro) →
- Mortgage (P&I)
- −$1,337
- Tax from tax record
- −$193 /mo · $2,322/yr
- Insurance
- −$106
- HOA
- −$0
- Vacancy / Maint / Mgmt
- −$316
- Net cashflow
- $-448
Break-even live
Sensitivity live
| Price | -10% $-304 | -5% $-376 | +0% $-448 | +5% $-520 | +10% $-592 |
|---|---|---|---|---|---|
| Rent | -10% $-567 | -5% $-508 | +0% $-448 | +5% $-389 | +10% $-329 |
| Rate | -1.0pp $-320 | -0.5pp $-383 | base $-448 | +0.5pp $-514 | +1.0pp $-581 |
UW: 25.0% down · 7.5% · 30yr · 1.5% tax · 5.0% vac · 8.0% maint · 8.0% mgmt
Financing live
Cash to close
- Down payment
- $63,750
- Closing costs
- $7,650
- Reserves months
- —
- Total cash needed
- —
Loan-product check · same deal, 3 products live
Conventional
25% down · 7.5% · 30yr
- Down + closing
- —
- Monthly P&I
- —
- Monthly cashflow
- —
- DSCR
- —
- Eligible?
- —
Personal DTI + credit; lowest rate.
DSCR
20% down · 8.5% · 30yr
- Down + closing
- —
- Monthly P&I
- —
- Monthly cashflow
- —
- DSCR
- —
- Eligible?
- —
No personal income docs; deal must DSCR.
Hard money
10% down · 12.0% · 12mo
- Down + closing
- —
- Monthly P&I
- —
- Monthly cashflow
- —
- DSCR
- —
- Eligible?
- —
Short-term bridge; refi at stabilization.
Listing history 19 events
-
2026-06-22days on market $255,000 Active 80 DOM
-
2026-06-21days on market $255,000 Active 79 DOM
-
2026-06-21days on market $255,000 Active 78 DOM
-
2026-06-18days on market $255,000 Active 76 DOM
-
2026-06-17days on market $255,000 Active 75 DOM
-
2026-06-16days on market $255,000 Active 74 DOM
-
2026-06-15days on market $255,000 Active 73 DOM
-
2026-06-13days on market $255,000 Active 71 DOM
-
2026-06-12days on market $255,000 Active 70 DOM
-
2026-06-09days on market $255,000 Active 67 DOM
-
2026-06-08days on market $255,000 Active 66 DOM
-
2026-06-07days on market $255,000 Active 65 DOM
-
2026-06-05days on market $255,000 Active 63 DOM
-
2026-06-04remarks 699-char remark
-
2026-06-04days on market $255,000 Active 61 DOM
-
2026-06-02days on market $255,000 Active 60 DOM
-
2026-06-01days on market $255,000 Active 59 DOM
-
2026-05-31days on market $255,000 Active 58 DOM
-
2026-04-03$255,000 Active 875-char remark
Show marketing remark (875 chars)
Attention first time homebuyers, Skiers & Adirondack Area Enthusiasts and/or anyone looking for a home to create memories. Come see this ''neat and clean'' home. Originally built in the 1860's and owned and lovingly cared for by one family for over 50 years. In recent years, the home has seen new plumbing, heating, and wiring, with recent full interior new painting. Structurally very sound. The home has 4 bedrooms, with upstairs guest living area, 2 bathrooms, handicap accessible, bright sunny kitchen, stand-up attic space for extra storage room and creation of another room, full basement, perennial garden. Enjoy easy access to Adirondack recreation, Gore Ski area, hiking trails, area lakes and Hudson River. Septic and drilled well in up-to-date condition. Located and bordered on two NYS roads allows for easy access in all directions. Priced at $255,000.00
ⓘ Source: listings_history table (triggers on properties + properties_extension) + one-shot
backfill from property_details.listing_events for pre-trigger history.
Tax reassessment forecast NY · Partial reset (capped growth)
- Current annual tax
- $2,322 · $193/mo
- Projected year-2 tax
- $3,316 · $276/mo
- Expected delta
- +$994/yr (+$83/mo · 42.8%)
ⓘ Screening estimate from a state-policy table — verify with the county assessor before closing.
Climate risk First Street
- Flood 1/10 Low FEMA zone X · 0% chance over 30 yrs
- Wildfire 4/10 Moderate
- Heat 1/10 Low 7 d/yr ≥89°F today · 17 d/yr by 30 yrs out
- Wind 2/10 Low 100% chance of damaging wind over 30 yrs
- Air quality 1/10 Low 0 unhealthy d/yr today · 0 by 30 yrs out
Nearby sold comps map
Loading sold comps map…
Walkable amenities ~0.75 mi
Loading nearby amenities…
Taxation est. · year 1
- Rental income
- $18,060
- − Mortgage interest
- −$14,284
- − Property taxes
- −$2,322
- − Insurance
- −$1,275
- − Repairs & maintenance
- −$1,445
- − Management
- −$1,445
- − Depreciation
- −$7,418
- Taxable loss
- −$10,129
- Est. tax savings @ 24.0%
- +$2,431
- After-tax cash flow
- $-2,946/yr
For passive investors: Depreciation is non-cash, so a rental often shows a tax loss while cash-flowing — sheltering income. Rental losses are passive: they offset passive income freely, and up to $25,000/yr can offset ordinary (W-2) income if you actively participate and your MAGI is under $100k (phasing out to $0 by $150k); unused losses carry forward. On sale, claimed depreciation is recaptured at up to 25%, and gains may owe capital-gains tax (a 1031 exchange can defer both). Figures are a year-1 estimate at your 24.0% rate — not tax advice; consult a CPA.
Schools (NCES district)
- District
- Johnsburg Central School District
- NCES district ID
- 3615870
- Math proficiency
- 50% ▬ 0.00%
- Reading proficiency
- 45% ▼ -5.00%
- Median HH income
- $45,308
- Composite
- 42.4/100
- National rank
- #6915
- State rank
- #521 of 755 in NY
Livability — North Creek
- Score
- 65/100
- State rank
- #683
- US rank
- #12939
Category grades
Schools grade is shown separately in the Schools card above.
Census & demographics
- Population (ZIP)
- 199
Population outlook (Warren County) Hauer SSP2
- Today (2025)
- 62,372 people
- By 2030
- 60,491 · -3.0%
- By 2040
- 55,616 · -10.8%
- By 2050
- 50,437 · -19.1%
- By 2075
- 40,843 · -34.5%
- By 2100
- 31,159 · -50.0%
Race, ethnicity, and origin ACS 2023
- Neighborhood character
- Predominantly White (81%)
- Race & ethnicity
- White 81% Two or more races 13% Black 7% Hispanic / Latino 2%
- Common ancestry
- Iranian 14% Slovak 5%
Political lean MEDSL · Warren
- 2024 margin
- Toss-up / Even · D 47.9% · R 52.1%
- 2008→2024 swing
- -6.9pp toward R · 2008: 2.6pp · 2024: -4.2pp
- All cycles
- 2024: R+4.2 2020: R+0.2 2016: R+10.6 2012: D+2.1 2008: D+2.6
Not yet ingested
- Civics
- —
Market trends
- HPI YoY
- ▲ 8.11%
- Current HPI
- 279.7862
- Rent YoY
- —
- Metro
- —
- State GDP YoY
- ▲ 2.60%
- F500 in state
- 92
Industry mix (Fortune 500 HQ in NY)
| Industry | F500 HQs | Revenue |
|---|---|---|
| Financial Services | 10 | $950B |
|
||
| Consumer Goods | 9 | $162B |
|
||
| Insurance | 4 | $225B |
|
||
| Telecommunications | 2 | $144B |
|
||
| Pharmaceuticals | 2 | $112B |
|
||
| Media / Entertainment | 2 | $69B |
|
||
Price history
1 event — show timeline
- 2026-04-03 Listed $255,000 Global MLS
Property tax history
+4.7%/yrLatest (2025): $2,322 · +27.9% YoY. Source: county tax records.
Cash-flow waterfall
monthlySold comps — $/sqft
last 12 mo · ≤1 miLoading sold comps…