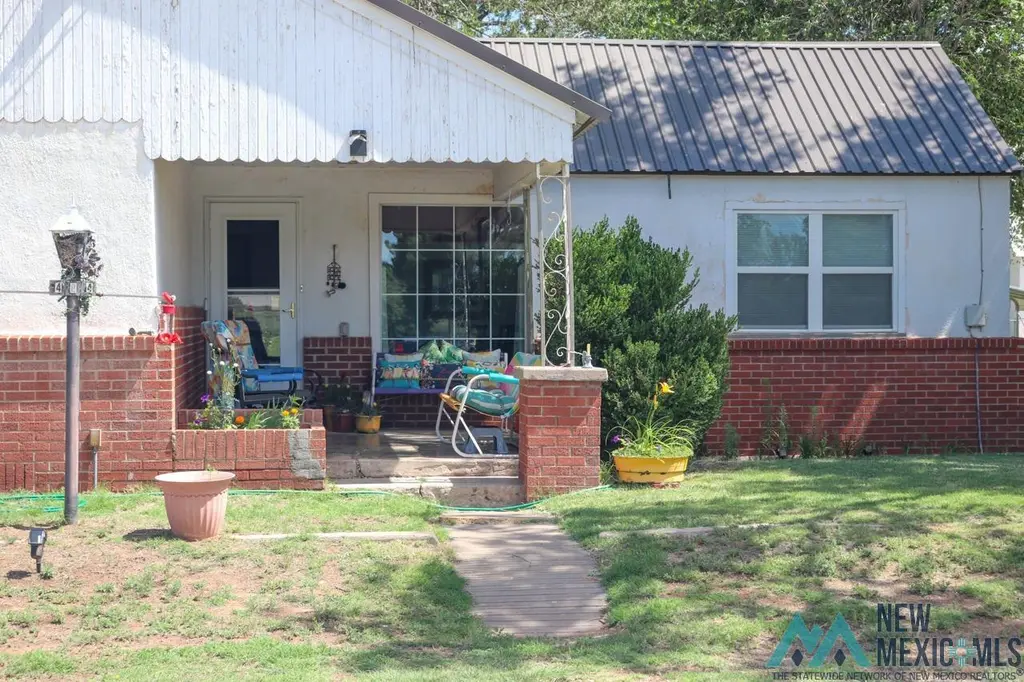
404 Turner St · Elida, NM
Flood risk 1/10 · Minimal
- FEMA flood zone
- D
- Chance of flooding over 30 yrs
- 0.0%
- Est. flood insurance / yr
- $544 – $1,084
Fire risk 9/10 · Severe
- Est. fire insurance / yr
- $706 – $1,312
Heat risk 5/10 · Moderate
- Hot days now (above 97°F)
- 5 days/yr
- Hot days in 30 yrs
- 15 days/yr
Wind risk 2/10 · Minimal
- Chance of severe wind over 30 yrs
- —
Air-quality risk 1/10 · Minimal
- Unhealthy air days now
- 0 days/yr
- Unhealthy air days in 30 yrs
- 0 days/yr
Risk factors via First Street. Map © Google.
Why this score? — see what drove the C+ grade
The composite is a weighted blend of 9 inputs, each scored 0–100. Each bar is that input's sub-score; the figure is the points it added to the 100-point composite (weight × sub-score).
- Cash flow +25.0/30.0
- DSCR +8.1/10.0
- ARV discount +7.5/15.0
- 1% rule +5.2/10.0
- Appreciation +5.0/10.0
- Livability +2.8/5.0
- Rent growth +2.5/5.0
- Condition / age +2.5/5.0
- Schools +2.1/10.0
$119,900
🖨 Deal sheet 📄 Offer letter ✓ Due diligence
Listing remarks MLS
Welcome to this charming home that is an opportunity for those seeking a comfortable home in a quiet town. 1703 sq feet of living space offers ample room for your family. Only 23 miles from Portales. This home has been treated with love. .. lots of upgrades. Beautiful kitchen cabinets, updated flooring, windows. Come tour this beautiful home!
Key facts
- Updated flooring
- New windows
- 9,530 sq ft lot
Tags
Neighborhood map
What this means for you Summary
Snapshot
- This is a 3-bed/2.0-bath other listed at $120k.
Deal economics
- At list price, monthly cash flow is $260 ($3k/yr) — positive.
- The deal already cash-flows at list — no discount required.
- Meets the 1% rule at list price ($1k rent vs $120k).
- Recommended offer: $106k (12.0% below list) — sets the bar for market timing.
Location & tenants
- Location reads 56/100 on livability (#184 in NM) — a working-class tenant base; expect higher turnover. Strengths: cost of living A+; Watch: health & safety C-, schools F, crime F.
- Elida Municipal Schools (rural): math 25% / reading 25% proficiency, ranked #23 of 29 in NM (top 79%) — low school quality limits family demand, transient renter base, plan for 1-2y turnover.
- Market conditions: 1 active listings in the ZIP; 31 units permitted in Roosevelt County in 2024 (0 in 5+ unit buildings).
Forward outlook
- In year one you build about $4k of equity ($829 loan paydown + $4k appreciation (3.0% local appreciation)).
- Roosevelt County population projected at -28% by 2050 — secular population decline; favor cash flow + early exit over multi-decade hold.
- At projected returns (3.0% appreciation + 3.0% rent growth), your $34k cash investment doubles in ~5 years — after that, you're playing with house money.
- By year 8, paydown + projected appreciation supports a ~$33k cash-out refi (75% LTV) — recoverable capital for the next deal without selling this one.
Negotiation context
- It's been on market 686 days — a 12% lower offer ($106k) is reasonable based on typical stale-listing flexibility.
Risks & watch-outs
- Climate carrying-cost: severe wildfire risk; extreme-heat days projected 5→15/yr by 2055 (HVAC capex compounding) — expect insurance premiums to compound above CPI over the hold.
Questions for the listing agent
- It's been on market 686 days. Have you received any prior offers? Is the seller open to a 12% concession, seller financing, or rate buy-down credit?
- Why hasn't it sold? Are there any deal-killer items the seller is aware of (foundation, flood, title, zoning, code violations)?
- Is there a deadline driving the sale (1031 exchange, divorce, estate, relocation)? That informs how much negotiation room exists.
- Schools are F-rated, which usually means shorter tenancies and higher turnover. Who's the typical renter profile here, and what's been the actual vacancy rate?
- Crime grade is F in this area — have there been break-ins, vandalism, or insurance claims at this property in the last 3 years? What carrier currently insures it and at what premium?
- What's the average days-on-market for RENTAL listings here right now (not sales)? A rising rental-DOM trend means longer vacancies and softer asking-rent achievability than the comps imply.
- What's the recent tenant-quality profile in this submarket — average credit score on applications, eviction rate, late-payment / NSF rate, and stable-employment percentage? A property-management company in the area should have these aggregated.
- How much new for-sale + rental construction is in the pipeline within 1–3 miles? Heavy new supply typically softens prices + rents 12–24 months out; constrained supply supports both.
Investment metrics
- 1% rule
- 1.02% ✓
- Cap rate
- 8.89%
- Cash-on-cash
- 9.29%
- DSCR
- 1.41
- GRM
- 8.2
CMA / ARV
No comps found within radius.
Projected returns pro-forma
3.0% appreciation · 3.0% rent growth · sell at horizon
- IRR
- 16.2%
- Equity multiple
- 1.92×
- Total profit
- $30,943
- Equity at exit
- $53,912
- IRR
- 17.7%
- Equity multiple
- 3.59×
- Total profit
- $86,886
- Equity at exit
- $83,085
Cash invested: $33,572 (down + closing). Projections, not guarantees.
Landlord ↔ Tenant lean methodology
- Overall (STATE)
- 55 Moderately Landlord-Leaning
- State New Mexico
- 55 Moderately Landlord-Leaning · D+3
- County
- — inherits STATE
- City
- — inherits STATE
ZIP-level market 88116
- Active inventory
- 1
- Price-to-rent
- 8.2×
Monthly cashflow live
- Estimated rent
- $1,219 medium interval (Pro) →
- Mortgage (P&I)
- −$629
- Tax from tax record
- −$24 /mo · $288/yr
- Insurance
- −$50
- HOA
- −$0
- Vacancy / Maint / Mgmt
- −$256
- Net cashflow
- $260
Break-even live
UW: 25.0% down · 7.5% · 30yr · 1.5% tax · 5.0% vac · 8.0% maint · 8.0% mgmt
Financing live
Cash to close
- Down payment
- $29,975
- Closing costs
- $3,597
- Reserves months
- —
- Total cash needed
- —
Loan-product check · same deal, 3 products live
Conventional
25% down · 7.5% · 30yr
- Down + closing
- —
- Monthly P&I
- —
- Monthly cashflow
- —
- DSCR
- —
- Eligible?
- —
Personal DTI + credit; lowest rate.
DSCR
20% down · 8.5% · 30yr
- Down + closing
- —
- Monthly P&I
- —
- Monthly cashflow
- —
- DSCR
- —
- Eligible?
- —
No personal income docs; deal must DSCR.
Hard money
10% down · 12.0% · 12mo
- Down + closing
- —
- Monthly P&I
- —
- Monthly cashflow
- —
- DSCR
- —
- Eligible?
- —
Short-term bridge; refi at stabilization.
Listing history 9 events
-
2026-06-08status $119,900 Pending 686 DOM
-
2026-06-07days on market $119,900 Active 686 DOM
-
2026-06-03days on market $119,900 Active 682 DOM
-
2026-06-02days on market $119,900 Active 681 DOM
-
2026-06-01days on market $119,900 Active 680 DOM
-
2026-05-31days on market $119,900 Active 679 DOM
-
2026-05-30days on market $119,900 Active 678 DOM
-
2025-06-29price $119,900 344-char remark
Show marketing remark (344 chars)
Welcome to this charming home that is an opportunity for those seeking a comfortable home in a quiet town. 1703 sq feet of living space offers ample room for your family. Only 23 miles from Portales. This home has been treated with love. .. lots of upgrades. Beautiful kitchen cabinets, updated flooring, windows. Come tour this beautiful home!
-
2024-07-15$125,000 Active 344-char remark
Show marketing remark (344 chars)
Welcome to this charming home that is an opportunity for those seeking a comfortable home in a quiet town. 1703 sq feet of living space offers ample room for your family. Only 23 miles from Portales. This home has been treated with love. .. lots of upgrades. Beautiful kitchen cabinets, updated flooring, windows. Come tour this beautiful home!
ⓘ Source: listings_history table (triggers on properties + properties_extension) + one-shot
backfill from property_details.listing_events for pre-trigger history.
Tax reassessment forecast NM · Resets to sale price
- Current annual tax
- $288 · $24/mo
- Projected year-2 tax
- $959 · $80/mo
- Expected delta
- +$672/yr (+$56/mo · 233.6%)
ⓘ Screening estimate from a state-policy table — verify with the county assessor before closing.
Climate risk First Street
- Flood 1/10 Low FEMA zone D · 0% chance over 30 yrs
- Wildfire 9/10 Extreme
- Heat 5/10 Major 5 d/yr ≥97°F today · 15 d/yr by 30 yrs out
- Wind 2/10 Low
- Air quality 1/10 Low 0 unhealthy d/yr today · 0 by 30 yrs out
Nearby sold comps map
Loading sold comps map…
Walkable amenities ~0.75 mi
Loading nearby amenities…
Taxation est. · year 1
- Rental income
- $14,623
- − Mortgage interest
- −$6,716
- − Property taxes
- −$288
- − Insurance
- −$600
- − Repairs & maintenance
- −$1,170
- − Management
- −$1,170
- − Depreciation
- −$3,488
- Taxable income
- $1,192
- Est. tax owed @ 24.0%
- −$286
- After-tax cash flow
- $2,834/yr
For passive investors: Depreciation is non-cash, so a rental often shows a tax loss while cash-flowing — sheltering income. Rental losses are passive: they offset passive income freely, and up to $25,000/yr can offset ordinary (W-2) income if you actively participate and your MAGI is under $100k (phasing out to $0 by $150k); unused losses carry forward. On sale, claimed depreciation is recaptured at up to 25%, and gains may owe capital-gains tax (a 1031 exchange can defer both). Figures are a year-1 estimate at your 24.0% rate — not tax advice; consult a CPA.
Schools (NCES district)
- District
- Elida Municipal Schools
- NCES district ID
- 3500840
- Math proficiency
- 25% ▬ 0.00%
- Reading proficiency
- 25% ▼ -5.00%
- Median HH income
- $41,053
- Composite
- 21.21/100
- National rank
- #8410
- State rank
- #23 of 29 in NM
Livability — Elida
- Score
- 56/100
- State rank
- #184
- US rank
- #22696
Category grades
Schools grade is shown separately in the Schools card above.
Census & demographics
- Census place
- Elida, NM
- Population (ZIP)
- 394
Population outlook (Roosevelt County) Hauer SSP2
- Today (2025)
- 16,821 people
- By 2030
- 15,818 · -6.0%
- By 2040
- 13,766 · -18.2%
- By 2050
- 12,152 · -27.8%
- By 2075
- 9,601 · -42.9%
- By 2100
- 8,241 · -51.0%
Race, ethnicity, and origin ACS 2023
- Neighborhood character
- Predominantly White (78%)
- Race & ethnicity
- White 78% Hispanic / Latino 21% Two or more races 5%
- Hispanic origin (detail)
- Mexican 20%
- Common ancestry
- Iranian 3% Italian 3% Russian 2%
- Foreign-born
- 8% · Canada
- Languages at home
- 84% English-only · Spanish 16%
Political lean MEDSL · Roosevelt
- 2024 margin
- Solid R (+43.2) · D 27.4% · R 70.6% · Other 2.0%
- 2008→2024 swing
- -13.3pp toward R · 2008: -29.9pp · 2024: -43.2pp
- All cycles
- 2024: R+43.2 2020: R+42.9 2016: R+41.3 2012: R+38.9 2008: R+29.9
Not yet ingested
- Civics
- —
Market trends
- HPI YoY
- —
- Current HPI
- —
- Rent YoY
- —
- Metro
- —
- State GDP YoY
- —
- F500 in state
- 0
Price history
-4.1% since first listed2 events — show timeline
- 2025-06-29 Price Changed $119,900 NMMLS
- 2024-07-15 Listed $125,000 NMMLS
Property tax history
+0.8%/yrLatest (2025): $288 · +2.1% YoY. Source: county tax records.
Cash-flow waterfall
monthlySold comps — $/sqft
last 12 mo · ≤1 miLoading sold comps…