1829 R Whittaker Rd · Dunmor, KY
Flood risk 1/10 · Minimal
- FEMA flood zone
- X (unshaded)
- Chance of flooding over 30 yrs
- 0.0%
- Est. flood insurance / yr
- $507 – $1,088
Fire risk 3/10 · Minor
- Est. fire insurance / yr
- $839 – $1,559
Heat risk 4/10 · Minor
- Hot days now (above 108°F)
- 7 days/yr
- Hot days in 30 yrs
- 17 days/yr
Wind risk 3/10 · Minor
- Chance of severe wind over 30 yrs
- 7.0%
Air-quality risk 2/10 · Minimal
- Unhealthy air days now
- 1 days/yr
- Unhealthy air days in 30 yrs
- 1 days/yr
Risk factors via First Street. Map © Google.
Why this score? — see what drove the D- grade
The composite is a weighted blend of 9 inputs, each scored 0–100. Each bar is that input's sub-score; the figure is the points it added to the 100-point composite (weight × sub-score).
- Cash flow +9.9/30.0
- ARV discount +7.5/15.0
- Appreciation +5.0/10.0
- Schools +3.3/10.0
- Livability +3.2/5.0
- 1% rule +3.0/10.0
- DSCR +2.8/10.0
- Rent growth +2.5/5.0
- Condition / age +2.5/5.0
$105,000
🖨 Deal sheet (PDF) 📄 Offer letter ✓ Due diligence
Listing remarks MLS
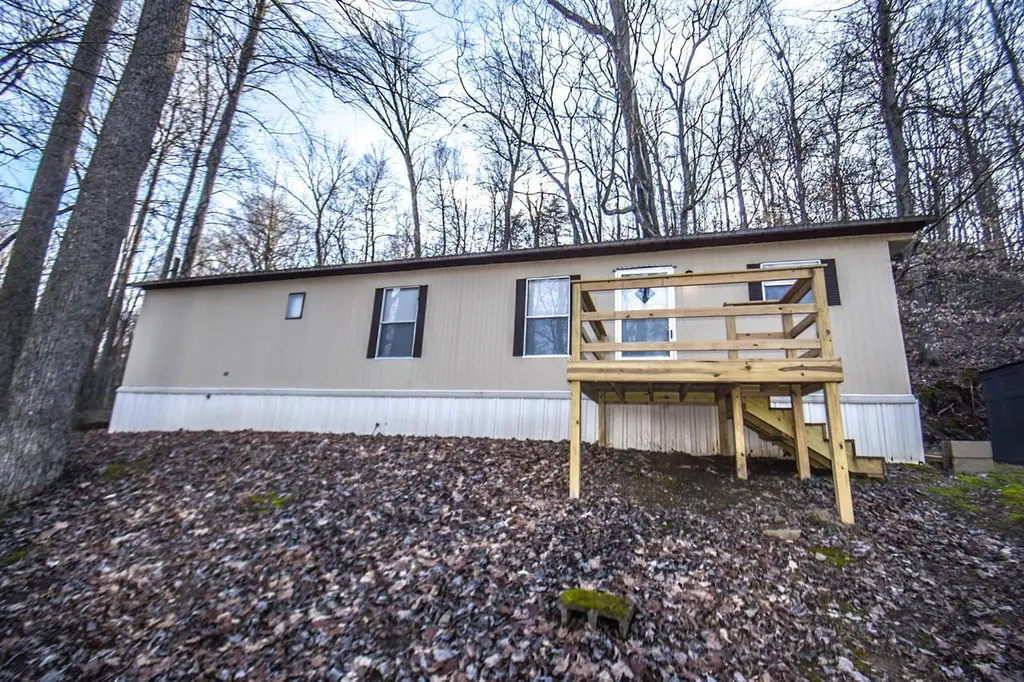
Well-maintained, move-in ready, affordable Lake Home! Escape to peaceful and affordable lake living, without sacrificing convenience. Enjoy the lake views from your front porch, or relax in the privacy of your own backyard. Unique and natural rocks throughout the backyard, like you've never seen. within 30 miles of shopping, dining, schools, and healthcare. Perfect as a weekend retreat or full-time home, a rare find at around $100,000.
Key facts
- Lake views
- Privacy of backyard
- Unique natural rocks
Tags
Neighborhood map
What this means for you Summary
Snapshot
- This is a 2-bed/1.0-bath other listed at $105k.
Deal economics
- At list price, monthly cash flow is $-65 ($-775/yr) — negative.
- To cash-flow at today's rent, offer at most $96k (8.9% below list).
- To meet the 1% rule (rent ≥ 1% of price), the offer needs to be $84k (20.3% below list).
- Recommended offer: $84k (20.3% below list) — sets the bar for 1% rule.
- Cap rate 5.6% vs local median 2.5% in Dunmor — top-decile yield for the area; either an underpriced asset or a hidden risk that comps aren't pricing in. Stress-test before assuming the spread holds.
Location & tenants
- Location reads 65/100 on livability (#279 in KY) — a middle-class / working-renter tenant base. Strengths: employment A+, cost of living A+, housing A+; Watch: amenities F, commute F, health & safety F.
- Logan County (rural): math 35% / reading 44% proficiency, ranked #32 of 165 in KY (top 19%) — families likely to look elsewhere, expect single-tenant / working-renter base with shorter leases.
- Zoned schools: Lewisburg Elementary School (math 41% / reading 43%, grade F, #178 of 676 statewide, top 29%, 484 students, 64% FRL); Logan County High School (math 32% / reading 54%, grade F, #30 of 254 statewide, top 12%, 953 students, 47% FRL).
- Market conditions: 66 active listings in the ZIP; 30 units permitted in Logan County in 2024 (0 in 5+ unit buildings).
Forward outlook
- In year one you build about $766 of equity ($726 loan paydown + $40 appreciation (0.0% local appreciation)).
- Logan County population projected at -13% by 2050 — secular population decline; favor cash flow + early exit over multi-decade hold.
Negotiation context
- It's been on market 159 days — a 12% lower offer ($92k) is reasonable based on typical stale-listing flexibility.
- 3 sale attempts since 9y ago; this cycle's ask has dropped $15k (12%) from the opening price — seller is motivated, your offer sets the floor, not the list.
- Current owner paid $10k; list at $105k implies a 950% gain — meaningful room to come down on a strong offer.
Questions for the listing agent
- What do current leases actually rent for vs. the listed asking? Can we see a recent rent roll and the last 12 months of T-12 income?
- It's been on market 159 days. Have you received any prior offers? Is the seller open to a 20% concession, seller financing, or rate buy-down credit?
- Why hasn't it sold? Are there any deal-killer items the seller is aware of (foundation, flood, title, zoning, code violations)?
- Is there a deadline driving the sale (1031 exchange, divorce, estate, relocation)? That informs how much negotiation room exists.
- Schools are F-rated, which usually means shorter tenancies and higher turnover. Who's the typical renter profile here, and what's been the actual vacancy rate?
- The area grade is low — what's the realistic commute time and amenity access for the typical tenant pool here? Any planned neighborhood developments (good or bad) we should know about?
- What's the average days-on-market for RENTAL listings here right now (not sales)? A rising rental-DOM trend means longer vacancies and softer asking-rent achievability than the comps imply.
- What's the recent tenant-quality profile in this submarket — average credit score on applications, eviction rate, late-payment / NSF rate, and stable-employment percentage? A property-management company in the area should have these aggregated.
- How much new for-sale + rental construction is in the pipeline within 1–3 miles? Heavy new supply typically softens prices + rents 12–24 months out; constrained supply supports both.
Investment metrics
- 1% rule
- 0.80% ✗
- Cap rate
- 5.56%
- Cash-on-cash
- -2.63%
- DSCR
- 0.88
- GRM
- 10.5
CMA / ARV
No comps found within radius.
Projected returns pro-forma
0.04% appreciation · 3.0% rent growth · sell at horizon
- IRR
- -5.0%
- Equity multiple
- 0.76×
- Total profit
- $-6,981
- Equity at exit
- $30,690
- IRR
- 0.8%
- Equity multiple
- 1.09×
- Total profit
- $2,667
- Equity at exit
- $37,052
Cash invested: $29,400 (down + closing). Projections, not guarantees.
Landlord ↔ Tenant lean methodology
- Overall (STATE)
- 83 Strongly Landlord-Friendly
- State Kentucky
- 83 Strongly Landlord-Friendly · R+16
- County
- — inherits STATE
- City
- — inherits STATE
ZIP-level market 42256
- Home prices YoY
- 0.0%
- Active inventory
- 66
- Price-to-rent
- 10.5×
Monthly cashflow live
- Estimated rent
- $837 medium interval (Pro) →
- Mortgage (P&I)
- −$551
- Tax est. 1.5%
- −$131 /mo · $1,575/yr
- Insurance
- −$44
- HOA
- −$0
- Vacancy / Maint / Mgmt
- −$176
- Net cashflow
- $-65
Break-even live
Sensitivity live
| Price | -10% $8 | -5% $-28 | +0% $-65 | +5% $-101 | +10% $-137 |
|---|---|---|---|---|---|
| Rent | -10% $-131 | -5% $-98 | +0% $-65 | +5% $-31 | +10% $2 |
| Rate | -1.0pp $-12 | -0.5pp $-38 | base $-65 | +0.5pp $-92 | +1.0pp $-119 |
UW: 25.0% down · 7.5% · 30yr · 1.5% tax · 5.0% vac · 8.0% maint · 8.0% mgmt
Financing live
Cash to close
- Down payment
- $26,250
- Closing costs
- $3,150
- Reserves months
- —
- Total cash needed
- —
Loan-product check · same deal, 3 products live
Conventional
25% down · 7.5% · 30yr
- Down + closing
- —
- Monthly P&I
- —
- Monthly cashflow
- —
- DSCR
- —
- Eligible?
- —
Personal DTI + credit; lowest rate.
DSCR
20% down · 8.5% · 30yr
- Down + closing
- —
- Monthly P&I
- —
- Monthly cashflow
- —
- DSCR
- —
- Eligible?
- —
No personal income docs; deal must DSCR.
Hard money
10% down · 12.0% · 12mo
- Down + closing
- —
- Monthly P&I
- —
- Monthly cashflow
- —
- DSCR
- —
- Eligible?
- —
Short-term bridge; refi at stabilization.
Listing history 23 events
-
2026-06-21days on market $105,000 Active 159 DOM
-
2026-06-18days on market $105,000 Active 156 DOM
-
2026-06-17days on market $105,000 Active 155 DOM
-
2026-06-16days on market $105,000 Active 154 DOM
-
2026-06-15days on market $105,000 Active 153 DOM
-
2026-06-14days on market $105,000 Active 151 DOM
-
2026-06-13days on market $105,000 Active 150 DOM
-
2026-06-10days on market $105,000 Active 148 DOM
-
2026-06-09days on market $105,000 Active 147 DOM
-
2026-06-08days on market $105,000 Active 146 DOM
-
2026-06-07days on market $105,000 Active 145 DOM
-
2026-06-03days on market $105,000 Active 141 DOM
-
2026-06-02days on market $105,000 Active 140 DOM
-
2026-06-01days on market $105,000 Active 139 DOM
-
2026-05-31days on market $105,000 Active 138 DOM
-
2026-05-31days on market $105,000 Active 137 DOM
-
2026-05-20price $105,000 439-char remark
Show marketing remark (439 chars)
Well-maintained, move-in ready, affordable Lake Home! Escape to peaceful and affordable lake living, without sacrificing convenience. Enjoy the lake views from your front porch, or relax in the privacy of your own backyard. Unique and natural rocks throughout the backyard, like you've never seen. within 30 miles of shopping, dining, schools, and healthcare. Perfect as a weekend retreat or full-time home, a rare find at around $100,000.
-
2026-01-13$119,900 Active 439-char remark
Show marketing remark (439 chars)
Well-maintained, move-in ready, affordable Lake Home! Escape to peaceful and affordable lake living, without sacrificing convenience. Enjoy the lake views from your front porch, or relax in the privacy of your own backyard. Unique and natural rocks throughout the backyard, like you've never seen. within 30 miles of shopping, dining, schools, and healthcare. Perfect as a weekend retreat or full-time home, a rare find at around $100,000.
-
2025-06-25$99,900 Active
-
2018-01-22soldstatus $10,000
-
2018-01-22soldstatus $10,000
-
2017-02-18$22,500
-
2001-12-01soldstatus $10,900
ⓘ Source: listings_history table (triggers on properties + properties_extension) + one-shot
backfill from property_details.listing_events for pre-trigger history.
Climate risk First Street
- Flood 1/10 Low FEMA zone X (unshaded) · 0% chance over 30 yrs
- Wildfire 3/10 Moderate
- Heat 4/10 Moderate 7 d/yr ≥108°F today · 17 d/yr by 30 yrs out
- Wind 3/10 Moderate 7% chance of damaging wind over 30 yrs
- Air quality 2/10 Low 1 unhealthy d/yr today · 1 by 30 yrs out
Nearby sold comps map
Loading sold comps map…
Walkable amenities ~0.75 mi
Loading nearby amenities…
Taxation est. · year 1
- Rental income
- $10,042
- − Mortgage interest
- −$5,882
- − Property taxes
- −$1,575
- − Insurance
- −$525
- − Repairs & maintenance
- −$803
- − Management
- −$803
- − Depreciation
- −$3,055
- Taxable loss
- −$2,601
- Est. tax savings @ 24.0%
- +$624
- After-tax cash flow
- $-150/yr
For passive investors: Depreciation is non-cash, so a rental often shows a tax loss while cash-flowing — sheltering income. Rental losses are passive: they offset passive income freely, and up to $25,000/yr can offset ordinary (W-2) income if you actively participate and your MAGI is under $100k (phasing out to $0 by $150k); unused losses carry forward. On sale, claimed depreciation is recaptured at up to 25%, and gains may owe capital-gains tax (a 1031 exchange can defer both). Figures are a year-1 estimate at your 24.0% rate — not tax advice; consult a CPA.
Schools (NCES district)
- District
- Logan County
- NCES district ID
- 2103540
- Math proficiency
- 35% ▼ -17.00%
- Reading proficiency
- 44% ▼ -14.00%
- Median HH income
- $42,577
- Composite
- 33.34/100
- National rank
- #5492
- State rank
- #32 of 165 in KY
Livability — Dunmor
- Score
- 65/100
- State rank
- #279
- US rank
- #13588
Category grades
Schools grade is shown separately in the Schools card above.
Census & demographics
- Population (ZIP)
- 5,052
Population outlook (Logan County) Hauer SSP2
- Today (2025)
- 26,133 people
- By 2030
- 25,572 · -2.1%
- By 2040
- 24,247 · -7.2%
- By 2050
- 22,849 · -12.6%
- By 2075
- 19,587 · -25.0%
- By 2100
- 15,927 · -39.1%
Race, ethnicity, and origin ACS 2023
- Neighborhood character
- Predominantly White (95%)
- Race & ethnicity
- White 95% Hispanic / Latino 3% Two or more races 2%
- Common ancestry
- Italian 2% Slovak 1% Romanian 1%
- Foreign-born
- 0%
- Languages at home
- 96% English-only · German/W. Germanic 2% Russian/Polish/Slavic 1% Other Indo-European 1%
Political lean MEDSL · Logan
- 2024 margin
- Solid R (+55.1) · D 21.9% · R 76.9% · Other 1.2%
- 2008→2024 swing
- -26.5pp toward R · 2008: -28.6pp · 2024: -55.1pp
- All cycles
- 2024: R+55.1 2020: R+48.4 2016: R+46.1 2012: R+32.6 2008: R+28.6
Not yet ingested
- Civics
- —
Market trends
- HPI YoY
- ▬ 0.04%
- Current HPI
- 265.4274
- Rent YoY
- —
- Metro
- —
- State GDP YoY
- ▲ 1.81%
- F500 in state
- 4
Industry mix (Fortune 500 HQ in KY)
| Industry | F500 HQs | Revenue |
|---|---|---|
| Healthcare | 1 | $118B |
|
||
| Food / Beverage | 1 | $7B |
|
||
Price history
+863.3% since first listed7 events — show timeline
- 2026-05-20 Price Changed $105,000 RASKMLS
- 2026-01-13 Listed $119,900 RASKMLS
- 2025-06-25 Listed $99,900 RASKMLS
- 2018-01-22 Sold (Public Records) $10,000 Public Records
- 2018-01-22 Sold (MLS) $10,000 RASKMLS
- 2017-02-18 Listed $22,500 RASKMLS
- 2001-12-01 Sold (Public Records) $10,900 Public Records
Property tax history
+0.0%/yrLatest (2025): $88 · -0.8% YoY. Source: county tax records.
Cash-flow waterfall
monthlySold comps — $/sqft
last 12 mo · ≤1 miLoading sold comps…