 Triplex
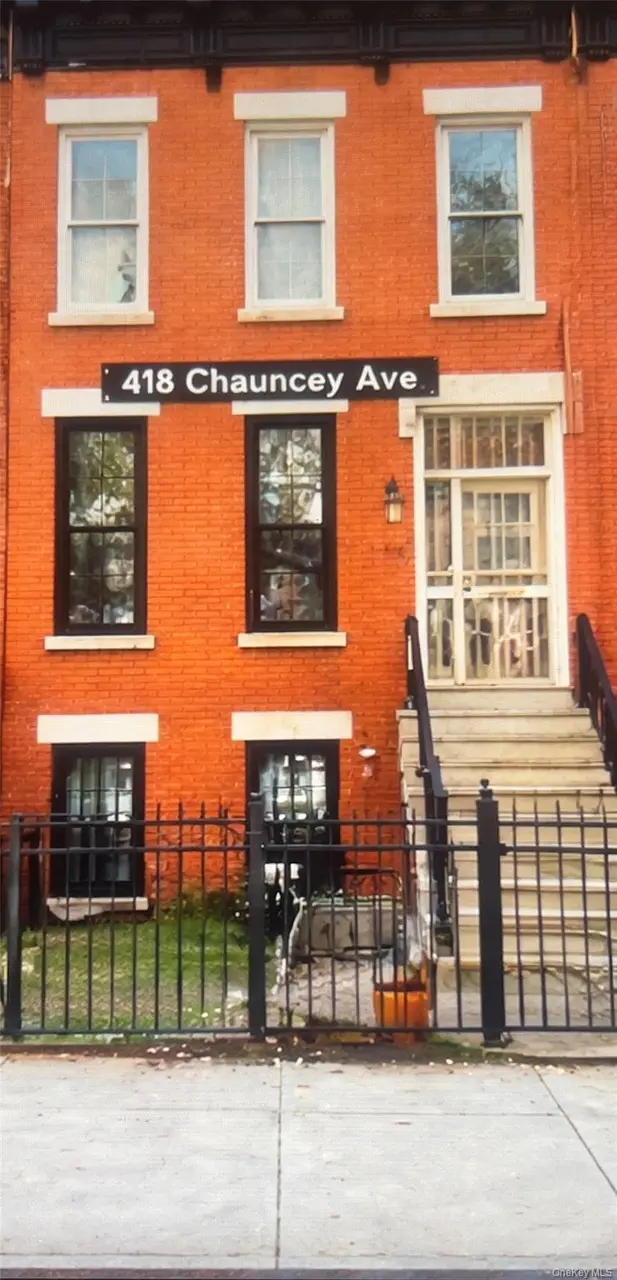
418 Chauncey St · New York, NY
Flood risk 1/10 · Minimal
- FEMA flood zone
- X (unshaded)
- Chance of flooding over 30 yrs
- 0.0%
- Est. flood insurance / yr
- $507 – $1,088
Fire risk 1/10 · Minimal
- Est. fire insurance / yr
- $691 – $1,283
Heat risk 6/10 · Moderate
- Hot days now (above 99°F)
- 7 days/yr
- Hot days in 30 yrs
- 15 days/yr
Wind risk 6/10 · Moderate
- Chance of severe wind over 30 yrs
- 39.0%
Air-quality risk 5/10 · Moderate
- Unhealthy air days now
- 6 days/yr
- Unhealthy air days in 30 yrs
- 8 days/yr
Risk factors via First Street. Map © Google.
Why this score? — see what drove the C grade
The composite is a weighted blend of 9 inputs, each scored 0–100. Each bar is that input's sub-score; the figure is the points it added to the 100-point composite (weight × sub-score).
- Cash flow +16.9/30.0
- Appreciation +10.0/10.0
- ARV discount +7.5/15.0
- DSCR +5.3/10.0
- Schools +5.0/10.0
- Rent growth +4.1/5.0
- Livability +3.8/5.0
- 1% rule +3.3/10.0
- Condition / age +2.5/5.0
$1,200,000
🖨 Deal sheet 📄 Offer letter ✓ Due diligence
Multi-family units
County records classify this as Multi-Family (2-4 Unit). Listing-text estimate: 3 units. confirmed
Listing remarks
Welcome to 418 Chauncey Street, a classic three-family brownstone located in the heart of Brooklyn’s rapidly evolving Ocean Hill/Bushwick corridor. Built in 1899, this two-story property offers approximately 2,598 square feet of interior space on a 1,925 square foot lot, presenting a rare opportunity to restore and reimagine a true Brooklyn asset. This property is in need of TLC and is being offered in as-is condition—making it ideal for investors, developers, or end-users looking to create a customized living experience with income-producing potential. With three residential units, the layout lends itself to a variety of strategies including owner-occupancy with rental income,
Key facts
- 1,925 sq ft lot
- Built 1899
- Listed 42 days
Tags
Property features AI
Finance
- Financial info: Tax year 2025
Exterior
- Parking: No carport; No designated parking
- Utilities: Public sewer; Cable connected; Electricity available; Natural gas connected; Public trash collection; Water connected
- Home design: Triplex; Fixer condition; 2,598 total building area
- Construction: Brick construction
- Exterior features: Brick exterior; Not waterfront
Interior
- Bedrooms: Contains one 4-bedroom unit
- Heating & cooling: Hot water heating; Natural gas heating; No central cooling
- Interior features: High ceilings; Washer/dryer hookup
- Laundry & utility: Washer/dryer hookup
Neighborhood map
What this means for you Summary
Snapshot
- This is a 3 × 2-bed/1-bath units multifamily listed at $1.20M.
Deal economics
- At list price, monthly cash flow is $795 ($10k/yr) — positive. Per door: $265/mo.
- The deal already cash-flows at list — no discount required.
- To meet the 1% rule (rent ≥ 1% of price), the offer needs to be $994k (17.2% below list).
- Recommended offer: $994k (17.2% below list) — sets the bar for 1% rule.
- Cap rate 7.1% vs local median 2.6% in New York — top-decile yield for the area; either an underpriced asset or a hidden risk that comps aren't pricing in. Stress-test before assuming the spread holds.
Location & tenants
- Location reads 75/100 on livability (#268 in NY, #4,188 nationally) — a middle-class / working-renter tenant base. Strengths: amenities A+, commute A+, health & safety A; Watch: crime F, cost of living F.
- Market conditions: Rents rising fast (+6.4%/yr); 152 active listings in the ZIP; 10,063 units permitted in Kings County in 2024 (9,789 in 5+ unit buildings).
- At $9,940/mo this rent would consume 191% of the median local household income ($62k/yr) (locally 6960% of renters already pay >50% of income on rent) — very limited rent-growth headroom before tenants either downsize or default.
Forward outlook
- In year one you build about $128k of equity ($8k loan paydown + $120k appreciation (10.0% local appreciation)).
- Kings County population projected at +13% by 2050 — modest demand growth; plan on rents tracking national, not racing it.
- At projected returns (10.0% appreciation + 6.4% rent growth), your $336k cash investment doubles in ~3 years — after that, you're playing with house money.
- By year 2, paydown + projected appreciation supports a ~$206k cash-out refi (75% LTV) — recoverable capital for the next deal without selling this one.
Negotiation context
- It's been on market 42 days — a 3% lower offer ($1.16M) is reasonable based on typical stale-listing flexibility.
- Current owner paid $69k; list at $1.20M implies a 1639% gain — meaningful room to come down on a strong offer.
Risks & watch-outs
- Watch-outs: built in 1899 — expect roof / HVAC / electrical / plumbing capex.
- Climate carrying-cost: major wind risk, 39% chance of damaging wind over 30y; extreme-heat days projected 7→15/yr by 2055 (HVAC capex compounding) — expect insurance premiums to compound above CPI over the hold.
Questions for the listing agent
- It's been on market 42 days. Have you received any prior offers? Is the seller open to a 17% concession, seller financing, or rate buy-down credit?
- Can we see the unit-by-unit rent roll, current vacancy, and any below-market leases? What's the average tenancy length?
- What capital expenditures (roof, boiler, parking lot, exteriors) have been made in the last 5 years, and what's planned in the next 2?
- Built in 1899 — when were the roof, HVAC, electrical panel, plumbing, and water heater last replaced?
- Is there a deadline driving the sale (1031 exchange, divorce, estate, relocation)? That informs how much negotiation room exists.
- Schools are B-rated — typically a magnet for longer-tenancy family renters. What's the average tenant stay here, and is there a school-zone premium baked into asking?
- Crime grade is F in this area — have there been break-ins, vandalism, or insurance claims at this property in the last 3 years? What carrier currently insures it and at what premium?
- What's the average days-on-market for RENTAL listings here right now (not sales)? A rising rental-DOM trend means longer vacancies and softer asking-rent achievability than the comps imply.
- What's the recent tenant-quality profile in this submarket — average credit score on applications, eviction rate, late-payment / NSF rate, and stable-employment percentage? A property-management company in the area should have these aggregated.
- How much new apartment / multifamily construction is in the pipeline within 1–3 miles? Heavy new supply (>2% of stock underway) typically softens rents 12–24 months out; light construction supports rent growth.
Investment metrics
- 1% rule
- 0.83% ✗
- Cap rate
- 7.09%
- Cash-on-cash
- 2.84%
- DSCR
- 1.13
- GRM
- 10.1
CMA / ARV
No comps found within radius.
Projected returns pro-forma
10.0% appreciation · 6.44% rent growth · sell at horizon
- IRR
- 27.4%
- Equity multiple
- 3.20×
- Total profit
- $739,171
- Equity at exit
- $1,081,055
- IRR
- 24.8%
- Equity multiple
- 7.60×
- Total profit
- $2,218,649
- Equity at exit
- $2,331,336
Cash invested: $336,000 (down + closing). Projections, not guarantees.
Landlord ↔ Tenant lean methodology
- Overall (CITY)
- 0 Strongly Tenant-Friendly
- State New York
- 15 Strongly Tenant-Friendly · D+10
- County
- — inherits STATE
- City New York
- 0 Strongly Tenant-Friendly · D+34
ZIP-level market 11233
- Home prices YoY
- 2.9%
- Rents YoY
- 6.4%
- Active inventory
- 152
- Price-to-rent
- 30.2×
Monthly cashflow live
- Estimated rent
- $9,940 high interval (Pro) →
- Mortgage (P&I)
- −$6,293
- Tax from tax record
- −$265 /mo · $3,175/yr
- Insurance
- −$500
- HOA
- −$0
- Vacancy / Maint / Mgmt
- −$2,087
- Net cashflow
- $795
Break-even live
3-unit breakdown (identical units grouped — click to expand)
| Units | Beds | Baths | Est. rent |
|---|---|---|---|
| 3× units | 2 | 1 | $9,942 |
| #1 | 2 | 1 | $3,314 |
| #2 | 2 | 1 | $3,314 |
| #3 | 2 | 1 | $3,314 |
| Total (3 units) | $9,940 | ||
UW: 25.0% down · 7.5% · 30yr · 1.5% tax · 5.0% vac · 8.0% maint · 8.0% mgmt
Financing live
Cash to close
- Down payment
- $300,000
- Closing costs
- $36,000
- Reserves months
- —
- Total cash needed
- —
Loan-product check · same deal, 3 products live
Conventional
25% down · 7.5% · 30yr
- Down + closing
- —
- Monthly P&I
- —
- Monthly cashflow
- —
- DSCR
- —
- Eligible?
- —
Personal DTI + credit; lowest rate.
DSCR
20% down · 8.5% · 30yr
- Down + closing
- —
- Monthly P&I
- —
- Monthly cashflow
- —
- DSCR
- —
- Eligible?
- —
No personal income docs; deal must DSCR.
Hard money
10% down · 12.0% · 12mo
- Down + closing
- —
- Monthly P&I
- —
- Monthly cashflow
- —
- DSCR
- —
- Eligible?
- —
Short-term bridge; refi at stabilization.
Listing history 4 events
-
2026-05-15status Pending
-
2026-04-03$1,200,000 Active
-
1995-03-29soldstatus $69,000
-
1986-04-29soldstatus $47,500
ⓘ Source: listings_history table (triggers on properties + properties_extension) + one-shot
backfill from property_details.listing_events for pre-trigger history.
Tax reassessment forecast NY · Partial reset (capped growth)
- Current annual tax
- $3,175 · $265/mo
- Projected year-2 tax
- $11,728 · $977/mo
- Expected delta
- +$8,552/yr (+$713/mo · 269.3%)
ⓘ Screening estimate from a state-policy table — verify with the county assessor before closing.
Climate risk First Street
- Flood 1/10 Low FEMA zone X (unshaded) · 0% chance over 30 yrs
- Wildfire 1/10 Low
- Heat 6/10 Major 7 d/yr ≥99°F today · 15 d/yr by 30 yrs out
- Wind 6/10 Major 39% chance of damaging wind over 30 yrs
- Air quality 5/10 Major 6 unhealthy d/yr today · 8 by 30 yrs out
Nearby sold comps map
Loading sold comps map…
Walkable amenities ~0.75 mi
Loading nearby amenities…
Taxation est. · year 1
- Rental income
- $119,280
- − Mortgage interest
- −$67,219
- − Property taxes
- −$3,175
- − Insurance
- −$6,000
- − Repairs & maintenance
- −$9,542
- − Management
- −$9,542
- − Depreciation
- −$34,909
- Taxable loss
- −$11,108
- Est. tax savings @ 24.0%
- +$2,666
- After-tax cash flow
- $12,207/yr
For passive investors: Depreciation is non-cash, so a rental often shows a tax loss while cash-flowing — sheltering income. Rental losses are passive: they offset passive income freely, and up to $25,000/yr can offset ordinary (W-2) income if you actively participate and your MAGI is under $100k (phasing out to $0 by $150k); unused losses carry forward. On sale, claimed depreciation is recaptured at up to 25%, and gains may owe capital-gains tax (a 1031 exchange can defer both). Figures are a year-1 estimate at your 24.0% rate — not tax advice; consult a CPA.
Schools (NCES district)
No district data.
Livability — New York
- Score
- 75/100
- State rank
- #268
- US rank
- #4188
Category grades
Schools grade is shown separately in the Schools card above.
Census & demographics
- Census place
- New York, NY
- County
- Kings County · 2,614,986 people
- City population
- 7,731,280
- Metro
- New York-Newark-Jersey City, NY-NJ-PA
- Population (ZIP)
- 81,822
- Household income
- $62,411
- Rent vs Own
- Severe rent burden
- 6960.0
Population outlook (Kings County) Hauer SSP2
- Today (2025)
- 2,847,441 people
- By 2030
- 2,937,006 · +3.1%
- By 2040
- 3,095,491 · +8.7%
- By 2050
- 3,228,968 · +13.4%
- By 2075
- 3,321,723 · +16.7%
- By 2100
- 3,111,387 · +9.3%
Race, ethnicity, and origin ACS 2023
- Neighborhood character
- Predominantly Black (65%)
- Race & ethnicity
- Black 65% Hispanic / Latino 16% White 12% Two or more races 8% Asian 2%
- Hispanic origin (detail)
- Puerto Rican 5% Dominican 5%
- Common ancestry
- Hispanic 1% Romanian 1% Lithuanian 1%
- Foreign-born
- 25% · Canada, Mexico, China
- Languages at home
- 80% English-only · Spanish 12% French/Haitian/Cajun 3% Other Indo-European 1%
Political lean MEDSL · Kings
- 2024 margin
- Solid D (+44.0) · D 72.0% · R 28.0%
- 2008→2024 swing
- -15.5pp toward R · 2008: 59.4pp · 2024: 44.0pp
- All cycles
- 2024: D+44.0 2020: D+54.8 2016: D+61.8 2012: D+63.9 2008: D+59.4
Not yet ingested
- Civics
- —
Market trends
- HPI YoY
- ▲ 18.31%
- Current HPI
- 645.4828
- Rent YoY
- ▲ 6.44%
- Metro
- New York-Newark-Jersey City, NY-NJ-PA
- State GDP YoY
- ▲ 2.60%
- F500 in state
- 92
Industry mix (Fortune 500 HQ in NY)
| Industry | F500 HQs | Revenue |
|---|---|---|
| Financial Services | 10 | $950B |
|
||
| Consumer Goods | 9 | $162B |
|
||
| Insurance | 4 | $225B |
|
||
| Telecommunications | 2 | $144B |
|
||
| Pharmaceuticals | 2 | $112B |
|
||
| Media / Entertainment | 2 | $69B |
|
||
Price history
+2426.3% since first listed4 events — show timeline
- 2026-05-15 Pending — OneKey® MLS as Distributed by MLS Grid
- 2026-04-03 Listed $1,200,000 OneKey® MLS as Distributed by MLS Grid
- 1995-03-29 Sold (Public Records) $69,000 Public Records
- 1986-04-29 Sold (Public Records) $47,500 Public Records
Property tax history
+4.3%/yrLatest (2025): $3,175 · -12.2% YoY. Source: county tax records.
Cash-flow waterfall
monthlySold comps — $/sqft
last 12 mo · ≤1 miLoading sold comps…