 5-Plex
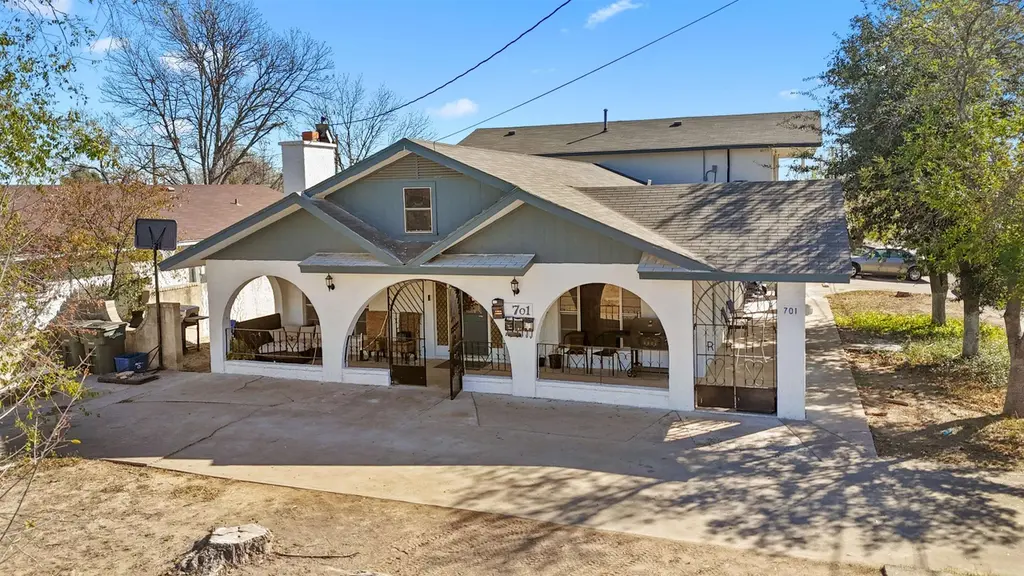
701 E 6th St · Del Rio, TX
Flood risk 1/10 · Minimal
- FEMA flood zone
- X (unshaded)
- Chance of flooding over 30 yrs
- 0.0%
- Est. flood insurance / yr
- $507 – $1,088
Fire risk 6/10 · Moderate
- Est. fire insurance / yr
- $1,222 – $2,270
Heat risk 8/10 · Major
- Hot days now (above 108°F)
- 7 days/yr
- Hot days in 30 yrs
- 23 days/yr
Wind risk 4/10 · Minor
- Chance of severe wind over 30 yrs
- 12.0%
Air-quality risk 1/10 · Minimal
- Unhealthy air days now
- 0 days/yr
- Unhealthy air days in 30 yrs
- 0 days/yr
Risk factors via First Street. Map © Google.
Why this score? — see what drove the B- grade
The composite is a weighted blend of 9 inputs, each scored 0–100. Each bar is that input's sub-score; the figure is the points it added to the 100-point composite (weight × sub-score).
- Cash flow +30.0/30.0
- 1% rule +10.0/10.0
- DSCR +10.0/10.0
- ARV discount +7.5/15.0
- Livability +3.5/5.0
- Rent growth +2.9/5.0
- Condition / age +2.5/5.0
- Schools +2.4/10.0
- Appreciation +0.0/10.0
$259,900
🖨 Deal sheet 📄 Offer letter ✓ Due diligence
Multi-family units
County records classify this as Multi-Family (2-4 Unit). Listing-text estimate: 5 units. estimate disagrees with records
Listing remarks MLS
Unlock the potential of 701 E 6th Street, A versatile 5-unit property designed to generate consistent income for its next owner! Perfectly positioned on a corner lot near Avenue G and Veterans Blvd, this property offers excellent visibility and accessibility in a prime location. Whether you're a seasoned investor or aspiring landlord, this multi-unit gem is a fantastic opportunity to grow your portfolio. Don't miss out-turn your real estate goals into reality with this income-producing property! Main house has 4bedrooms 3 full baths, Three apartments are 2 bedrooms & 1 is 1 bedroom unit, some of them are recently remodeled.
Key facts
- Excellent visibility
- Recently remodeled
- Income producing
Tags
Neighborhood map
What this means for you Summary
Snapshot
- This is a 4×2bd/1ba + 1×1bd/1ba units multifamily listed at $260k.
Deal economics
- At list price, monthly cash flow is $2k ($25k/yr) — positive. Per door: $409/mo.
- The deal already cash-flows at list — no discount required.
- Meets the 1% rule at list price ($5k rent vs $260k).
- Recommended offer: $229k (12.0% below list) — sets the bar for market timing.
Location & tenants
- Location reads 70/100 on livability (#349 in TX) — a middle-class / working-renter tenant base. Strengths: cost of living A+, housing A+, crime A-; Watch: health & safety C-, employment D+, schools D.
- San Felipe-Del Rio CISD (town): math 25% / reading 32% proficiency, ranked #667 of 826 in TX (top 81%) — low school quality limits family demand, transient renter base, plan for 1-2y turnover; 70% free/reduced lunch — lower-income household profile, screen leases tightly.
- Market conditions: Rents rising (+1.6%/yr); 549 active listings in the ZIP; 85 units permitted in Val Verde County in 2024 (0 in 5+ unit buildings).
- At $5,390/mo this rent would consume 98% of the median local household income ($66k/yr) (locally 1111% of renters already pay >50% of income on rent) — very limited rent-growth headroom before tenants either downsize or default.
Forward outlook
- Local home prices are declining (-3.0%/yr); year-one equity from $2k of loan paydown is wiped out by about $8k of value loss. Plan a longer hold.
- Val Verde County population projected to shrink 9% by 2050 — rents likely to lag national; underwrite the cash flow, not the appreciation.
- At projected returns (-3.0% appreciation + 1.6% rent growth), your $73k cash investment doubles in ~4 years — after that, you're playing with house money.
Negotiation context
- It's been on market 154 days — a 12% lower offer ($229k) is reasonable based on typical stale-listing flexibility.
- 7 sale attempts since 6y ago; this cycle's ask has dropped $40k (13%) from the opening price — seller is motivated, your offer sets the floor, not the list.
Risks & watch-outs
- Watch-outs: property tax is 3.4% of price.
- Climate carrying-cost: major wildfire risk; extreme-heat days projected 7→23/yr by 2055 (HVAC capex compounding) — expect insurance premiums to compound above CPI over the hold.
Questions for the listing agent
- It's been on market 154 days. Have you received any prior offers? Is the seller open to a 12% concession, seller financing, or rate buy-down credit?
- Can we see the unit-by-unit rent roll, current vacancy, and any below-market leases? What's the average tenancy length?
- What capital expenditures (roof, boiler, parking lot, exteriors) have been made in the last 5 years, and what's planned in the next 2?
- Property tax is high relative to price — has the assessment been appealed recently, and will the sale trigger a re-assessment?
- Why hasn't it sold? Are there any deal-killer items the seller is aware of (foundation, flood, title, zoning, code violations)?
- Is there a deadline driving the sale (1031 exchange, divorce, estate, relocation)? That informs how much negotiation room exists.
- Schools are D-rated, which usually means shorter tenancies and higher turnover. Who's the typical renter profile here, and what's been the actual vacancy rate?
- What's the average days-on-market for RENTAL listings here right now (not sales)? A rising rental-DOM trend means longer vacancies and softer asking-rent achievability than the comps imply.
- What's the recent tenant-quality profile in this submarket — average credit score on applications, eviction rate, late-payment / NSF rate, and stable-employment percentage? A property-management company in the area should have these aggregated.
- How much new apartment / multifamily construction is in the pipeline within 1–3 miles? Heavy new supply (>2% of stock underway) typically softens rents 12–24 months out; light construction supports rent growth.
Investment metrics
- 1% rule
- 2.07% ✓
- Cap rate
- 15.74%
- Cash-on-cash
- 33.74%
- DSCR
- 2.50
- GRM
- 4.0
CMA / ARV
No comps found within radius.
Projected returns pro-forma
-3.0% appreciation · 1.55% rent growth · sell at horizon
- IRR
- 27.3%
- Equity multiple
- 2.11×
- Total profit
- $80,774
- Equity at exit
- $38,752
- IRR
- 33.9%
- Equity multiple
- 3.87×
- Total profit
- $208,598
- Equity at exit
- $22,471
Cash invested: $72,772 (down + closing). Projections, not guarantees.
Landlord ↔ Tenant lean methodology
- Overall (STATE)
- 87 Strongly Landlord-Friendly
- State Texas
- 87 Strongly Landlord-Friendly · R+5
- County
- — inherits STATE
- City
- — inherits STATE
ZIP-level market 78840
- Home prices YoY
- -33.6%
- Rents YoY
- 1.6%
- Active inventory
- 549
- Price-to-rent
- 19.8×
Monthly cashflow live
- Estimated rent
- $5,390 high interval (Pro) →
- Mortgage (P&I)
- −$1,363
- Tax from tax record
- −$741 /mo · $8,892/yr
- Insurance
- −$108
- HOA
- −$0
- Vacancy / Maint / Mgmt
- −$1,132
- Net cashflow
- $2,046
Break-even live
5-unit breakdown (identical units grouped — click to expand)
| Units | Beds | Baths | Est. rent |
|---|---|---|---|
| 4× units | 2 | 1 | $4,376 |
| #1 | 2 | 1 | $1,094 |
| #2 | 2 | 1 | $1,094 |
| #3 | 2 | 1 | $1,094 |
| #4 | 2 | 1 | $1,094 |
| 1× unit | 1 | 1 | $1,014 |
| Total (5 units) | $5,390 | ||
UW: 25.0% down · 7.5% · 30yr · 1.5% tax · 5.0% vac · 8.0% maint · 8.0% mgmt
Financing live
Cash to close
- Down payment
- $64,975
- Closing costs
- $7,797
- Reserves months
- —
- Total cash needed
- —
Loan-product check · same deal, 3 products live
Conventional
25% down · 7.5% · 30yr
- Down + closing
- —
- Monthly P&I
- —
- Monthly cashflow
- —
- DSCR
- —
- Eligible?
- —
Personal DTI + credit; lowest rate.
DSCR
20% down · 8.5% · 30yr
- Down + closing
- —
- Monthly P&I
- —
- Monthly cashflow
- —
- DSCR
- —
- Eligible?
- —
No personal income docs; deal must DSCR.
Hard money
10% down · 12.0% · 12mo
- Down + closing
- —
- Monthly P&I
- —
- Monthly cashflow
- —
- DSCR
- —
- Eligible?
- —
Short-term bridge; refi at stabilization.
Listing history 28 events
-
2026-06-19days on market $259,900 Active 154 DOM
-
2026-06-18days on market $259,900 Active 153 DOM
-
2026-06-17days on market $259,900 Active 152 DOM
-
2026-06-16days on market $259,900 Active 151 DOM
-
2026-06-15days on market $259,900 Active 150 DOM
-
2026-06-14days on market $259,900 Active 148 DOM
-
2026-06-12days on market $259,900 Active 147 DOM
-
2026-06-09days on market $259,900 Active 144 DOM
-
2026-06-08days on market $259,900 Active 143 DOM
-
2026-06-07days on market $259,900 Active 142 DOM
-
2026-06-05days on market $259,900 Active 139 DOM
-
2026-06-03days on market $259,900 Active 138 DOM
-
2026-06-02days on market $259,900 Active 137 DOM
-
2026-06-01days on market $259,900 Active 136 DOM
-
2026-05-31days on market $259,900 Active 135 DOM
-
2026-05-30days on market $259,900 Active 134 DOM
-
2026-03-18price $259,900 637-char remark
Show marketing remark (637 chars)
Unlock the potential of 701 E 6th Street, A versatile 5-unit property designed to generate consistent income for its next owner! Perfectly positioned on a corner lot near Avenue G and Veterans Blvd, this property offers excellent visibility and accessibility in a prime location. Whether you're a seasoned investor or aspiring landlord, this multi-unit gem is a fantastic opportunity to grow your portfolio. Don't miss out-turn your real estate goals into reality with this income-producing property! Main house has 4bedrooms 3 full baths, Three apartments are 2 bedrooms & 1 is 1 bedroom unit, some of them are recently remodeled.
-
2026-01-16$299,900 Active 637-char remark
Show marketing remark (637 chars)
Unlock the potential of 701 E 6th Street, A versatile 5-unit property designed to generate consistent income for its next owner! Perfectly positioned on a corner lot near Avenue G and Veterans Blvd, this property offers excellent visibility and accessibility in a prime location. Whether you're a seasoned investor or aspiring landlord, this multi-unit gem is a fantastic opportunity to grow your portfolio. Don't miss out-turn your real estate goals into reality with this income-producing property! Main house has 4bedrooms 3 full baths, Three apartments are 2 bedrooms & 1 is 1 bedroom unit, some of them are recently remodeled.
-
2025-10-04price $299,900
-
2025-08-04$320,000 Active
-
2025-07-02price $320,000
-
2025-01-14$339,000 Active
-
2024-07-06$355,000 Active
-
2022-08-17soldstatus
-
2022-08-17soldstatus
-
2022-05-17$269,900
-
2021-06-14$269,900
-
2020-09-29$269,900
ⓘ Source: listings_history table (triggers on properties + properties_extension) + one-shot
backfill from property_details.listing_events for pre-trigger history.
Tax reassessment forecast TX · Resets to sale price
- Current annual tax
- $8,892 · $741/mo
- Projected year-2 tax
- $8,892 · $741/mo
- Expected delta
- $0/yr ($0/mo · 0.0%)
ⓘ Screening estimate from a state-policy table — verify with the county assessor before closing.
Climate risk First Street
- Flood 1/10 Low FEMA zone X (unshaded) · 0% chance over 30 yrs
- Wildfire 6/10 Major
- Heat 8/10 Severe 7 d/yr ≥108°F today · 23 d/yr by 30 yrs out
- Wind 4/10 Moderate 12% chance of damaging wind over 30 yrs
- Air quality 1/10 Low 0 unhealthy d/yr today · 0 by 30 yrs out
Nearby sold comps map
Loading sold comps map…
Walkable amenities ~0.75 mi
Loading nearby amenities…
Taxation est. · year 1
- Rental income
- $64,680
- − Mortgage interest
- −$14,558
- − Property taxes
- −$8,892
- − Insurance
- −$1,300
- − Repairs & maintenance
- −$5,174
- − Management
- −$5,174
- − Depreciation
- −$7,561
- Taxable income
- $22,021
- Est. tax owed @ 24.0%
- −$5,285
- After-tax cash flow
- $19,266/yr
For passive investors: Depreciation is non-cash, so a rental often shows a tax loss while cash-flowing — sheltering income. Rental losses are passive: they offset passive income freely, and up to $25,000/yr can offset ordinary (W-2) income if you actively participate and your MAGI is under $100k (phasing out to $0 by $150k); unused losses carry forward. On sale, claimed depreciation is recaptured at up to 25%, and gains may owe capital-gains tax (a 1031 exchange can defer both). Figures are a year-1 estimate at your 24.0% rate — not tax advice; consult a CPA.
Schools (NCES district)
- District
- San Felipe-Del Rio CISD
- NCES district ID
- 4838900
- Math proficiency
- 25% ▼ -18.00%
- Reading proficiency
- 32% ▼ -5.00%
- Median HH income
- $40,582
- Composite
- 24.04/100
- National rank
- #7766
- State rank
- #667 of 826 in TX
Livability — Del Rio
- Score
- 70/100
- State rank
- #349
- US rank
- #7531
Category grades
Schools grade is shown separately in the Schools card above.
Census & demographics
- Census place
- Del Rio, TX
- County
- Val Verde County · 47,256 people
- City population
- 47,256
- Metro
- Del Rio, TX
- Population (ZIP)
- 47,256
- Household income
- $66,084
- Rent vs Own
- Severe rent burden
- 1111.0
Population outlook (Val Verde County) Hauer SSP2
- Today (2025)
- 48,073 people
- By 2030
- 47,468 · -1.3%
- By 2040
- 45,930 · -4.5%
- By 2050
- 43,904 · -8.7%
- By 2075
- 38,126 · -20.7%
- By 2100
- 26,217 · -45.5%
Race, ethnicity, and origin ACS 2023
- Neighborhood character
- Predominantly Hispanic (82%)
- Race & ethnicity
- Hispanic / Latino 82% Two or more races 24% White 15% Black 1%
- Hispanic origin (detail)
- Mexican 75%
- Common ancestry
- Italian 1% Lithuanian 1% Slovak 1%
- Foreign-born
- 19% · Canada
- Languages at home
- 36% English-only · Spanish 63%
Political lean MEDSL · Val Verde
- 2024 margin
- Strong R (+26.6) · D 36.2% · R 62.9%
- 2008→2024 swing
- -36.2pp toward R · 2008: 9.6pp · 2024: -26.6pp
- All cycles
- 2024: R+26.6 2020: R+9.9 2016: D+7.9 2012: D+5.4 2008: D+9.6
Not yet ingested
- Civics
- —
Market trends
- HPI YoY
- ▼ -81.95%
- Current HPI
- 161.762
- Rent YoY
- ▲ 1.55%
- Metro
- Del Rio, TX
- State GDP YoY
- ▲ 3.95%
- F500 in state
- 110
Industry mix (Fortune 500 HQ in TX)
| Industry | F500 HQs | Revenue |
|---|---|---|
| Energy | 16 | $1,198B |
|
||
| Technology | 5 | $198B |
|
||
| Engineering / Construction | 4 | $72B |
|
||
| Energy Services | 3 | $60B |
|
||
| Utilities | 3 | $41B |
|
||
| Healthcare | 2 | $330B |
|
||
Price history
-3.7% since first listed12 events — show timeline
- 2026-03-18 Price Changed $259,900 DRBORMLS
- 2026-01-16 Listed $299,900 DRBORMLS
- 2025-10-04 Price Changed $299,900 DRBORMLS
- 2025-08-04 Listed $320,000 DRBORMLS
- 2025-07-02 Price Changed $320,000 DRBORMLS
- 2025-01-14 Listed $339,000 DRBORMLS
- 2024-07-06 Listed $355,000 DRBORMLS
- 2022-08-17 Sold (Public Records) — Public Records
- 2022-08-17 Sold (MLS) — DRBORMLS
- 2022-05-17 Listed $269,900 DRBORMLS
- 2021-06-14 Listed $269,900 DRBORMLS
- 2020-09-29 Listed $269,900 DRBORMLS
Property tax history
+6.6%/yrLatest (2025): $8,892 · +0.6% YoY. Source: county tax records.
Cash-flow waterfall
monthlySold comps — $/sqft
last 12 mo · ≤1 miLoading sold comps…