511 E 950 N #34 · Ogden, UT
Flood risk 3/10 · Minor
- FEMA flood zone
- X (unshaded)
- Chance of flooding over 30 yrs
- 0.2%
- Est. flood insurance / yr
- $507 – $1,088
Fire risk 6/10 · Moderate
- Est. fire insurance / yr
- $453 – $841
Heat risk 4/10 · Minor
- Hot days now (above 91°F)
- 8 days/yr
- Hot days in 30 yrs
- 21 days/yr
Wind risk 1/10 · Minimal
- Chance of severe wind over 30 yrs
- —
Air-quality risk 3/10 · Minor
- Unhealthy air days now
- 2 days/yr
- Unhealthy air days in 30 yrs
- 3 days/yr
Risk factors via First Street. Map © Google.
Why this score? — see what drove the D- grade
The composite is a weighted blend of 9 inputs, each scored 0–100. Each bar is that input's sub-score; the figure is the points it added to the 100-point composite (weight × sub-score).
- 1% rule +10.0/10.0
- Cash flow +8.1/30.0
- ARV discount +7.5/15.0
- Livability +4.2/5.0
- Rent growth +3.1/5.0
- Condition / age +2.5/5.0
- Schools +2.4/10.0
- DSCR +2.2/10.0
- Appreciation +0.0/10.0
$80,000
🖨 Deal sheet 📄 Offer letter ✓ Due diligence
Listing remarks
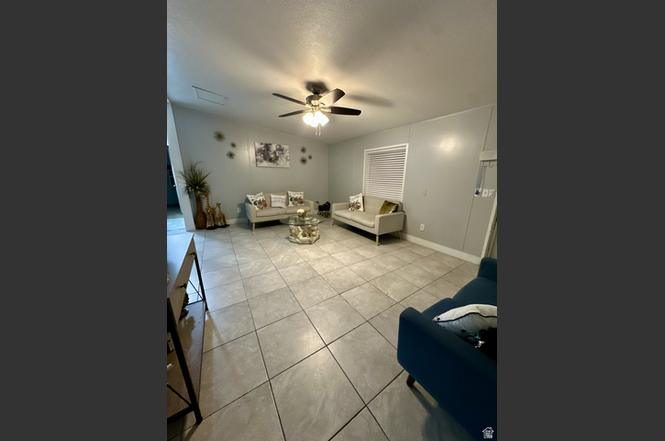
Welcome to this beautifully maintained mobile home in North Ogden! From the moment you step inside, you'll feel right at home. This spacious 3-bed, 2-bath residence offers comfort and room to gather, with an inviting layout that's perfect for both cozy winter nights and summer get-togethers on the large covered porch. You'll love the convenient location-just minutes from shopping, schools, main roads, and scenic hiking trails. Major updates include a roof, boiler, and garbage disposal replaced about five years ago, plus an updated kitchen backsplash, newer tile, fresh exterior paint, and new grass. A sturdy storage shed, purchased two years ago, is also included. Don't miss out on this oppo
Key facts
- Big covered porch
- Close to schools
- Close to main roads
Tags
Property features AI
Finance
- Other: Subdivision: VIKING VILLA
- HOA & community: Homeowners association (Nellie) with monthly fee; Association fee charged monthly; Association amenities: clubhouse, pool, playground, picnic area, barbecue, RV parking, management, pet rules with pets permitted, snow removal
Exterior
- Parking: Covered parking; Carport for 2 vehicles; Total of 2 parking spaces; Common RV parking
- Utilities: Natural gas connected; Electricity connected; Public sewer connected; Culinary (public) water connected
- Home design: Manufactured home; Built/standing condition; Residential use; Has a view
- Construction: Aluminum and asbestos exterior materials; Other construction materials; Asphalt roof; Built/standing construction status
- Exterior features: Covered deck; Partially fenced lot; Paved road; Sidewalks; Mountain view; Storage shed(s)
Interior
- Kitchen: Portable dishwasher; Refrigerator; Gas range; Free-standing range/oven; Disposal
- Bedrooms: 3 bedrooms on main level
- Flooring: Carpet; Tile
- Bathrooms: 2 full bathrooms
- Heating & cooling: Forced air heating; Gas central heating
- Interior features: Primary bathroom; Walk-in closet; Disposal; Gas range; Free-standing range/oven; Blinds on windows
Neighborhood map
What this means for you Summary
Snapshot
- This is a 3-bed/2.0-bath manufactured listed at $80k.
Deal economics
- At list price, monthly cash flow is $-77 ($-921/yr) — negative.
- To cash-flow at today's rent, offer at most $69k (13.9% below list).
- Meets the 1% rule at list price ($2k rent vs $80k).
- Recommended offer: $69k (13.9% below list) — sets the bar for cash-flow.
Location & tenants
- Location reads 84/100 on livability (#19 in UT, #810 nationally) — a professional / high-income tenant draw. Strengths: amenities A+, commute A+, cost of living A+; Watch: crime F.
- Ogden City District (urban): math 25% / reading 31% proficiency, ranked #72 of 80 in UT (top 90%) — low school quality limits family demand, transient renter base, plan for 1-2y turnover; 75% free/reduced lunch — lower-income household profile, screen leases tightly.
- Zoned schools: Lincoln School (math 18% / reading 19%, grade F, #535 of 585 statewide, top 92%, 461 students, 99% FRL); Highland Junior High (math 12% / reading 18%, grade F, #135 of 138 statewide, top 98%, 715 students, 0% FRL); Ben Lomond High (math 11% / reading 28%, grade F, #158 of 171 statewide, top 94%, 1,169 students, 44% FRL) — zoned schools average 48% FRL vs 75% district-wide (27 pts lower); this property's tenant base skews higher-income than the district average.
- Market conditions: Rents rising (+2.3%/yr); 611 active listings in the ZIP; 11 comparable units currently listed for rent nearby; rentals at typical pace (median 23d on market — plan ~3-4 weeks tenant-placement turnaround); solid renter incomes; 1,630 units permitted in Weber County in 2024 (521 in 5+ unit buildings).
Forward outlook
- Local home prices are declining (-3.0%/yr); year-one equity from $553 of loan paydown is wiped out by about $2k of value loss. Plan a longer hold.
- Weber County population projected at +24% by 2050 — long-run rental-demand tailwind backs the buy-and-hold thesis.
Negotiation context
- It's been on market 234 days — a 12% lower offer ($70k) is reasonable based on typical stale-listing flexibility.
- 5 sale attempts since 18y ago with the ask held roughly flat each time — persistent listings suggest the price (not the market) is what's stuck; bring a comps-based counter.
Risks & watch-outs
- Watch-outs: HOA is 54% of rent.
- Climate carrying-cost: major wildfire risk — expect insurance premiums to compound above CPI over the hold.
Questions for the listing agent
- What do current leases actually rent for vs. the listed asking? Can we see a recent rent roll and the last 12 months of T-12 income?
- It's been on market 234 days. Have you received any prior offers? Is the seller open to a 14% concession, seller financing, or rate buy-down credit?
- What does the HOA fee cover, when was the last increase, and are there any pending special assessments or reserve-fund shortfalls?
- Why hasn't it sold? Are there any deal-killer items the seller is aware of (foundation, flood, title, zoning, code violations)?
- Is there a deadline driving the sale (1031 exchange, divorce, estate, relocation)? That informs how much negotiation room exists.
- Crime grade is F in this area — have there been break-ins, vandalism, or insurance claims at this property in the last 3 years? What carrier currently insures it and at what premium?
- The area grade is low — what's the realistic commute time and amenity access for the typical tenant pool here? Any planned neighborhood developments (good or bad) we should know about?
- What's the average days-on-market for RENTAL listings here right now (not sales)? A rising rental-DOM trend means longer vacancies and softer asking-rent achievability than the comps imply.
- What's the recent tenant-quality profile in this submarket — average credit score on applications, eviction rate, late-payment / NSF rate, and stable-employment percentage? A property-management company in the area should have these aggregated.
- How much new for-sale + rental construction is in the pipeline within 1–3 miles? Heavy new supply typically softens prices + rents 12–24 months out; constrained supply supports both.
Investment metrics
- 1% rule
- 2.34% ✓
- Cap rate
- 5.14%
- Cash-on-cash
- -4.11%
- DSCR
- 0.82
- GRM
- 3.6
CMA / ARV
No comps found within radius.
Projected returns pro-forma
-3.0% appreciation · 2.33% rent growth · sell at horizon
- IRR
- -24.4%
- Equity multiple
- 0.18×
- Total profit
- $-18,463
- Equity at exit
- $11,928
- IRR
- -23.0%
- Equity multiple
- -0.11×
- Total profit
- $-24,829
- Equity at exit
- $6,917
Cash invested: $22,400 (down + closing). Projections, not guarantees.
Landlord ↔ Tenant lean methodology
- Overall (STATE)
- 86 Strongly Landlord-Friendly
- State Utah
- 86 Strongly Landlord-Friendly · R+15
- County
- — inherits STATE
- City
- — inherits STATE
ZIP-level market 84404
- Rents YoY
- 2.3%
- Active inventory
- 611
- Price-to-rent
- 3.6×
Monthly cashflow live
- Estimated rent
- $1,870 high interval (Pro) →
- Mortgage (P&I)
- −$420
- Tax est. 1.5%
- −$100 /mo · $1,200/yr
- Insurance
- −$33
- HOA
- −$1,001
- Vacancy / Maint / Mgmt
- −$393
- Net cashflow
- $-77
Break-even live
UW: 25.0% down · 7.5% · 30yr · 1.5% tax · 5.0% vac · 8.0% maint · 8.0% mgmt
Financing live
Cash to close
- Down payment
- $20,000
- Closing costs
- $2,400
- Reserves months
- —
- Total cash needed
- —
Loan-product check · same deal, 3 products live
Conventional
25% down · 7.5% · 30yr
- Down + closing
- —
- Monthly P&I
- —
- Monthly cashflow
- —
- DSCR
- —
- Eligible?
- —
Personal DTI + credit; lowest rate.
DSCR
20% down · 8.5% · 30yr
- Down + closing
- —
- Monthly P&I
- —
- Monthly cashflow
- —
- DSCR
- —
- Eligible?
- —
No personal income docs; deal must DSCR.
Hard money
10% down · 12.0% · 12mo
- Down + closing
- —
- Monthly P&I
- —
- Monthly cashflow
- —
- DSCR
- —
- Eligible?
- —
Short-term bridge; refi at stabilization.
Rent comps 11 comps
| Address | Beds | Baths | Sqft | Rent | $/sqft | DOM | Units | Dist |
|---|---|---|---|---|---|---|---|---|
| 551 E 900 North St Ogden, UT | 3.0 | 2.5 | 1400 | $1,795 | $1.28 | 14d | 1 | 0.12mi |
| 551 E 900 North St Ogden, UT | 3.0 | 2.5 | 1400 | $1,850 | $1.32 | 23d | 2 | 0.12mi |
| 445 E 800 North St Ogden, UT | 2.0 | 1.0 | 1030 | $1,250 | $1.21 | 23d | 1 | 0.26mi |
| 381 N Washington Blvd Ogden, UT | 1.0–3.0 | 1.0–2.0 | 1062 | $1,683 | $1.58 | 14d | 15 | 0.76mi |
| 277 E 1500 N Ogden, UT | 3.0 | 3.0 | 1811 | $2,100 | $1.16 | 18d | 1 | 0.77mi |
| 1024 N 1025 E Ogden, UT | 4.0 | 3.0 | 1700 | $2,600 | $1.53 | 18d | 1 | 0.95mi |
| 1022 Southwell St Ogden, UT | 3.0 | 2.0 | 1143 | $1,875 | $1.64 | 23d | 1 | 1.09mi |
| 455 2nd St Ogden, UT | 1.0–2.0 | 1.0–2.0 | 838 | $1,499 | $1.79 | 14d | 5 | 1.11mi |
| 662 4th St Ogden, UT | 3.0 | 1.0 | 1382 | $1,950 | $1.41 | 23d | 1 | 1.30mi |
| 117 4th St S Unit 119 Ogden, UT | 3.0 | 2.5 | 1500 | $1,899 | $1.27 | 23d | 1 | 1.42mi |
| 3041 E 2050 N Unit 10 Ogden, UT | 3.0 | 2.5 | 1362 | $1,795 | $1.32 | 23d | 1 | 1.46mi |
HOA detail
- Monthly dues
- $1,001 · $12,012/yr
- Likely covers
- trash
Listing history 25 events
-
2026-06-18days on market $80,000 Active 234 DOM
-
2026-06-17days on market $80,000 Active 233 DOM
-
2026-06-16days on market $80,000 Active 232 DOM
-
2026-06-15days on market $80,000 Active 231 DOM
-
2026-06-14days on market $80,000 Active 229 DOM
-
2026-06-13days on market $80,000 Active 228 DOM
-
2026-06-10days on market $80,000 Active 226 DOM
-
2026-06-09days on market $80,000 Active 225 DOM
-
2026-06-08days on market $80,000 Active 224 DOM
-
2026-06-07days on market $80,000 Active 223 DOM
-
2026-06-05days on market $80,000 Active 220 DOM
-
2026-06-03days on market $80,000 Active 219 DOM
-
2026-06-02days on market $80,000 Active 218 DOM
-
2026-06-01days on market $80,000 Active 217 DOM
-
2026-05-31days on market $80,000 Active 216 DOM
-
2026-05-31days on market $80,000 Active 215 DOM
-
2025-12-09status Active
-
2025-12-04historical Backup
-
2025-10-28$80,000 Active
-
2009-07-15historical
-
2008-03-07historical
-
2008-03-07$42,900
-
2008-01-25historical
-
2008-01-16$42,900
-
2008-01-16$42,900
ⓘ Source: listings_history table (triggers on properties + properties_extension) + one-shot
backfill from property_details.listing_events for pre-trigger history.
Climate risk First Street
- Flood 3/10 Moderate FEMA zone X (unshaded) · 20% chance over 30 yrs
- Wildfire 6/10 Major
- Heat 4/10 Moderate 8 d/yr ≥91°F today · 21 d/yr by 30 yrs out
- Wind 1/10 Low
- Air quality 3/10 Moderate 2 unhealthy d/yr today · 3 by 30 yrs out
Nearby sold comps map
Loading sold comps map…
Walkable amenities ~0.75 mi
Loading nearby amenities…
Taxation est. · year 1
- Rental income
- $22,437
- − Mortgage interest
- −$4,481
- − Property taxes
- −$1,200
- − Insurance
- −$400
- − Repairs & maintenance
- −$1,795
- − Management
- −$1,795
- − HOA
- −$12,012
- − Depreciation
- −$2,327
- Taxable loss
- −$1,574
- Est. tax savings @ 24.0%
- +$378
- After-tax cash flow
- $-544/yr
For passive investors: Depreciation is non-cash, so a rental often shows a tax loss while cash-flowing — sheltering income. Rental losses are passive: they offset passive income freely, and up to $25,000/yr can offset ordinary (W-2) income if you actively participate and your MAGI is under $100k (phasing out to $0 by $150k); unused losses carry forward. On sale, claimed depreciation is recaptured at up to 25%, and gains may owe capital-gains tax (a 1031 exchange can defer both). Figures are a year-1 estimate at your 24.0% rate — not tax advice; consult a CPA.
Schools (NCES district)
- District
- Ogden City District
- NCES district ID
- 4900720
- Math proficiency
- 25% ▼ -2.00%
- Reading proficiency
- 31% ▼ -5.00%
- Median HH income
- $41,974
- Composite
- 23.76/100
- National rank
- #7818
- State rank
- #72 of 80 in UT
Livability — Ogden
- Score
- 84/100
- State rank
- #19
- US rank
- #810
Category grades
Schools grade is shown separately in the Schools card above.
Census & demographics
- Census place
- Ogden, UT
- County
- Weber County · 260,557 people
- City population
- 152,611
- Metro
- Ogden-Clearfield, UT
- Population (ZIP)
- 66,587
- Household income
- $85,057
- Rent vs Own
- Severe rent burden
- 1201.0
Population outlook (Weber County) Hauer SSP2
- Today (2025)
- 274,329 people
- By 2030
- 288,577 · +5.2%
- By 2040
- 314,848 · +14.8%
- By 2050
- 338,710 · +23.5%
- By 2075
- 384,412 · +40.1%
- By 2100
- 409,305 · +49.2%
Race, ethnicity, and origin ACS 2023
- Neighborhood character
- Predominantly White (70%)
- Race & ethnicity
- White 70% Hispanic / Latino 24% Two or more races 7% Asian 1%
- Hispanic origin (detail)
- Mexican 20%
- Common ancestry
- Italian 5% Slovak 4% Iranian 3%
- Foreign-born
- 8% · Canada
- Languages at home
- 83% English-only · Spanish 15% Other Indo-European 1%
Political lean MEDSL · Weber
- 2024 margin
- Strong R (+23.5) · D 36.8% · R 60.3% · Other 2.9%
- 2008→2024 swing
- +4.1pp toward D · 2008: -27.6pp · 2024: -23.5pp
- All cycles
- 2024: R+23.5 2020: R+22.7 2016: R+20.0 2012: R+46.0 2008: R+27.6
Not yet ingested
- Civics
- —
Market trends
- HPI YoY
- ▼ -317.85%
- Current HPI
- 323.2499
- Rent YoY
- ▲ 2.33%
- Metro
- Ogden-Clearfield, UT
- State GDP YoY
- ▲ 3.54%
- F500 in state
- 2
Industry mix (Fortune 500 HQ in UT)
| Industry | F500 HQs | Revenue |
|---|---|---|
| Financial Services | 1 | $3B |
|
||
Price history
+86.5% since first listed9 events — show timeline
- 2025-12-09 Relisted — WFRMLS
- 2025-12-04 Contingent — WFRMLS
- 2025-10-28 Listed $80,000 WFRMLS
- 2009-07-15 Listing Removed — WFRMLS
- 2008-03-07 Listing Removed — WFRMLS
- 2008-03-07 Listed $42,900 WFRMLS
- 2008-01-25 Listing Removed — WFRMLS
- 2008-01-16 Listed $42,900 WFRMLS
- 2008-01-16 Listed $42,900 WFRMLS
Cash-flow waterfall
monthlySold comps — $/sqft
last 12 mo · ≤1 miLoading sold comps…