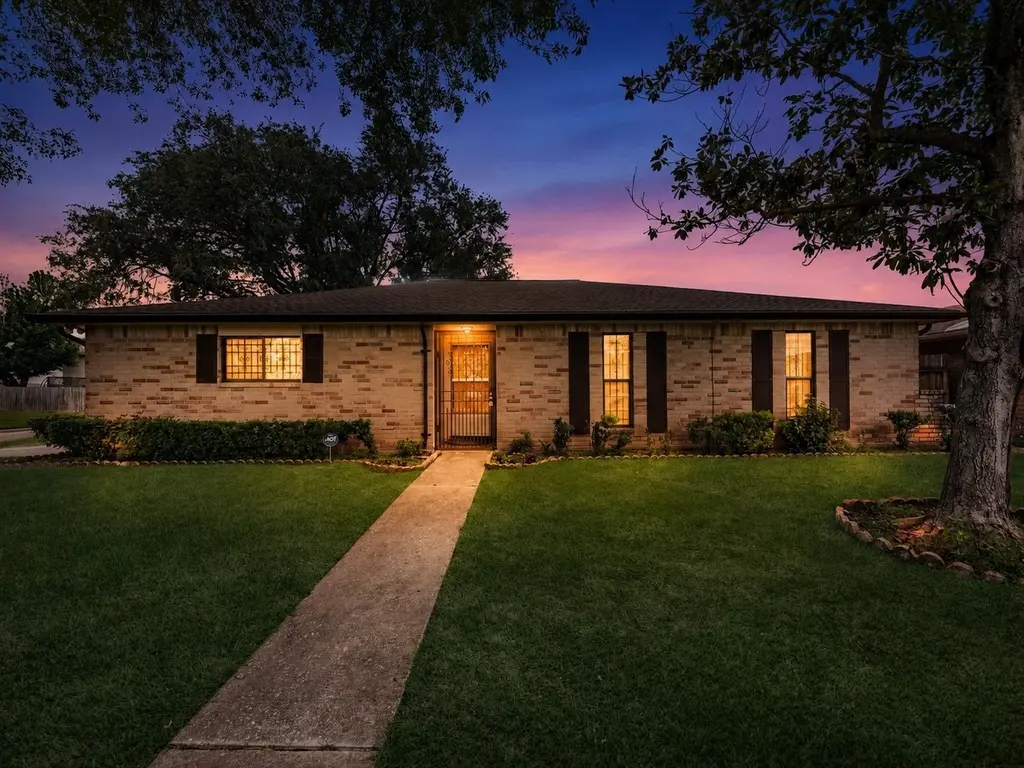
7654 Westbank Ave · Houston, TX
Flood risk 3/10 · Minor
- FEMA flood zone
- X (unshaded)
- Chance of flooding over 30 yrs
- 0.2%
- Est. flood insurance / yr
- $507 – $1,088
Fire risk 1/10 · Minimal
- Est. fire insurance / yr
- $1,222 – $2,270
Heat risk 9/10 · Severe
- Hot days now (above 110°F)
- 7 days/yr
- Hot days in 30 yrs
- 23 days/yr
Wind risk 9/10 · Severe
- Chance of severe wind over 30 yrs
- 99.0%
Air-quality risk 3/10 · Minor
- Unhealthy air days now
- 3 days/yr
- Unhealthy air days in 30 yrs
- 4 days/yr
Risk factors via First Street. Map © Google.
Why this score? — see what drove the C- grade
The composite is a weighted blend of 9 inputs, each scored 0–100. Each bar is that input's sub-score; the figure is the points it added to the 100-point composite (weight × sub-score).
- ARV discount +14.7/15.0
- Cash flow +11.0/30.0
- Appreciation +4.8/10.0
- Schools +4.4/10.0
- 1% rule +4.2/10.0
- Livability +3.7/5.0
- DSCR +3.2/10.0
- Condition / age +2.5/5.0
- Rent growth +1.7/5.0
$190,000
🖨 Deal sheet 📄 Offer letter ✓ Due diligence
Listing remarks
Welcome to 7654 Westbank Ave, a well-loved single-story brick home cared for by a long-term previous owner and ready for its next chapter. This home offers spacious living areas, a charming brick fireplace, tile flooring through the main spaces, comfortable bedrooms, updated bathroom finishes, and a functional kitchen with abundant cabinet storage. Enjoy added value with a water softener, mature trees, generous yard space, covered patio, and a peaceful setting next to an open field for extra privacy and breathing room. Conveniently located near major roadways, shopping, dining, parks, and everyday essentials, this home combines comfort, practicality, and neighborhood charm. Come see the pot
Key facts
- Water softener
- Brick home
- Tile flooring
Tags
Property features AI
Finance
- HOA & community: Westbank Home Owners Association with an annual fee of $360
Exterior
- Parking: Attached 2-car garage
- Utilities: Public water; Public sewer
- Home design: Residential property; Full ownership; Single-story entry (all main rooms on first floor)
- Construction: Brick construction; Built in 1978; Composition roof; Slab foundation
- Exterior features: Corner lot
Interior
- Kitchen: Kitchen on the first floor
- Bedrooms: Primary bedroom on the first floor (16' x 14'); Two additional bedrooms on the first floor (each 12' x 11'); All bedrooms located on the first floor
- Bathrooms: 2 full bathrooms
- Heating & cooling: Central heating (electric); Central air conditioning (electric)
- Interior features: One fireplace; 6 total rooms
Neighborhood map
What this means for you Summary
Snapshot
- This is a 3-bed/2.0-bath single-family listed at $190k.
Deal economics
- At list price, monthly cash flow is $-80 ($-958/yr) — negative.
- To cash-flow at today's rent, offer at most $176k (7.4% below list).
- To meet the 1% rule (rent ≥ 1% of price), the offer needs to be $175k (7.8% below list).
- Recommended offer: $175k (7.8% below list) — sets the bar for 1% rule.
- Cap rate 5.8% vs local median 3.2% in Houston — top-decile yield for the area; either an underpriced asset or a hidden risk that comps aren't pricing in. Stress-test before assuming the spread holds.
Location & tenants
- Location reads 74/100 on livability (#184 in TX, #4,771 nationally) — a middle-class / working-renter tenant base. Strengths: amenities A+, cost of living A+, housing A+; Watch: crime F.
- Cypress-Fairbanks ISD (suburban): math 45% / reading 52% proficiency, ranked #161 of 826 in TX (top 20%) — families likely to look elsewhere, expect single-tenant / working-renter base with shorter leases.
- Zoned schools: Cook Middle (math 46% / reading 49%, grade C-, #408 of 1,662 statewide, top 25%, 1,428 students, 66% FRL); Jersey Village H S (math 50% / reading 59%, grade C-, #379 of 1,632 statewide, top 26%, 3,364 students, 64% FRL) — zoned schools average 65% FRL vs 43% district-wide (22 pts higher); higher-poverty schools than district average — tighter screening recommended.
- Market conditions: Rents falling (-3.4%/yr); 152 active listings in the ZIP; 11 comparable units currently listed for rent nearby; rentals at typical pace (median 17d on market — plan ~3-4 weeks tenant-placement turnaround); 45% of comp listings sitting > 30 days — soft ceiling on asking rent; solid renter incomes; 29,883 units permitted in Harris County in 2024 (8,621 in 5+ unit buildings).
Forward outlook
- In year one you build about $469 of equity ($1k loan paydown + $-845 appreciation (-0.4% local appreciation)).
- Harris County population projected at +47% by 2050 — long-run rental-demand tailwind backs the buy-and-hold thesis.
Negotiation context
- It's been on market 15 days — a 2% lower offer ($187k) is reasonable based on typical stale-listing flexibility.
- Current owner paid $50k; list at $190k implies a 281% gain — meaningful room to come down on a strong offer.
Risks & watch-outs
- Climate carrying-cost: severe wind risk, 99% chance of damaging wind over 30y; extreme-heat days projected 7→23/yr by 2055 (HVAC capex compounding) — expect insurance premiums to compound above CPI over the hold.
Questions for the listing agent
- What do current leases actually rent for vs. the listed asking? Can we see a recent rent roll and the last 12 months of T-12 income?
- Built in 1978 — when were the roof, HVAC, electrical panel, plumbing, and water heater last replaced?
- What does the HOA fee cover, when was the last increase, and are there any pending special assessments or reserve-fund shortfalls?
- Is there a deadline driving the sale (1031 exchange, divorce, estate, relocation)? That informs how much negotiation room exists.
- Schools are D-rated, which usually means shorter tenancies and higher turnover. Who's the typical renter profile here, and what's been the actual vacancy rate?
- Crime grade is F in this area — have there been break-ins, vandalism, or insurance claims at this property in the last 3 years? What carrier currently insures it and at what premium?
- What's the average days-on-market for RENTAL listings here right now (not sales)? A rising rental-DOM trend means longer vacancies and softer asking-rent achievability than the comps imply.
- What's the recent tenant-quality profile in this submarket — average credit score on applications, eviction rate, late-payment / NSF rate, and stable-employment percentage? A property-management company in the area should have these aggregated.
- How much new for-sale + rental construction is in the pipeline within 1–3 miles? Heavy new supply typically softens prices + rents 12–24 months out; constrained supply supports both.
Investment metrics
- 1% rule
- 0.92% ✗
- Cap rate
- 5.79%
- Cash-on-cash
- -1.80%
- DSCR
- 0.92
- GRM
- 9.0
CMA / ARV
- ARV (median comp)
- $226,309
- List price
- $190,000
- Delta
- -16.04%
- Verdict
- UNDERPRICED
- Comps
- 20 within 1.0 mi
Show comp detail 12 sales within ~0.75 mi
| Address | Dist | Beds/Ba | Sqft | Sold | Price | $/sf | Match |
|---|---|---|---|---|---|---|---|
| 8334 Carriage Creek Dr | 0.09mi | 3/2.0 | 1,370 (0%) | 8mo | $239,000 | $174 | 89 |
| 8330 Pebbledowne Dr | 0.22mi | 3/2.0 | 1,346 (-2%) | 3mo | $189,900 | $141 | 85 |
| 7822 West Rd | 0.30mi | 3/3.0 | 1,370 (0%) | 2mo | $195,000 | $142 | 80 |
| 7510 Gold Dust Ln | 0.37mi | 3/2.0 | 1,346 (-2%) | 5mo | $249,900 | $186 | 76 |
| 8303 Snail Hollow Dr | 0.26mi | 4/2.0 (+1) | 1,371 (+0%) | 10mo | $230,000 | $168 | 74 |
| 8354 Carriage Creek Dr | 0.15mi | 3/2.0 | 1,488 (+9%) | 8mo | $230,000 | $155 | 72 |
| 8638 Little River Rd | 0.74mi | 3/2.0 | 1,404 (+2%) | 1mo | $180,000 | $128 | 60 |
| 8615 Bridgefoot Ln | 0.59mi | 3/2.0 | 1,404 (+2%) | 12mo | $199,990 | $142 | 59 |
| 8430 Bridgefoot Ln | 0.47mi | 3/2.0 | 1,488 (+9%) | 8mo | $244,888 | $165 | 57 |
| 8327 Snail Hollow Dr | 0.27mi | 3/2.0 | 1,564 (+14%) | 11mo | $234,500 | $150 | 55 |
| 8610 Apothecary Ln | 0.46mi | 4/2.0 (+1) | 1,488 (+9%) | 9mo | $190,000 | $128 | 52 |
| 8619 Upperbrook St | 0.70mi | 3/2.0 | 1,436 (+5%) | 10mo | $267,500 | $186 | 51 |
Match score weights: distance 35% · size 25% · config 20% · recency 20%. Top-matched comps best support the ARV.
Projected returns pro-forma
-0.44% appreciation · 0.0% rent growth · sell at horizon
- IRR
- -8.3%
- Equity multiple
- 0.63×
- Total profit
- $-19,598
- Equity at exit
- $50,981
- IRR
- -4.6%
- Equity multiple
- 0.58×
- Total profit
- $-22,413
- Equity at exit
- $58,031
Cash invested: $53,200 (down + closing). Projections, not guarantees.
Landlord ↔ Tenant lean methodology
- Overall (STATE)
- 87 Strongly Landlord-Friendly
- State Texas
- 87 Strongly Landlord-Friendly · R+5
- County
- — inherits STATE
- City
- — inherits STATE
ZIP-level market 77064
- Home prices YoY
- -0.2%
- Rents YoY
- -3.4%
- Active inventory
- 152
- Price-to-rent
- 9.0×
Monthly cashflow live
- Estimated rent
- $1,753 high interval (Pro) →
- Mortgage (P&I)
- −$996
- Tax from tax record
- −$359 /mo · $4,307/yr
- Insurance
- −$79
- HOA
- −$30
- Vacancy / Maint / Mgmt
- −$368
- Net cashflow
- $-80
Break-even live
UW: 25.0% down · 7.5% · 30yr · 1.5% tax · 5.0% vac · 8.0% maint · 8.0% mgmt
Financing live
Cash to close
- Down payment
- $47,500
- Closing costs
- $5,700
- Reserves months
- —
- Total cash needed
- —
Loan-product check · same deal, 3 products live
Conventional
25% down · 7.5% · 30yr
- Down + closing
- —
- Monthly P&I
- —
- Monthly cashflow
- —
- DSCR
- —
- Eligible?
- —
Personal DTI + credit; lowest rate.
DSCR
20% down · 8.5% · 30yr
- Down + closing
- —
- Monthly P&I
- —
- Monthly cashflow
- —
- DSCR
- —
- Eligible?
- —
No personal income docs; deal must DSCR.
Hard money
10% down · 12.0% · 12mo
- Down + closing
- —
- Monthly P&I
- —
- Monthly cashflow
- —
- DSCR
- —
- Eligible?
- —
Short-term bridge; refi at stabilization.
Rent comps 11 comps
| Address | Beds | Baths | Sqft | Rent | $/sqft | DOM | Units | Dist |
|---|---|---|---|---|---|---|---|---|
| 8418 Mosshang Ct Houston, TX | 3.0 | 2.0 | 1182 | $1,950 | $1.65 | 17d | 1 | 1.14mi |
| 6807 Ashland Forest Dr Houston, TX | 3.0 | 2.0 | 1790 | $1,850 | $1.03 | 44d | 1 | 1.22mi |
| 9526 Golden Wood Ln Houston, TX | 3.0 | 2.0 | 1687 | $1,850 | $1.10 | 44d | 1 | 1.34mi |
| 9410 Fairbanks North Houston Rd Houston, TX | 3.0 | 2.0 | 1331 | $1,733 | $1.30 | 5d | 1 | 1.36mi |
| 9410 Fairbanks North Houston Rd Houston, TX | 2.0 | 2.0 | 1312 | $1,449 | $1.10 | 13d | 1 | 1.36mi |
| 9410 Fairbanks North Houston Rd Houston, TX | 3.0 | 2.0 | 1331 | $1,733 | $1.30 | 1d | 1 | 1.36mi |
| 9410 Fairbanks North Houston Rd Houston, TX | 2.0 | 2.0 | 1312 | $1,449 | $1.10 | 44d | 1 | 1.36mi |
| 7150 Smiling Woods Ln Houston, TX | 1.0–2.0 | 1.0–2.0 | 797 | $1,383 | $1.74 | 1d | 13 | 1.45mi |
| 7750 Water Park Ln Houston, TX | 4.0 | 2.0 | 1209 | $1,900 | $1.57 | 44d | 1 | 1.45mi |
| 12626 Atwood Grove Ln Houston, TX | 3.0 | 2.0 | 1672 | $1,900 | $1.14 | 44d | 1 | 1.47mi |
| 12752 N Houston Rosslyn Rd Houston, TX | 1.0–3.0 | 1.0–2.0 | 922 | $1,963 | $2.13 | 2d | 13 | 1.47mi |
HOA detail
- Monthly dues
- $30 · $360/yr
- Likely covers
- water
Listing history 2 events
-
2026-05-13$190,000 Active 724-char remark
-
1994-08-15soldstatus $49,900
ⓘ Source: listings_history table (triggers on properties + properties_extension) + one-shot
backfill from property_details.listing_events for pre-trigger history.
Tax reassessment forecast TX · Resets to sale price
- Current annual tax
- $4,307 · $359/mo
- Projected year-2 tax
- $4,307 · $359/mo
- Expected delta
- $0/yr ($0/mo · 0.0%)
ⓘ Screening estimate from a state-policy table — verify with the county assessor before closing.
Climate risk First Street
- Flood 3/10 Moderate FEMA zone X (unshaded) · 20% chance over 30 yrs
- Wildfire 1/10 Low
- Heat 9/10 Extreme 7 d/yr ≥110°F today · 23 d/yr by 30 yrs out
- Wind 9/10 Extreme 99% chance of damaging wind over 30 yrs
- Air quality 3/10 Moderate 3 unhealthy d/yr today · 4 by 30 yrs out
Nearby sold comps map
Loading sold comps map…
Walkable amenities ~0.75 mi
Loading nearby amenities…
Taxation est. · year 1
- Rental income
- $21,032
- − Mortgage interest
- −$10,643
- − Property taxes
- −$4,307
- − Insurance
- −$950
- − Repairs & maintenance
- −$1,683
- − Management
- −$1,683
- − HOA
- −$360
- − Depreciation
- −$5,527
- Taxable loss
- −$4,120
- Est. tax savings @ 24.0%
- +$989
- After-tax cash flow
- $31/yr
For passive investors: Depreciation is non-cash, so a rental often shows a tax loss while cash-flowing — sheltering income. Rental losses are passive: they offset passive income freely, and up to $25,000/yr can offset ordinary (W-2) income if you actively participate and your MAGI is under $100k (phasing out to $0 by $150k); unused losses carry forward. On sale, claimed depreciation is recaptured at up to 25%, and gains may owe capital-gains tax (a 1031 exchange can defer both). Figures are a year-1 estimate at your 24.0% rate — not tax advice; consult a CPA.
Schools (NCES district)
- District
- Cypress-Fairbanks ISD
- NCES district ID
- 4816110
- Math proficiency
- 45% ▼ -12.00%
- Reading proficiency
- 52% ▼ -2.00%
- Median HH income
- $72,025
- Composite
- 43.63/100
- National rank
- #2968
- State rank
- #161 of 826 in TX
Livability — Houston
- Score
- 74/100
- State rank
- #184
- US rank
- #4771
Category grades
Schools grade is shown separately in the Schools card above.
Census & demographics
- County
- Harris County · 4,702,590 people
- City population
- 3,226,434
- Metro
- Houston-The Woodlands-Sugar Land, TX
- Population (ZIP)
- 49,591
- Household income
- $81,658
- Rent vs Own
- Severe rent burden
- 1589.0
Population outlook (Harris County) Hauer SSP2
- Today (2025)
- 5,571,493 people
- By 2030
- 6,089,821 · +9.3%
- By 2040
- 7,142,806 · +28.2%
- By 2050
- 8,185,864 · +46.9%
- By 2075
- 10,574,329 · +89.8%
- By 2100
- 12,109,958 · +117.4%
Race, ethnicity, and origin ACS 2023
- Neighborhood character
- Highly diverse neighborhood (Simpson 0.71)
- Race & ethnicity
- Hispanic / Latino 45% White 22% Two or more races 19% Asian 15% Black 15%
- Hispanic origin (detail)
- Mexican 30%
- Common ancestry
- Romanian 2% Lithuanian 1% Italian 1%
- Foreign-born
- 29% · Canada, Vietnam, Jamaica
- Languages at home
- 51% English-only · Spanish 35% Vietnamese 9% Other Indo-European 2%
Political lean MEDSL · Harris
- 2024 margin
- Lean D (+5.5) · D 52.0% · R 46.4% · Other 1.6%
- 2008→2024 swing
- +3.9pp toward D · 2008: 1.6pp · 2024: 5.5pp
- All cycles
- 2024: D+5.5 2020: D+13.3 2016: D+12.4 2012: D+0.1 2008: D+1.6
Not yet ingested
- Civics
- —
Market trends
- HPI YoY
- ▼ -0.44%
- Current HPI
- 238.9456
- Rent YoY
- ▼ -3.36%
- Metro
- Houston-The Woodlands-Sugar Land, TX
- State GDP YoY
- ▲ 3.95%
- F500 in state
- 110
Industry mix (Fortune 500 HQ in TX)
| Industry | F500 HQs | Revenue |
|---|---|---|
| Energy | 16 | $1,198B |
|
||
| Technology | 5 | $198B |
|
||
| Engineering / Construction | 4 | $72B |
|
||
| Energy Services | 3 | $60B |
|
||
| Utilities | 3 | $41B |
|
||
| Healthcare | 2 | $330B |
|
||
Price history
+280.8% since first listed4 events — show timeline
- 2026-05-29 Pending — HARMLS
- 2026-05-21 Pending — HARMLS
- 2026-05-13 Listed $190,000 HARMLS
- 1994-08-15 Sold (Public Records) $49,900 Public Records
Property tax history
+7.5%/yrLatest (2025): $4,307 · +0.6% YoY. Source: county tax records.
Cash-flow waterfall
monthlySold comps — $/sqft
last 12 mo · ≤1 miLoading sold comps…