118 Summit House #118 · Cheyney University, PA
Flood risk 1/10 · Minimal
- FEMA flood zone
- X (unshaded)
- Chance of flooding over 30 yrs
- 0.0%
- Est. flood insurance / yr
- $507 – $1,088
Fire risk 1/10 · Minimal
- Est. fire insurance / yr
- $511 – $949
Heat risk 6/10 · Moderate
- Hot days now (above 101°F)
- 7 days/yr
- Hot days in 30 yrs
- 14 days/yr
Wind risk 6/10 · Moderate
- Chance of severe wind over 30 yrs
- 27.0%
Air-quality risk 4/10 · Minor
- Unhealthy air days now
- 3 days/yr
- Unhealthy air days in 30 yrs
- 6 days/yr
Risk factors via First Street. Map © Google.
Why this score? — see what drove the D+ grade
The composite is a weighted blend of 9 inputs, each scored 0–100. Each bar is that input's sub-score; the figure is the points it added to the 100-point composite (weight × sub-score).
- ARV discount +15.0/15.0
- Cash flow +11.5/30.0
- Schools +5.9/10.0
- 1% rule +5.4/10.0
- Rent growth +3.7/5.0
- DSCR +3.4/10.0
- Livability +2.5/5.0
- Condition / age +2.2/5.0
- Appreciation +0.0/10.0
$300,000
🖨 Deal sheet 📄 Offer letter ✓ Due diligence
Listing remarks MLS
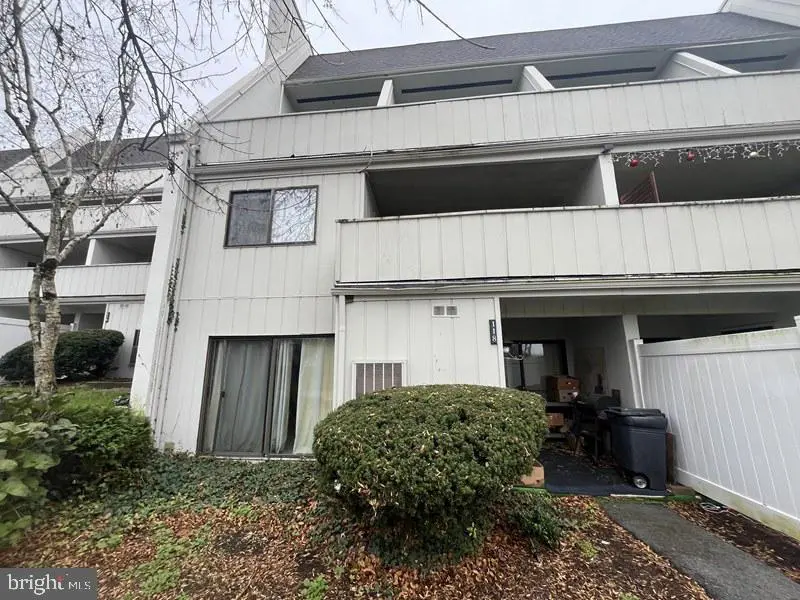
Fabulous Townhouse in Summit House Community – East Goshen Township, Chester County, PA This charming townhouse, located within the desirable Summit House Community, was originally constructed in 1974 and offers approximately 2,832 square feet of interior living space. The home features a spacious living room, dining area, and kitchen, along with four bedrooms and one-and-a-half bathrooms. Additional highlights include a lower basement level, an attic area providing extra storage, and a private patio—perfect for relaxing after a long day. As part of a planned residential development, the property is governed by a homeowner's association, ensuring well-maintained surroundings and community amenities.
Key facts
- Private patio
- Attic area
- Lower basement level
Tags
Neighborhood map
What this means for you Summary
Snapshot
- This is a 4-bed/1.5-bath townhouse listed at $300k. Condition is rated fair.
Deal economics
- At list price, monthly cash flow is $-96 ($-1k/yr) — negative.
- To cash-flow at today's rent, offer at most $286k (4.7% below list).
- Meets the 1% rule at list price ($3k rent vs $300k).
- Recommended offer: $264k (12.0% below list) — sets the bar for market timing.
- Cap rate 5.9% vs local median 1.8% in Cheyney University — top-decile yield for the area; either an underpriced asset or a hidden risk that comps aren't pricing in. Stress-test before assuming the spread holds.
Location & tenants
- Location reads 49/100 on livability (#1,706 in PA) — a working-class tenant base; expect higher turnover. Strengths: cost of living A+, crime A; Watch: amenities F, commute F, employment F.
- West Chester Area SD (suburban): math 56% / reading 74% proficiency, ranked #34 of 539 in PA (top 6%) — acceptable for families but not a draw, mixed tenant base, ~2y average lease; only 11% free/reduced lunch — higher-income household profile.
- Market conditions: Rents rising fast (+4.8%/yr); 217 active listings in the ZIP; 1 comparable units currently listed for rent nearby; high-income renter base; 1,513 units permitted in Chester County in 2024 (354 in 5+ unit buildings).
Forward outlook
- Local home prices are declining (-3.0%/yr); year-one equity from $2k of loan paydown is wiped out by about $9k of value loss. Plan a longer hold.
- Chester County population projected at +6% by 2050 — modest demand growth; plan on rents tracking national, not racing it.
Negotiation context
- It's been on market 125 days — a 12% lower offer ($264k) is reasonable based on typical stale-listing flexibility.
Risks & watch-outs
- Climate carrying-cost: major wind risk, 27% chance of damaging wind over 30y; extreme-heat days projected 7→14/yr by 2055 (HVAC capex compounding) — expect insurance premiums to compound above CPI over the hold.
Questions for the listing agent
- What do current leases actually rent for vs. the listed asking? Can we see a recent rent roll and the last 12 months of T-12 income?
- It's been on market 125 days. Have you received any prior offers? Is the seller open to a 12% concession, seller financing, or rate buy-down credit?
- Have any recent inspections been done? Can we get a copy of the seller's disclosures and any deferred-maintenance estimates?
- Built in 1974 — when were the roof, HVAC, electrical panel, plumbing, and water heater last replaced?
- What does the HOA fee cover, when was the last increase, and are there any pending special assessments or reserve-fund shortfalls?
- Why hasn't it sold? Are there any deal-killer items the seller is aware of (foundation, flood, title, zoning, code violations)?
- Is there a deadline driving the sale (1031 exchange, divorce, estate, relocation)? That informs how much negotiation room exists.
- The area grade is low — what's the realistic commute time and amenity access for the typical tenant pool here? Any planned neighborhood developments (good or bad) we should know about?
- What's the average days-on-market for RENTAL listings here right now (not sales)? A rising rental-DOM trend means longer vacancies and softer asking-rent achievability than the comps imply.
- What's the recent tenant-quality profile in this submarket — average credit score on applications, eviction rate, late-payment / NSF rate, and stable-employment percentage? A property-management company in the area should have these aggregated.
- How much new for-sale + rental construction is in the pipeline within 1–3 miles? Heavy new supply typically softens prices + rents 12–24 months out; constrained supply supports both.
Investment metrics
- 1% rule
- 1.04% ✓
- Cap rate
- 5.91%
- Cash-on-cash
- -1.38%
- DSCR
- 0.94
- GRM
- 8.0
CMA / ARV
- ARV (median comp)
- $424,558
- List price
- $300,000
- Delta
- -29.34%
- Verdict
- UNDERPRICED
- Comps
- 13 within 1.0 mi
Show comp detail 4 sales within ~0.75 mi
| Address | Dist | Beds/Ba | Sqft | Sold | Price | $/sf | Match |
|---|---|---|---|---|---|---|---|
| 134 Summit House #134 | 0.14mi | 4/2.5 | 2,832 (0%) | 11mo | $300,000 | $106 | 81 |
| 142 Summit House | 0.11mi | 4/2.5 | 2,832 (0%) | 15mo | $300,000 | $106 | 78 |
| 705 Westtown Cir #705 | 0.56mi | 3/3.5 (-1) | 2,439 (-14%) | 11mo | $455,000 | $187 | 29 |
| 1324 W West Chester Pike #306 | 0.63mi | 3/3.0 (-1) | 2,586 (-9%) | 21mo | $433,000 | $167 | 28 |
Match score weights: distance 35% · size 25% · config 20% · recency 20%. Top-matched comps best support the ARV.
Projected returns pro-forma
-3.0% appreciation · 4.79% rent growth · sell at horizon
- IRR
- -16.0%
- Equity multiple
- 0.42×
- Total profit
- $-48,720
- Equity at exit
- $44,731
- IRR
- -4.0%
- Equity multiple
- 0.71×
- Total profit
- $-24,715
- Equity at exit
- $25,939
Cash invested: $84,000 (down + closing). Projections, not guarantees.
Landlord ↔ Tenant lean methodology
- Overall (STATE)
- 62 Landlord-Friendly
- State Pennsylvania
- 62 Landlord-Friendly · EVEN
- County
- — inherits STATE
- City
- — inherits STATE
ZIP-level market 19382
- Rents YoY
- 4.8%
- Active inventory
- 217
- Price-to-rent
- 8.0×
Monthly cashflow live
- Estimated rent
- $3,106 medium interval (Pro) →
- Mortgage (P&I)
- −$1,573
- Tax est. 1.5%
- −$375 /mo · $4,500/yr
- Insurance
- −$125
- HOA
- −$477
- Vacancy / Maint / Mgmt
- −$652
- Net cashflow
- $-96
Break-even live
UW: 25.0% down · 7.5% · 30yr · 1.5% tax · 5.0% vac · 8.0% maint · 8.0% mgmt
Financing live
Cash to close
- Down payment
- $75,000
- Closing costs
- $9,000
- Reserves months
- —
- Total cash needed
- —
Loan-product check · same deal, 3 products live
Conventional
25% down · 7.5% · 30yr
- Down + closing
- —
- Monthly P&I
- —
- Monthly cashflow
- —
- DSCR
- —
- Eligible?
- —
Personal DTI + credit; lowest rate.
DSCR
20% down · 8.5% · 30yr
- Down + closing
- —
- Monthly P&I
- —
- Monthly cashflow
- —
- DSCR
- —
- Eligible?
- —
No personal income docs; deal must DSCR.
Hard money
10% down · 12.0% · 12mo
- Down + closing
- —
- Monthly P&I
- —
- Monthly cashflow
- —
- DSCR
- —
- Eligible?
- —
Short-term bridge; refi at stabilization.
Rent comps 1 comps
| Address | Beds | Baths | Sqft | Rent | $/sqft | DOM | Units | Dist |
|---|---|---|---|---|---|---|---|---|
| 1255 Eagle Rd West Chester, PA | 4.0 | 2.5 | 2306 | $3,750 | $1.63 | 18d | 1 | 1.03mi |
HOA detail
- Monthly dues
- $477 · $5,724/yr
Listing history 15 events
-
2026-06-18days on market $300,000 Active 125 DOM
-
2026-06-17days on market $300,000 Active 124 DOM
-
2026-06-16days on market $300,000 Active 123 DOM
-
2026-06-15days on market $300,000 Active 122 DOM
-
2026-06-13days on market $300,000 Active 120 DOM
-
2026-06-09days on market $300,000 Active 116 DOM
-
2026-06-08days on market $300,000 Active 115 DOM
-
2026-06-07days on market $300,000 Active 114 DOM
-
2026-06-04days on market $300,000 Active 111 DOM
-
2026-06-03days on market $300,000 Active 110 DOM
-
2026-06-02days on market $300,000 Active 109 DOM
-
2026-06-01days on market $300,000 Active 108 DOM
-
2026-05-31days on market $300,000 Active 107 DOM
-
2026-05-20price $300,000 721-char remark
Show marketing remark (721 chars)
Fabulous Townhouse in Summit House Community – East Goshen Township, Chester County, PA This charming townhouse, located within the desirable Summit House Community, was originally constructed in 1974 and offers approximately 2,832 square feet of interior living space. The home features a spacious living room, dining area, and kitchen, along with four bedrooms and one-and-a-half bathrooms. Additional highlights include a lower basement level, an attic area providing extra storage, and a private patio—perfect for relaxing after a long day. As part of a planned residential development, the property is governed by a homeowner's association, ensuring well-maintained surroundings and community amenities.
-
2026-02-14$310,000 Active 721-char remark
Show marketing remark (721 chars)
Fabulous Townhouse in Summit House Community – East Goshen Township, Chester County, PA This charming townhouse, located within the desirable Summit House Community, was originally constructed in 1974 and offers approximately 2,832 square feet of interior living space. The home features a spacious living room, dining area, and kitchen, along with four bedrooms and one-and-a-half bathrooms. Additional highlights include a lower basement level, an attic area providing extra storage, and a private patio—perfect for relaxing after a long day. As part of a planned residential development, the property is governed by a homeowner's association, ensuring well-maintained surroundings and community amenities.
ⓘ Source: listings_history table (triggers on properties + properties_extension) + one-shot
backfill from property_details.listing_events for pre-trigger history.
Climate risk First Street
- Flood 1/10 Low FEMA zone X (unshaded) · 0% chance over 30 yrs
- Wildfire 1/10 Low
- Heat 6/10 Major 7 d/yr ≥101°F today · 14 d/yr by 30 yrs out
- Wind 6/10 Major 27% chance of damaging wind over 30 yrs
- Air quality 4/10 Moderate 3 unhealthy d/yr today · 6 by 30 yrs out
Nearby sold comps map
Loading sold comps map…
Walkable amenities ~0.75 mi
Loading nearby amenities…
Taxation est. · year 1
- Rental income
- $37,273
- − Mortgage interest
- −$16,805
- − Property taxes
- −$4,500
- − Insurance
- −$1,500
- − Repairs & maintenance
- −$2,982
- − Management
- −$2,982
- − HOA
- −$5,724
- − Depreciation
- −$8,727
- Taxable loss
- −$5,946
- Est. tax savings @ 24.0%
- +$1,427
- After-tax cash flow
- $270/yr
For passive investors: Depreciation is non-cash, so a rental often shows a tax loss while cash-flowing — sheltering income. Rental losses are passive: they offset passive income freely, and up to $25,000/yr can offset ordinary (W-2) income if you actively participate and your MAGI is under $100k (phasing out to $0 by $150k); unused losses carry forward. On sale, claimed depreciation is recaptured at up to 25%, and gains may owe capital-gains tax (a 1031 exchange can defer both). Figures are a year-1 estimate at your 24.0% rate — not tax advice; consult a CPA.
Condition & rehab AI · 7 photos
This townhouse requires moderate repairs to its exterior siding and landscaping, but has good interior systems and potential for value increase with fresh paint and trimmed bushes.
Repairs flagged
- Major exterior siding — Significant wear and tear
- Minor landscaping — Overgrown bushes need trimming
Value-add opportunities
- Resale paint exterior — Fresh paint enhances curb appeal
- Rental trim bushes — Maintained landscaping attracts tenants
Renovation cost estimate screening
| Repair item | Severity | Est. cost |
|---|---|---|
| exterior siding · Significant wear and tear | Major | $15,000–50,000 |
| landscaping · Overgrown bushes need trimming | Minor | $500–3,000 |
| Total estimated repair cost · 2 items | $15,500–53,000 |
Value-add ROI direction
- Resale paint exterior — Fresh paint enhances curb appeal ↑
- Rental trim bushes — Maintained landscaping attracts tenants ↑
ⓘ Cost ranges are severity-bucket heuristics (US national rule-of-thumb). Get contractor quotes + a written scope before underwriting a rehab budget.
Schools (NCES district)
- District
- West Chester Area SD
- NCES district ID
- 4225290
- Math proficiency
- 56% ▼ -8.00%
- Reading proficiency
- 74% ▼ -6.00%
- Median HH income
- $87,125
- Composite
- 58.7/100
- National rank
- #980
- State rank
- #34 of 539 in PA
Livability — Cheyney University
- Score
- 49/100
- State rank
- #1706
- US rank
- #25761
Category grades
Schools grade is shown separately in the Schools card above.
Census & demographics
- County
- Chester County · 432,350 people
- Metro
- Philadelphia-Camden-Wilmington, PA-NJ-DE-MD
- Population (ZIP)
- 54,127
- Household income
- $132,091
- Rent vs Own
- Severe rent burden
- 1770.0
Population outlook (Chester County) Hauer SSP2
- Today (2025)
- 546,756 people
- By 2030
- 559,441 · +2.3%
- By 2040
- 576,377 · +5.4%
- By 2050
- 580,602 · +6.2%
- By 2075
- 581,575 · +6.4%
- By 2100
- 540,922 · -1.1%
Race, ethnicity, and origin ACS 2023
- Neighborhood character
- Predominantly White (82%)
- Race & ethnicity
- White 82% Black 6% Asian 5% Two or more races 5% Hispanic / Latino 4%
- Common ancestry
- Romanian 5% Slovak 2% Lithuanian 2%
- Foreign-born
- 8% · Canada, China
- Languages at home
- 92% English-only · Spanish 2% Other Indo-European 2% Chinese 1%
Political lean MEDSL · Chester
- 2024 margin
- D (+14.5) · D 56.7% · R 42.2% · Other 1.0%
- 2008→2024 swing
- +5.2pp toward D · 2008: 9.2pp · 2024: 14.5pp
- All cycles
- 2024: D+14.5 2020: D+17.0 2016: D+9.2 2012: R+0.4 2008: D+9.2
Not yet ingested
- Civics
- —
Market trends
- HPI YoY
- ▼ -251.24%
- Current HPI
- 294.9284
- Rent YoY
- ▲ 4.79%
- Metro
- Philadelphia-Camden-Wilmington, PA-NJ-DE-MD
- State GDP YoY
- ▲ 1.68%
- F500 in state
- 34
Industry mix (Fortune 500 HQ in PA)
| Industry | F500 HQs | Revenue |
|---|---|---|
| Healthcare | 2 | $309B |
|
||
| Insurance | 2 | $27B |
|
||
| Telecommunications / Media | 1 | $124B |
|
||
| Industrial Distribution | 1 | $22B |
|
||
| Financial Services | 1 | $20B |
|
||
| Chemicals / Materials | 1 | $18B |
|
||
Price history
-3.2% since first listed2 events — show timeline
- 2026-05-20 Price Changed $300,000 BRIGHT MLS
- 2026-02-14 Listed $310,000 BRIGHT MLS
Cash-flow waterfall
monthlySold comps — $/sqft
last 12 mo · ≤1 miLoading sold comps…