 Triplex
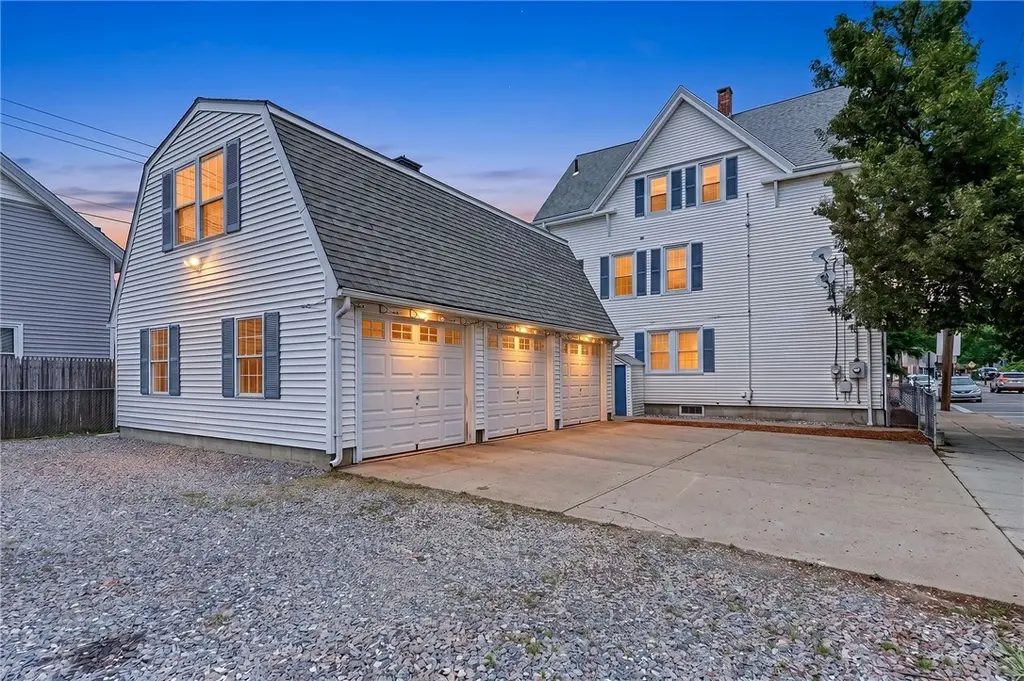
60 Purchase St · East Providence, RI
Flood risk 1/10 · Minimal
- FEMA flood zone
- X (unshaded)
- Chance of flooding over 30 yrs
- 0.0%
- Est. flood insurance / yr
- $473 – $860
Fire risk 1/10 · Minimal
- Est. fire insurance / yr
- $835 – $1,551
Heat risk 6/10 · Moderate
- Hot days now (above 98°F)
- 7 days/yr
- Hot days in 30 yrs
- 15 days/yr
Wind risk 6/10 · Moderate
- Chance of severe wind over 30 yrs
- 74.0%
Air-quality risk 2/10 · Minimal
- Unhealthy air days now
- 1 days/yr
- Unhealthy air days in 30 yrs
- 2 days/yr
Risk factors via First Street. Map © Google.
Why this score? — see what drove the F grade
The composite is a weighted blend of 9 inputs, each scored 0–100. Each bar is that input's sub-score; the figure is the points it added to the 100-point composite (weight × sub-score).
- Cash flow +15.4/30.0
- DSCR +4.7/10.0
- Livability +3.7/5.0
- 1% rule +3.6/10.0
- Rent growth +2.5/5.0
- Condition / age +2.5/5.0
- Schools +2.2/10.0
- ARV discount +0.0/15.0
- Appreciation +0.0/10.0
$769,000
🖨 Deal sheet 📄 Offer letter ✓ Due diligence
Multi-family units
County records classify this as Multi-Family (2-4 Unit). Listing-text estimate: 3 units. confirmed
Listing remarks MLS
NEW PRICE! Discover this exceptional 3 Family Home, perfectly situated just a mile from East Side of Providence and within close proximity to prestigious institutions such as Brown University, Providence College, RI College, and major medical facilities, enhancing the appeal for healthcare professionals and students alike. . This property has three bedrooms on each floor and additional income exists with separate laundry area with coin operated washer dryer that brings in additional income of 300-500/monthly which significantly increasing rental revenue. There are 9 off street parking areas in addition to the 3bay garage that offers further income potential, with an estimated rental income of $300 per month for each bay or 4 compact cars for an additional $300, making it an attractive opportunity perfect for collectors. This showroom garage has electric/heat/cable/ alarm, tiled floor, and power doors. Above the garage, there are three unfinished rooms that present an opportunity for renovation, increasing the property's value and rental income. This property is a rare find with immense potential for growth and profitability. Whether you're looking to expand your investment portfolio or seeking a residence that can generate income, this 3 family is a fantastic opportunity!
Key facts
- Off street parking
- Income potential
- 5,000 sq ft lot
Tags
Property features AI
Exterior
- Parking: Detached garage; 3 covered garage spaces; Total parking for up to 12 vehicles
- Utilities: Sewer connected; Water connected; Electric with circuit breakers
- Home design: Multi-family property with 3 units in one building
- Construction: Vinyl siding
- Exterior features: Lot approximately 0.1148 acre; Above-grade finished area reported as 2,400
Interior
- Kitchen: Gas water heater (appliance listed)
- Bedrooms: Three 3-bedroom units (each unit is three-bedroom)
- Flooring: Hardwood flooring; Vinyl flooring
- Bathrooms: Three full bathrooms (one per unit)
- Heating & cooling: Gas heating
- Interior features: Finished full basement with both interior and exterior entry; Total of 15 rooms
- Laundry & utility: Gas water heater
Neighborhood map
What this means for you Summary
Snapshot
- This is a 3 × 3-bed/1.0-bath units multifamily listed at $769k.
Deal economics
- At list price, monthly cash flow is $296 ($4k/yr) — positive. Per door: $99/mo.
- The deal already cash-flows at list — no discount required.
- To meet the 1% rule (rent ≥ 1% of price), the offer needs to be $660k (14.2% below list).
- Recommended offer: $660k (14.2% below list) — sets the bar for 1% rule.
- Cap rate 6.8% vs local median 3.2% in East Providence — top-decile yield for the area; either an underpriced asset or a hidden risk that comps aren't pricing in. Stress-test before assuming the spread holds.
Location & tenants
- Location reads 74/100 on livability (#12 in RI, #4,784 nationally) — a middle-class / working-renter tenant base. Strengths: crime A+, housing A+, health & safety A+; Watch: schools D-, amenities F, commute F.
- East Providence (suburban): math 18% / reading 31% proficiency, ranked #26 of 39 in RI (top 67%) — low school quality limits family demand, transient renter base, plan for 1-2y turnover.
- Market conditions: 62 active listings in the ZIP; 776 units permitted in Providence County in 2024 (229 in 5+ unit buildings).
- At $6,599/mo this rent would consume 129% of the median local household income ($61k/yr) (locally 1134% of renters already pay >50% of income on rent) — very limited rent-growth headroom before tenants either downsize or default.
Forward outlook
- Local home prices are declining (-3.0%/yr); year-one equity from $5k of loan paydown is wiped out by about $23k of value loss. Plan a longer hold.
- Providence County population projected at +5% by 2050 — modest demand growth; plan on rents tracking national, not racing it.
Negotiation context
- Only 11 days on market — expect competitive offers; lowballing is unlikely to land.
- 3 sale attempts with the ask held roughly flat each time — persistent listings suggest the price (not the market) is what's stuck; bring a comps-based counter.
- Current owner paid $600k; 28% above their basis — modest negotiation headroom, anchor on the comps not their cost.
Risks & watch-outs
- Watch-outs: built in 1900 — expect roof / HVAC / electrical / plumbing capex.
- Climate carrying-cost: major wind risk, 74% chance of damaging wind over 30y; extreme-heat days projected 7→15/yr by 2055 (HVAC capex compounding) — expect insurance premiums to compound above CPI over the hold.
Questions for the listing agent
- Can we see the unit-by-unit rent roll, current vacancy, and any below-market leases? What's the average tenancy length?
- What capital expenditures (roof, boiler, parking lot, exteriors) have been made in the last 5 years, and what's planned in the next 2?
- Built in 1900 — when were the roof, HVAC, electrical panel, plumbing, and water heater last replaced?
- Is there a deadline driving the sale (1031 exchange, divorce, estate, relocation)? That informs how much negotiation room exists.
- Schools are D-rated, which usually means shorter tenancies and higher turnover. Who's the typical renter profile here, and what's been the actual vacancy rate?
- The area grade is low — what's the realistic commute time and amenity access for the typical tenant pool here? Any planned neighborhood developments (good or bad) we should know about?
- What's the average days-on-market for RENTAL listings here right now (not sales)? A rising rental-DOM trend means longer vacancies and softer asking-rent achievability than the comps imply.
- What's the recent tenant-quality profile in this submarket — average credit score on applications, eviction rate, late-payment / NSF rate, and stable-employment percentage? A property-management company in the area should have these aggregated.
- How much new apartment / multifamily construction is in the pipeline within 1–3 miles? Heavy new supply (>2% of stock underway) typically softens rents 12–24 months out; light construction supports rent growth.
Investment metrics
- 1% rule
- 0.86% ✗
- Cap rate
- 6.76%
- Cash-on-cash
- 1.65%
- DSCR
- 1.07
- GRM
- 9.7
CMA / ARV
- ARV (on-the-fly)
- $609,600
- Comps found
- 12
Show comp detail 12 sales within ~0.75 mi
| Address | Dist | Beds/Ba | Sqft | Sold | Price | $/sf | Match |
|---|---|---|---|---|---|---|---|
| 114 116 Warren Ave | 0.14mi | 6/3.0 | 2,459 (+2%) | 11mo | $624,000 | $254 | 80 |
| 43 45 Mary Ave | 0.30mi | 6/3.0 | 2,405 (+0%) | 6mo | $454,000 | $189 | 80 |
| 62 64 4th St | 0.32mi | 6/3.0 | 2,394 (-0%) | 10mo | $625,000 | $261 | 76 |
| 4 S Carpenter St | 0.27mi | 6/2.0 | 2,265 (-6%) | 6mo | $599,900 | $265 | 69 |
| 85 87 Williams Ave | 0.46mi | 5/2.5 (-1) | 2,250 (-6%) | 1mo | $550,000 | $244 | 60 |
| 195 197 Lyon Ave | 0.45mi | 5/2.0 (-1) | 2,304 (-4%) | 8mo | $615,000 | $267 | 57 |
| 38 40 Vine St | 0.16mi | 7/3.0 (+1) | 2,736 (+14%) | 10mo | $657,000 | $240 | 56 |
| 72 74 North County St | 0.59mi | 6/2.0 | 2,448 (+2%) | 19mo | $540,000 | $221 | 50 |
| 233 Waterman Ave | 0.45mi | 5/3.0 (-1) | 2,665 (+11%) | 10mo | $617,000 | $232 | 47 |
| 164 166 Central Ave | 0.54mi | 6/3.0 | 2,125 (-12%) | 13mo | $610,000 | $287 | 44 |
| 182 184 2nd St | 0.67mi | 6/3.0 | 2,704 (+13%) | 6mo | $595,000 | $220 | 42 |
| 260 Grosvenor Ave | 0.71mi | 5/2.0 (-1) | 2,120 (-12%) | 4mo | $550,000 | $259 | 34 |
Match score weights: distance 35% · size 25% · config 20% · recency 20%. Top-matched comps best support the ARV.
Projected returns pro-forma
-3.0% appreciation · 3.0% rent growth · sell at horizon
- IRR
- -13.7%
- Equity multiple
- 0.51×
- Total profit
- $-105,877
- Equity at exit
- $114,660
- IRR
- -4.9%
- Equity multiple
- 0.68×
- Total profit
- $-68,475
- Equity at exit
- $66,489
Cash invested: $215,320 (down + closing). Projections, not guarantees.
Landlord ↔ Tenant lean methodology
- Overall (STATE)
- 31 Tenant-Leaning
- State Rhode Island
- 31 Tenant-Leaning · D+8
- County
- — inherits STATE
- City
- — inherits STATE
ZIP-level market 02914
- Active inventory
- 62
- Price-to-rent
- 29.1×
Monthly cashflow live
- Estimated rent
- $6,599 high interval (Pro) →
- Mortgage (P&I)
- −$4,033
- Tax from tax record
- −$564 /mo · $6,764/yr
- Insurance
- −$320
- HOA
- −$0
- Vacancy / Maint / Mgmt
- −$1,386
- Net cashflow
- $296
Break-even live
3-unit breakdown (identical units grouped — click to expand)
| Units | Beds | Baths | Est. rent |
|---|---|---|---|
| 3× units | 3 | 1 | $6,600 |
| #1 | 3 | 1 | $2,200 |
| #2 | 3 | 1 | $2,200 |
| #3 | 3 | 1 | $2,200 |
| Total (3 units) | $6,599 | ||
UW: 25.0% down · 7.5% · 30yr · 1.5% tax · 5.0% vac · 8.0% maint · 8.0% mgmt
Financing live
Cash to close
- Down payment
- $192,250
- Closing costs
- $23,070
- Reserves months
- —
- Total cash needed
- —
Loan-product check · same deal, 3 products live
Conventional
25% down · 7.5% · 30yr
- Down + closing
- —
- Monthly P&I
- —
- Monthly cashflow
- —
- DSCR
- —
- Eligible?
- —
Personal DTI + credit; lowest rate.
DSCR
20% down · 8.5% · 30yr
- Down + closing
- —
- Monthly P&I
- —
- Monthly cashflow
- —
- DSCR
- —
- Eligible?
- —
No personal income docs; deal must DSCR.
Hard money
10% down · 12.0% · 12mo
- Down + closing
- —
- Monthly P&I
- —
- Monthly cashflow
- —
- DSCR
- —
- Eligible?
- —
Short-term bridge; refi at stabilization.
Listing history 10 events
-
2026-06-19status $769,000 Pending 11 DOM
-
2026-06-18days on market $769,000 Active 11 DOM
-
2026-06-17days on market $769,000 Active 10 DOM
-
2026-06-16days on market $769,000 Active 9 DOM
-
2026-06-15days on market $769,000 Active 8 DOM
-
2026-06-13days on market $769,000 Active 6 DOM
-
2026-06-13days on market $769,000 Active 5 DOM
-
2026-06-09days on market $769,000 Active 2 DOM
-
2026-06-08remarks 699-char remark
-
2026-06-08$769,000 Active 1 DOM
ⓘ Source: listings_history table (triggers on properties + properties_extension) + one-shot
backfill from property_details.listing_events for pre-trigger history.
Tax reassessment forecast RI · Partial reset (capped growth)
- Current annual tax
- $6,764 · $564/mo
- Projected year-2 tax
- $9,649 · $804/mo
- Expected delta
- +$2,885/yr (+$240/mo · 42.7%)
ⓘ Screening estimate from a state-policy table — verify with the county assessor before closing.
Climate risk First Street
- Flood 1/10 Low FEMA zone X (unshaded) · 0% chance over 30 yrs
- Wildfire 1/10 Low
- Heat 6/10 Major 7 d/yr ≥98°F today · 15 d/yr by 30 yrs out
- Wind 6/10 Major 74% chance of damaging wind over 30 yrs
- Air quality 2/10 Low 1 unhealthy d/yr today · 2 by 30 yrs out
Nearby sold comps map
Loading sold comps map…
Walkable amenities ~0.75 mi
Loading nearby amenities…
Taxation est. · year 1
- Rental income
- $79,188
- − Mortgage interest
- −$43,076
- − Property taxes
- −$6,764
- − Insurance
- −$3,845
- − Repairs & maintenance
- −$6,335
- − Management
- −$6,335
- − Depreciation
- −$22,371
- Taxable loss
- −$9,538
- Est. tax savings @ 24.0%
- +$2,289
- After-tax cash flow
- $5,846/yr
For passive investors: Depreciation is non-cash, so a rental often shows a tax loss while cash-flowing — sheltering income. Rental losses are passive: they offset passive income freely, and up to $25,000/yr can offset ordinary (W-2) income if you actively participate and your MAGI is under $100k (phasing out to $0 by $150k); unused losses carry forward. On sale, claimed depreciation is recaptured at up to 25%, and gains may owe capital-gains tax (a 1031 exchange can defer both). Figures are a year-1 estimate at your 24.0% rate — not tax advice; consult a CPA.
Schools (NCES district)
- District
- East Providence
- NCES district ID
- 4400330
- Math proficiency
- 18% ▼ -8.00%
- Reading proficiency
- 31% ▼ -5.00%
- Median HH income
- $51,011
- Composite
- 21.69/100
- National rank
- #8274
- State rank
- #26 of 39 in RI
Livability — East Providence
- Score
- 74/100
- State rank
- #12
- US rank
- #4784
Category grades
Schools grade is shown separately in the Schools card above.
Census & demographics
- Census place
- East Providence, RI
- County
- Providence County · 548,917 people
- City population
- 38,586
- Metro
- Providence-Warwick, RI-MA
- Population (ZIP)
- 21,834
- Household income
- $61,191
- Rent vs Own
- Severe rent burden
- 1134.0
Population outlook (Providence County) Hauer SSP2
- Today (2025)
- 653,469 people
- By 2030
- 660,819 · +1.1%
- By 2040
- 672,747 · +3.0%
- By 2050
- 683,741 · +4.6%
- By 2075
- 720,435 · +10.2%
- By 2100
- 741,582 · +13.5%
Race, ethnicity, and origin ACS 2023
- Neighborhood character
- Predominantly White (67%)
- Race & ethnicity
- White 67% Two or more races 12% Hispanic / Latino 12% Black 8% Asian 4% Native American 1%
- Hispanic origin (detail)
- Puerto Rican 4% Dominican 3%
- Common ancestry
- Russian 29% Lithuanian 4% Romanian 3%
- Foreign-born
- 24% · Canada, China
- Languages at home
- 67% English-only · Other Indo-European 20% Spanish 7% French/Haitian/Cajun 2%
Political lean MEDSL · Providence
- 2024 margin
- D (+14.4) · D 56.1% · R 41.7% · Other 2.2%
- 2008→2024 swing
- -20.0pp toward R · 2008: 34.4pp · 2024: 14.4pp
- All cycles
- 2024: D+14.4 2020: D+22.9 2016: D+21.2 2012: D+34.9 2008: D+34.4
Not yet ingested
- Civics
- —
Market trends
- HPI YoY
- ▼ -461.46%
- Current HPI
- 323.298
- Rent YoY
- —
- Metro
- Providence-Warwick, RI-MA
- State GDP YoY
- ▲ 2.25%
- F500 in state
- 10
Industry mix (Fortune 500 HQ in RI)
| Industry | F500 HQs | Revenue |
|---|---|---|
| Healthcare | 1 | $373B |
|
||
| Food Distribution | 1 | $31B |
|
||
| Aerospace / Defense | 1 | $14B |
|
||
| Financial Services | 1 | $8B |
|
||
| Consumer Goods | 1 | $4B |
|
||
Price history
-9.5% since first listed8 events — show timeline
- 2026-06-07 Listed $769,000 RIS
- 2026-06-07 Listing Removed — RIS
- 2026-06-07 Listed $769,000 RIS
- 2026-03-06 Sold (MLS) $600,000 RIS
- 2026-02-11 Pending — RIS
- 2026-01-17 Price Changed $675,000 RIS
- 2025-12-16 Price Changed $750,000 RIS
- 2025-12-03 Listed $850,000 RIS
Property tax history
+2.0%/yrLatest (2025): $6,764 · +6.6% YoY. Source: county tax records.
Cash-flow waterfall
monthlySold comps — $/sqft
last 12 mo · ≤1 miLoading sold comps…