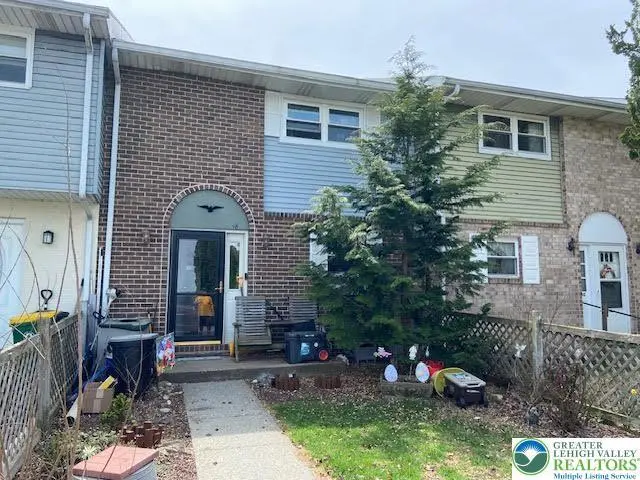
48 Willow St · Macungie, PA
Flood risk 1/10 · Minimal
- FEMA flood zone
- X (unshaded)
- Chance of flooding over 30 yrs
- 0.0%
- Est. flood insurance / yr
- $473 – $860
Fire risk 4/10 · Minor
- Est. fire insurance / yr
- $511 – $949
Heat risk 5/10 · Moderate
- Hot days now (above 98°F)
- 7 days/yr
- Hot days in 30 yrs
- 15 days/yr
Wind risk 4/10 · Minor
- Chance of severe wind over 30 yrs
- 19.0%
Air-quality risk 3/10 · Minor
- Unhealthy air days now
- 2 days/yr
- Unhealthy air days in 30 yrs
- 3 days/yr
Risk factors via First Street. Map © Google.
Why this score? — see what drove the D+ grade
The composite is a weighted blend of 9 inputs, each scored 0–100. Each bar is that input's sub-score; the figure is the points it added to the 100-point composite (weight × sub-score).
- ARV discount +15.0/15.0
- Cash flow +12.3/30.0
- Schools +4.8/10.0
- Livability +3.9/5.0
- DSCR +3.7/10.0
- 1% rule +3.4/10.0
- Rent growth +2.5/5.0
- Condition / age +2.5/5.0
- Appreciation +0.0/10.0
$260,000
🖨 Deal sheet (PDF) 📄 Offer letter ✓ Due diligence
Listing remarks
This 3-bedroom, 1.5-bath townhouse is quietly located on a cul-de-sac in Macungie Village. Recent improvements include newer windows, roof, and front door, along with a central air and heat pump system that’s just 5 years old. The first floor features a welcoming foyer, spacious living room, dining room, and an eat-in kitchen. A partially finished basement with a Bilco door provides additional flexible space. Outside, enjoy a covered deck complete with a ceiling fan—perfect for relaxing or entertaining. The home offers solid major updates but could benefit from some TLC to truly shine. Sale is contingent upon the seller securing suitable housing.
Key facts
- Newer roof
- Newer front door
- Newer windows
Tags
Neighborhood map
What this means for you Summary
Snapshot
- This is a 3-bed/1.5-bath single-family listed at $260k.
Deal economics
- At list price, monthly cash flow is $-46 ($-547/yr) — negative.
- To cash-flow at today's rent, offer at most $252k (3.1% below list).
- To meet the 1% rule (rent ≥ 1% of price), the offer needs to be $219k (15.9% below list).
- Recommended offer: $219k (15.9% below list) — sets the bar for 1% rule.
- Cap rate 6.1% vs local median 2.8% in Macungie — top-decile yield for the area; either an underpriced asset or a hidden risk that comps aren't pricing in. Stress-test before assuming the spread holds.
Location & tenants
- Location reads 77/100 on livability (#361 in PA, #3,157 nationally) — a middle-class / working-renter tenant base. Strengths: crime A+, housing A+, cost of living A; Watch: amenities F, commute F.
- East Penn SD (suburban): math 43% / reading 65% proficiency, ranked #103 of 539 in PA (top 19%) — acceptable for families but not a draw, mixed tenant base, ~2y average lease; only 17% free/reduced lunch — higher-income household profile.
- Zoned schools: Macungie El Sch (math 45% / reading 65%, grade C, #498 of 1,518 statewide, top 33%, 510 students, 29% FRL); Lower Macungie Ms (math 23% / reading 61%, grade D-, #221 of 512 statewide, top 45%, 1,043 students, 36% FRL); Emmaus Hs (math 65% / reading 24%, grade D-, #195 of 437 statewide, top 44%, 2,846 students, 24% FRL).
- Market conditions: Rents flat; 162 active listings in the ZIP; 10 comparable units currently listed for rent nearby; rentals at typical pace (median 25d on market — plan ~3-4 weeks tenant-placement turnaround); high-income renter base; 765 units permitted in Lehigh County in 2024 (286 in 5+ unit buildings).
Forward outlook
- Local home prices are declining (-3.0%/yr); year-one equity from $2k of loan paydown is wiped out by about $8k of value loss. Plan a longer hold.
- Lehigh County population projected at +21% by 2050 — long-run rental-demand tailwind backs the buy-and-hold thesis.
Negotiation context
- Only 10 days on market — expect competitive offers; lowballing is unlikely to land.
- Current owner paid $48k; list at $260k implies a 443% gain — meaningful room to come down on a strong offer.
Risks & watch-outs
- Climate carrying-cost: extreme-heat days projected 7→15/yr by 2055 (HVAC capex compounding) — expect insurance premiums to compound above CPI over the hold.
Questions for the listing agent
- What do current leases actually rent for vs. the listed asking? Can we see a recent rent roll and the last 12 months of T-12 income?
- Built in 1977 — when were the roof, HVAC, electrical panel, plumbing, and water heater last replaced?
- Is there a deadline driving the sale (1031 exchange, divorce, estate, relocation)? That informs how much negotiation room exists.
- Schools are B-rated — typically a magnet for longer-tenancy family renters. What's the average tenant stay here, and is there a school-zone premium baked into asking?
- The area grade is low — what's the realistic commute time and amenity access for the typical tenant pool here? Any planned neighborhood developments (good or bad) we should know about?
- What's the average days-on-market for RENTAL listings here right now (not sales)? A rising rental-DOM trend means longer vacancies and softer asking-rent achievability than the comps imply.
- What's the recent tenant-quality profile in this submarket — average credit score on applications, eviction rate, late-payment / NSF rate, and stable-employment percentage? A property-management company in the area should have these aggregated.
- How much new for-sale + rental construction is in the pipeline within 1–3 miles? Heavy new supply typically softens prices + rents 12–24 months out; constrained supply supports both.
Investment metrics
- 1% rule
- 0.84% ✗
- Cap rate
- 6.08%
- Cash-on-cash
- -0.75%
- DSCR
- 0.97
- GRM
- 9.9
CMA / ARV
- ARV (on-the-fly)
- $344,080
- Comps found
- 5
Show comp detail 5 sales within ~0.75 mi
| Address | Dist | Beds/Ba | Sqft | Sold | Price | $/sf | Match |
|---|---|---|---|---|---|---|---|
| 106 S Lea St | 0.15mi | 3/1.0 | 1,300 (-4%) | 15mo | $255,000 | $196 | 72 |
| 109 Race St | 0.21mi | 3/1.5 | 1,473 (+8%) | 15mo | $372,000 | $253 | 64 |
| 23 S Buttonwood St | 0.51mi | 3/1.5 | 1,360 (0%) | 16mo | $275,000 | $202 | 63 |
| 91 Maple St | 0.53mi | 3/3.0 | 1,488 (+9%) | 10mo | $395,000 | $265 | 45 |
| 38 S Fairview St | 0.61mi | 3/1.5 | 1,300 (-4%) | 24mo | $391,000 | $301 | 44 |
Match score weights: distance 35% · size 25% · config 20% · recency 20%. Top-matched comps best support the ARV.
Projected returns pro-forma
-3.0% appreciation · 0.13% rent growth · sell at horizon
- IRR
- -20.8%
- Equity multiple
- 0.30×
- Total profit
- $-51,156
- Equity at exit
- $38,767
- IRR
- -22.2%
- Equity multiple
- 0.01×
- Total profit
- $-71,998
- Equity at exit
- $22,480
Cash invested: $72,800 (down + closing). Projections, not guarantees.
Landlord ↔ Tenant lean methodology
- Overall (STATE)
- 62 Landlord-Friendly
- State Pennsylvania
- 62 Landlord-Friendly · EVEN
- County
- — inherits STATE
- City
- — inherits STATE
ZIP-level market 18062
- Home prices YoY
- -26.4%
- Rents YoY
- 0.1%
- Active inventory
- 162
- Price-to-rent
- 9.9×
Monthly cashflow live
- Estimated rent
- $2,187 high interval (Pro) →
- Mortgage (P&I)
- −$1,363
- Tax from tax record
- −$302 /mo · $3,620/yr
- Insurance
- −$108
- HOA
- −$0
- Vacancy / Maint / Mgmt
- −$459
- Net cashflow
- $-46
Break-even live
Sensitivity live
| Price | -10% $102 | -5% $28 | +0% $-46 | +5% $-119 | +10% $-193 |
|---|---|---|---|---|---|
| Rent | -10% $-218 | -5% $-132 | +0% $-46 | +5% $41 | +10% $127 |
| Rate | -1.0pp $85 | -0.5pp $21 | base $-46 | +0.5pp $-113 | +1.0pp $-181 |
UW: 25.0% down · 7.5% · 30yr · 1.5% tax · 5.0% vac · 8.0% maint · 8.0% mgmt
Financing live
Cash to close
- Down payment
- $65,000
- Closing costs
- $7,800
- Reserves months
- —
- Total cash needed
- —
Loan-product check · same deal, 3 products live
Conventional
25% down · 7.5% · 30yr
- Down + closing
- —
- Monthly P&I
- —
- Monthly cashflow
- —
- DSCR
- —
- Eligible?
- —
Personal DTI + credit; lowest rate.
DSCR
20% down · 8.5% · 30yr
- Down + closing
- —
- Monthly P&I
- —
- Monthly cashflow
- —
- DSCR
- —
- Eligible?
- —
No personal income docs; deal must DSCR.
Hard money
10% down · 12.0% · 12mo
- Down + closing
- —
- Monthly P&I
- —
- Monthly cashflow
- —
- DSCR
- —
- Eligible?
- —
Short-term bridge; refi at stabilization.
Rent comps 10 comps
| Address | Beds | Baths | Sqft | Rent | $/sqft | DOM | Units | Dist |
|---|---|---|---|---|---|---|---|---|
| 268 W Chestnut St Macungie, PA | 1.0–2.0 | 1.0–1.5 | 944 | $1,939 | $2.05 | 3d | 5 | 0.07mi |
| 21 W Main St Unit 2 Macungie, PA | 3.0 | 2.0 | 1100 | $1,950 | $1.77 | 25d | 1 | 0.38mi |
| 21 W Main St Unit 2 Macungie, PA | 3.0 | 2.0 | 1100 | $1,950 | $1.77 | 45d | 1 | 0.38mi |
| 31 W Main St Macungie, PA | 2.0 | 1.0 | 925 | $1,500 | $1.62 | 25d | 1 | 0.39mi |
| 3370 Pennsylvania 100 Macungie, PA | 2.0 | 2.0 | 1350 | $2,810 | $2.08 | 4d | 1 | 0.58mi |
| 3535 Grandview Dr Macungie, PA | 1.0–2.0 | 1.0–2.0 | 1015 | $2,465 | $2.43 | 0d | 23 | 0.60mi |
| 302 Windsor Pl #302 Macungie, PA | 2.0 | 2.0 | 1260 | $1,925 | $1.53 | 45d | 1 | 0.74mi |
| 168 Lindfield Cir Macungie, PA | 2.0 | 2.0 | 1275 | $1,980 | $1.55 | 25d | 1 | 0.77mi |
| 163 Lindfield Cir Macungie, PA | 2.0 | 2.0 | 940 | $2,150 | $2.29 | 45d | 1 | 0.77mi |
| 2847 Sequoia Dr Macungie, PA | 3.0 | 2.5 | 1440 | $2,450 | $1.70 | 25d | 1 | 1.14mi |
Listing history 3 events
-
2026-04-27status Pending
-
2026-04-17$260,000 Active
-
1980-11-19soldstatus $47,900
ⓘ Source: listings_history table (triggers on properties + properties_extension) + one-shot
backfill from property_details.listing_events for pre-trigger history.
Tax reassessment forecast PA · Partial reset (capped growth)
- Current annual tax
- $3,620 · $302/mo
- Projected year-2 tax
- $3,864 · $322/mo
- Expected delta
- +$244/yr (+$20/mo · 6.7%)
ⓘ Screening estimate from a state-policy table — verify with the county assessor before closing.
Climate risk First Street
- Flood 1/10 Low FEMA zone X (unshaded) · 0% chance over 30 yrs
- Wildfire 4/10 Moderate
- Heat 5/10 Major 7 d/yr ≥98°F today · 15 d/yr by 30 yrs out
- Wind 4/10 Moderate 19% chance of damaging wind over 30 yrs
- Air quality 3/10 Moderate 2 unhealthy d/yr today · 3 by 30 yrs out
Nearby sold comps map
Loading sold comps map…
Walkable amenities ~0.75 mi
Loading nearby amenities…
Taxation est. · year 1
- Rental income
- $26,247
- − Mortgage interest
- −$14,564
- − Property taxes
- −$3,620
- − Insurance
- −$1,300
- − Repairs & maintenance
- −$2,100
- − Management
- −$2,100
- − Depreciation
- −$7,564
- Taxable loss
- −$5,001
- Est. tax savings @ 24.0%
- +$1,200
- After-tax cash flow
- $653/yr
For passive investors: Depreciation is non-cash, so a rental often shows a tax loss while cash-flowing — sheltering income. Rental losses are passive: they offset passive income freely, and up to $25,000/yr can offset ordinary (W-2) income if you actively participate and your MAGI is under $100k (phasing out to $0 by $150k); unused losses carry forward. On sale, claimed depreciation is recaptured at up to 25%, and gains may owe capital-gains tax (a 1031 exchange can defer both). Figures are a year-1 estimate at your 24.0% rate — not tax advice; consult a CPA.
Schools (NCES district)
- District
- East Penn SD
- NCES district ID
- 4208550
- Math proficiency
- 43% ▼ -11.00%
- Reading proficiency
- 65% ▼ -9.00%
- Median HH income
- $70,679
- Composite
- 47.99/100
- National rank
- #2200
- State rank
- #103 of 539 in PA
Livability — Macungie
- Score
- 77/100
- State rank
- #361
- US rank
- #3157
Category grades
Schools grade is shown separately in the Schools card above.
Census & demographics
- Census place
- Macungie, PA
- County
- Lehigh County · 333,019 people
- City population
- 27,110
- Metro
- Allentown-Bethlehem-Easton, PA-NJ
- Population (ZIP)
- 27,110
- Household income
- $110,675
- Rent vs Own
- Severe rent burden
- 537.0
Population outlook (Lehigh County) Hauer SSP2
- Today (2025)
- 392,957 people
- By 2030
- 408,319 · +3.9%
- By 2040
- 440,007 · +12.0%
- By 2050
- 475,940 · +21.1%
- By 2075
- 590,448 · +50.3%
- By 2100
- 690,314 · +75.7%
Race, ethnicity, and origin ACS 2023
- Neighborhood character
- Predominantly White (77%)
- Race & ethnicity
- White 77% Hispanic / Latino 10% Two or more races 10% Asian 5% Black 3%
- Hispanic origin (detail)
- Puerto Rican 4% Dominican 2%
- Common ancestry
- Romanian 5% Lithuanian 2% Subsaharan African 2%
- Foreign-born
- 11% · Canada, China, Jamaica
- Languages at home
- 83% English-only · Spanish 7% Other Indo-European 4% French/Haitian/Cajun 2%
Political lean MEDSL · Lehigh
- 2024 margin
- Toss-up / Even · D 50.7% · R 48.0% · Other 1.2%
- 2008→2024 swing
- -12.9pp toward R · 2008: 15.6pp · 2024: 2.7pp
- All cycles
- 2024: D+2.7 2020: D+7.6 2016: D+4.4 2012: D+7.5 2008: D+15.6
Not yet ingested
- Civics
- —
Market trends
- HPI YoY
- ▼ -91.04%
- Current HPI
- 253.5939
- Rent YoY
- ▲ 0.13%
- Metro
- Allentown-Bethlehem-Easton, PA-NJ
- State GDP YoY
- ▲ 1.68%
- F500 in state
- 34
Industry mix (Fortune 500 HQ in PA)
| Industry | F500 HQs | Revenue |
|---|---|---|
| Healthcare | 2 | $309B |
|
||
| Insurance | 2 | $27B |
|
||
| Telecommunications / Media | 1 | $124B |
|
||
| Industrial Distribution | 1 | $22B |
|
||
| Financial Services | 1 | $20B |
|
||
| Chemicals / Materials | 1 | $18B |
|
||
Price history
+442.8% since first listed3 events — show timeline
- 2026-04-27 Pending — GLVRMLS
- 2026-04-17 Listed $260,000 GLVRMLS
- 1980-11-19 Sold (Public Records) $47,900 Public Records
Property tax history
+2.2%/yrLatest (2026): $3,620 · +2.9% YoY. Source: county tax records.
Cash-flow waterfall
monthlySold comps — $/sqft
last 12 mo · ≤1 miLoading sold comps…