1 Bushwack Rd · Golconda, IL
Flood risk 4/10 · Minor
- FEMA flood zone
- —
- Chance of flooding over 30 yrs
- 0.2%
- Est. flood insurance / yr
- —
Fire risk 4/10 · Minor
- Est. fire insurance / yr
- $804 – $1,492
Heat risk 5/10 · Moderate
- Hot days now (above 106°F)
- 7 days/yr
- Hot days in 30 yrs
- 21 days/yr
Wind risk 3/10 · Minor
- Chance of severe wind over 30 yrs
- 5.0%
Air-quality risk 2/10 · Minimal
- Unhealthy air days now
- 1 days/yr
- Unhealthy air days in 30 yrs
- 3 days/yr
Risk factors via First Street. Map © Google.
Why this score? — see what drove the D grade
The composite is a weighted blend of 9 inputs, each scored 0–100. Each bar is that input's sub-score; the figure is the points it added to the 100-point composite (weight × sub-score).
- Cash flow +11.0/30.0
- ARV discount +7.5/15.0
- Appreciation +6.6/10.0
- DSCR +3.2/10.0
- Livability +3.1/5.0
- 1% rule +2.6/10.0
- Rent growth +2.5/5.0
- Condition / age +2.5/5.0
- Schools +1.4/10.0
$139,900
🖨 Deal sheet 📄 Offer letter ✓ Due diligence
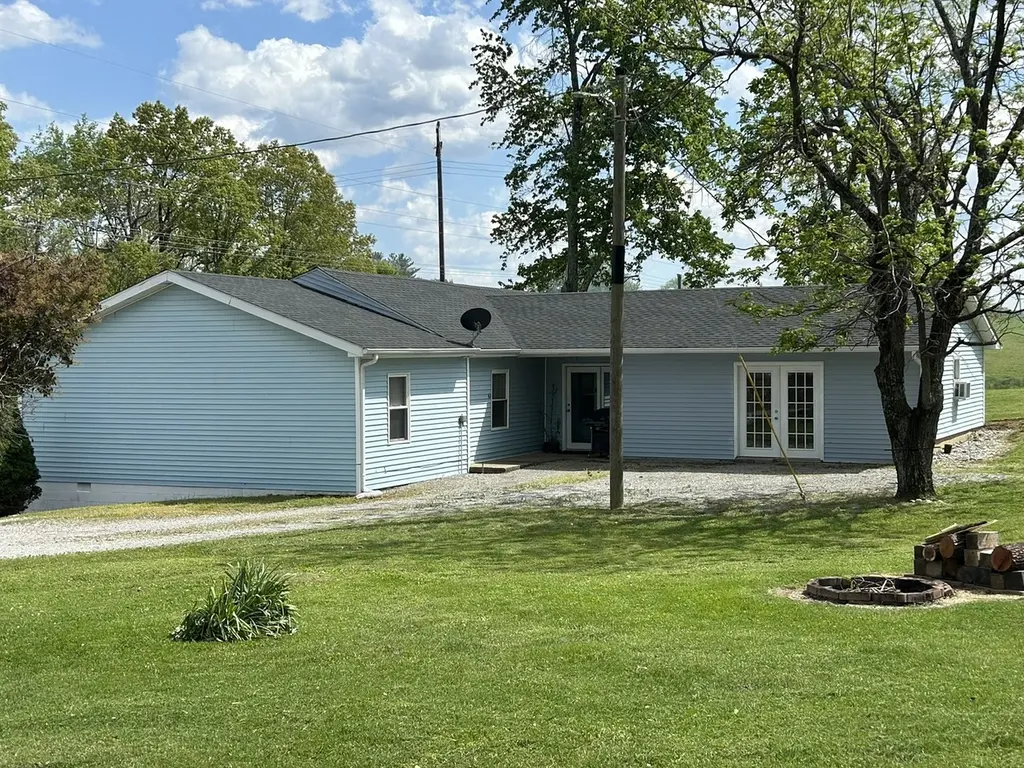
Listing remarks
3 bedroom, 1 bathroom home on +/- 3.5 acres located in the heart of the Shawnee National Forest. There is an abundance of horse trails nearby. Just minutes away from the Golconda Marina. Garage is being used as an entertainment room but can be easily converted back into a garage. The roof was replaced in 2024, water heater replaced in 2022 and some new flooring.
Key facts
- Horse trails
- New flooring
- Entertainment room
Tags
Property features AI
Finance
- Other: Fee simple ownership
- HOA & community: No master association fee required
Exterior
- Parking: Attached garage with 2 parking spaces (2 total)
- Utilities: Public water; Septic (mechanical); Electrical service available
- Home design: Detached single-family home; One-story
- Construction: Built approximately 61–70 years ago; Built before 1978
- Exterior features: Vinyl siding; Lot reported as 3.0–3.99 acres; Property is in an unincorporated area
Interior
- Kitchen: Updated kitchen on the main level (approx. 10 x 9); Range; Refrigerator; Gas cooktop
- Bedrooms: Master bedroom on the main level (approx. 14 x 17) with carpet; Two additional main-level bedrooms (each approx. 13 x 10) with laminate; An additional bedroom listed (details not specified)
- Flooring: Hardwood in dining room and kitchen areas; Laminate in living room and two bedrooms; Carpet in master bedroom; Linoleum in laundry
- Bathrooms: One full bathroom
- Heating & cooling: Natural gas forced-air heating; Central air conditioning; Gas-log fireplace located in the living room
- Interior features: Seven total rooms; Partial cellar basement
- Laundry & utility: Main-level laundry room (approx. 8 x 7) with linoleum flooring
Neighborhood map
What this means for you Summary
Snapshot
- This is a 3-bed/1.0-bath single-family listed at $140k.
Deal economics
- At list price, monthly cash flow is $-60 ($-715/yr) — negative.
- To cash-flow at today's rent, offer at most $129k (7.5% below list).
- To meet the 1% rule (rent ≥ 1% of price), the offer needs to be $106k (24.0% below list).
- Recommended offer: $106k (24.0% below list) — sets the bar for 1% rule.
Location & tenants
- Location reads 61/100 on livability (#920 in IL) — a middle-class / working-renter tenant base. Strengths: cost of living A+, housing A+, crime A; Watch: schools F, amenities F, commute F.
- Pope County CUD 1 (rural): math 9% / reading 25% proficiency, ranked #492 of 620 in IL (top 79%) — low school quality limits family demand, transient renter base, plan for 1-2y turnover.
- Market conditions: 12 active listings in the ZIP.
Forward outlook
- In year one you build about $5k of equity ($967 loan paydown + $4k appreciation (3.2% local appreciation)).
- Pope County population projected at -21% by 2050 — secular population decline; favor cash flow + early exit over multi-decade hold.
- At projected returns (3.2% appreciation + 3.0% rent growth), your $39k cash investment doubles in ~7 years — after that, you're playing with house money.
- By year 7, paydown + projected appreciation supports a ~$34k cash-out refi (75% LTV) — recoverable capital for the next deal without selling this one.
Negotiation context
- It's been on market 30 days — a 2% lower offer ($138k) is reasonable based on typical stale-listing flexibility.
Risks & watch-outs
- Climate carrying-cost: extreme-heat days projected 7→21/yr by 2055 (HVAC capex compounding) — expect insurance premiums to compound above CPI over the hold.
Questions for the listing agent
- What do current leases actually rent for vs. the listed asking? Can we see a recent rent roll and the last 12 months of T-12 income?
- Built in 1960 — when were the roof, HVAC, electrical panel, plumbing, and water heater last replaced?
- Is there a deadline driving the sale (1031 exchange, divorce, estate, relocation)? That informs how much negotiation room exists.
- Schools are F-rated, which usually means shorter tenancies and higher turnover. Who's the typical renter profile here, and what's been the actual vacancy rate?
- The area grade is low — what's the realistic commute time and amenity access for the typical tenant pool here? Any planned neighborhood developments (good or bad) we should know about?
- What's the average days-on-market for RENTAL listings here right now (not sales)? A rising rental-DOM trend means longer vacancies and softer asking-rent achievability than the comps imply.
- What's the recent tenant-quality profile in this submarket — average credit score on applications, eviction rate, late-payment / NSF rate, and stable-employment percentage? A property-management company in the area should have these aggregated.
- How much new for-sale + rental construction is in the pipeline within 1–3 miles? Heavy new supply typically softens prices + rents 12–24 months out; constrained supply supports both.
Investment metrics
- 1% rule
- 0.76% ✗
- Cap rate
- 5.78%
- Cash-on-cash
- -1.83%
- DSCR
- 0.92
- GRM
- 11.0
CMA / ARV
No comps found within radius.
Projected returns pro-forma
3.2% appreciation · 3.0% rent growth · sell at horizon
- IRR
- 6.4%
- Equity multiple
- 1.37×
- Total profit
- $14,527
- Equity at exit
- $64,495
- IRR
- 9.1%
- Equity multiple
- 2.41×
- Total profit
- $55,183
- Equity at exit
- $100,648
Cash invested: $39,172 (down + closing). Projections, not guarantees.
Landlord ↔ Tenant lean methodology
- Overall (STATE)
- 43 Moderately Tenant-Leaning
- State Illinois
- 43 Moderately Tenant-Leaning · D+7
- County
- — inherits STATE
- City
- — inherits STATE
ZIP-level market 62938
- Home prices YoY
- 4.2%
- Active inventory
- 12
- Price-to-rent
- 11.0×
Monthly cashflow live
- Estimated rent
- $1,063 medium interval (Pro) →
- Mortgage (P&I)
- −$734
- Tax from tax record
- −$108 /mo · $1,293/yr
- Insurance
- −$58
- HOA
- −$0
- Vacancy / Maint / Mgmt
- −$223
- Net cashflow
- $-60
Break-even live
UW: 25.0% down · 7.5% · 30yr · 1.5% tax · 5.0% vac · 8.0% maint · 8.0% mgmt
Financing live
Cash to close
- Down payment
- $34,975
- Closing costs
- $4,197
- Reserves months
- —
- Total cash needed
- —
Loan-product check · same deal, 3 products live
Conventional
25% down · 7.5% · 30yr
- Down + closing
- —
- Monthly P&I
- —
- Monthly cashflow
- —
- DSCR
- —
- Eligible?
- —
Personal DTI + credit; lowest rate.
DSCR
20% down · 8.5% · 30yr
- Down + closing
- —
- Monthly P&I
- —
- Monthly cashflow
- —
- DSCR
- —
- Eligible?
- —
No personal income docs; deal must DSCR.
Hard money
10% down · 12.0% · 12mo
- Down + closing
- —
- Monthly P&I
- —
- Monthly cashflow
- —
- DSCR
- —
- Eligible?
- —
Short-term bridge; refi at stabilization.
Listing history 16 events
-
2026-06-18days on market $139,900 Active 30 DOM
-
2026-06-17days on market $139,900 Active 29 DOM
-
2026-06-16days on market $139,900 Active 28 DOM
-
2026-06-15days on market $139,900 Active 27 DOM
-
2026-06-13days on market $139,900 Active 25 DOM
-
2026-06-12days on market $139,900 Active 24 DOM
-
2026-06-09days on market $139,900 Active 21 DOM
-
2026-06-08days on market $139,900 Active 20 DOM
-
2026-06-07days on market $139,900 Active 19 DOM
-
2026-06-07days on market $139,900 Active 18 DOM
-
2026-06-04days on market $139,900 Active 15 DOM
-
2026-06-02days on market $139,900 Active 14 DOM
-
2026-06-01days on market $139,900 Active 13 DOM
-
2026-05-31days on market $139,900 Active 12 DOM
-
2026-05-31days on market $139,900 Active 11 DOM
-
2026-05-19$139,900 Active
ⓘ Source: listings_history table (triggers on properties + properties_extension) + one-shot
backfill from property_details.listing_events for pre-trigger history.
Tax reassessment forecast IL · Partial reset (capped growth)
- Current annual tax
- $1,293 · $108/mo
- Projected year-2 tax
- $2,234 · $186/mo
- Expected delta
- +$942/yr (+$78/mo · 72.9%)
ⓘ Screening estimate from a state-policy table — verify with the county assessor before closing.
Climate risk First Street
- Flood 4/10 Moderate 20% chance over 30 yrs
- Wildfire 4/10 Moderate
- Heat 5/10 Major 7 d/yr ≥106°F today · 21 d/yr by 30 yrs out
- Wind 3/10 Moderate 5% chance of damaging wind over 30 yrs
- Air quality 2/10 Low 1 unhealthy d/yr today · 3 by 30 yrs out
Nearby sold comps map
Loading sold comps map…
Walkable amenities ~0.75 mi
Loading nearby amenities…
Taxation est. · year 1
- Rental income
- $12,761
- − Mortgage interest
- −$7,837
- − Property taxes
- −$1,293
- − Insurance
- −$700
- − Repairs & maintenance
- −$1,021
- − Management
- −$1,021
- − Depreciation
- −$4,070
- Taxable loss
- −$3,180
- Est. tax savings @ 24.0%
- +$763
- After-tax cash flow
- $48/yr
For passive investors: Depreciation is non-cash, so a rental often shows a tax loss while cash-flowing — sheltering income. Rental losses are passive: they offset passive income freely, and up to $25,000/yr can offset ordinary (W-2) income if you actively participate and your MAGI is under $100k (phasing out to $0 by $150k); unused losses carry forward. On sale, claimed depreciation is recaptured at up to 25%, and gains may owe capital-gains tax (a 1031 exchange can defer both). Figures are a year-1 estimate at your 24.0% rate — not tax advice; consult a CPA.
Schools (NCES district)
- District
- Pope County CUD 1
- NCES district ID
- 1732280
- Math proficiency
- 9% ▼ -9.00%
- Reading proficiency
- 25% ▼ -12.00%
- Median HH income
- $39,354
- Composite
- 14.35/100
- National rank
- #9439
- State rank
- #492 of 620 in IL
Livability — Golconda
- Score
- 61/100
- State rank
- #920
- US rank
- #17824
Category grades
Schools grade is shown separately in the Schools card above.
Census & demographics
- Population (ZIP)
- 2,659
Population outlook (Pope County) Hauer SSP2
- Today (2025)
- 4,108 people
- By 2030
- 3,980 · -3.1%
- By 2040
- 3,640 · -11.4%
- By 2050
- 3,259 · -20.7%
- By 2075
- 2,518 · -38.7%
- By 2100
- 2,195 · -46.6%
Race, ethnicity, and origin ACS 2023
- Neighborhood character
- Predominantly White (86%)
- Race & ethnicity
- White 86% Black 7% Hispanic / Latino 3% Two or more races 3% Native American 3%
- Common ancestry
- Lithuanian 3% Portuguese 2% Iranian 2%
- Foreign-born
- 1% · Canada
- Languages at home
- 96% English-only · Spanish 3%
Political lean MEDSL · Pope
- 2024 margin
- Solid R (+60.1) · D 19.5% · R 79.6%
- 2008→2024 swing
- -37.8pp toward R · 2008: -22.3pp · 2024: -60.1pp
- All cycles
- 2024: R+60.1 2020: R+59.3 2016: R+61.2 2012: R+38.8 2008: R+22.3
Not yet ingested
- Civics
- —
Market trends
- HPI YoY
- ▲ 3.20%
- Current HPI
- 78.5175
- Rent YoY
- —
- Metro
- —
- State GDP YoY
- ▲ 1.59%
- F500 in state
- 60
Industry mix (Fortune 500 HQ in IL)
| Industry | F500 HQs | Revenue |
|---|---|---|
| Insurance | 4 | $201B |
|
||
| Consumer Goods | 4 | $87B |
|
||
| Industrial Machinery | 3 | $64B |
|
||
| Healthcare | 2 | $55B |
|
||
| Retail / Pharmacy | 1 | $148B |
|
||
| Agriculture / Food | 1 | $86B |
|
||
Price history
1 event — show timeline
- 2026-05-19 Listed $139,900 MRED as Distributed by MLS Grid
Property tax history
-3.0%/yrLatest (2024): $1,293 · -3.0% YoY. Source: county tax records.
Cash-flow waterfall
monthlySold comps — $/sqft
last 12 mo · ≤1 miLoading sold comps…