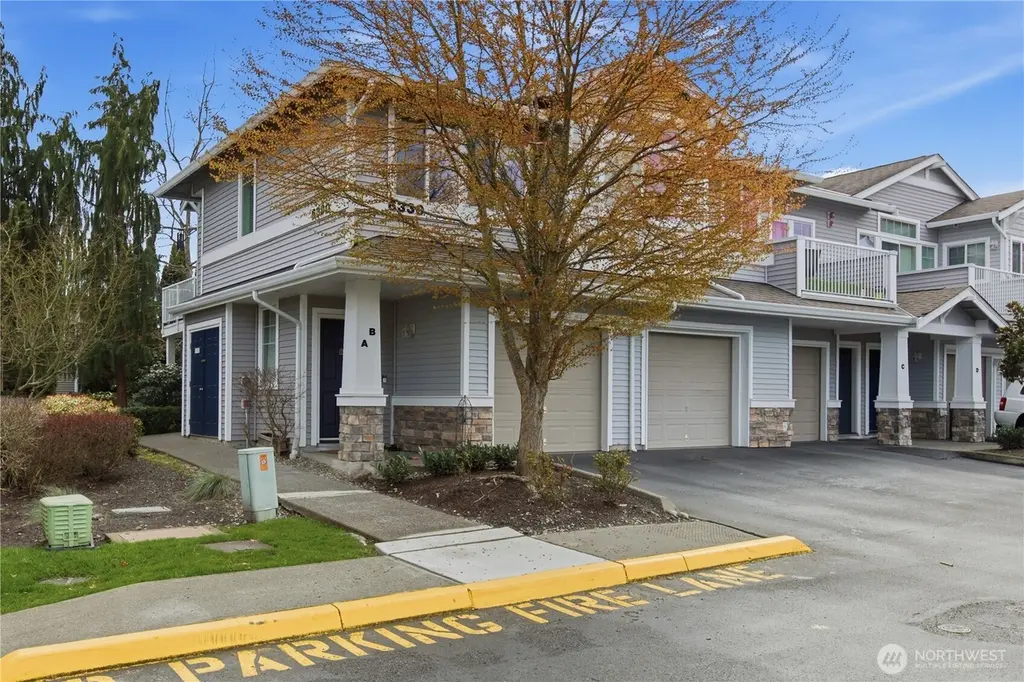
6330 Isaac Ave SE Unit A-24 · Auburn, WA
Flood risk 1/10 · Minimal
- FEMA flood zone
- X (unshaded)
- Chance of flooding over 30 yrs
- 0.0%
- Est. flood insurance / yr
- $507 – $1,088
Fire risk 1/10 · Minimal
- Est. fire insurance / yr
- $604 – $1,122
Heat risk 3/10 · Minor
- Hot days now (above 87°F)
- 7 days/yr
- Hot days in 30 yrs
- 15 days/yr
Wind risk 1/10 · Minimal
- Chance of severe wind over 30 yrs
- —
Air-quality risk 7/10 · Major
- Unhealthy air days now
- 10 days/yr
- Unhealthy air days in 30 yrs
- 11 days/yr
Risk factors via First Street. Map © Google.
Why this score? — see what drove the D grade
The composite is a weighted blend of 9 inputs, each scored 0–100. Each bar is that input's sub-score; the figure is the points it added to the 100-point composite (weight × sub-score).
- Appreciation +10.0/10.0
- ARV discount +7.5/15.0
- Cash flow +6.0/30.0
- Schools +4.7/10.0
- Livability +4.0/5.0
- 1% rule +2.6/10.0
- Condition / age +2.5/5.0
- Rent growth +2.4/5.0
- DSCR +0.4/10.0
$359,000
🖨 Deal sheet 📄 Offer letter ✓ Due diligence
Listing remarks
Experience low-maintenance living in this beautifully appointed single-level ground-floor condo in Lakeland's Carrara Community. Offering 2 spacious bedrooms and 2 well-appointed bathrooms, the residence showcases an open-concept layout that balances comfort with effortless entertaining. Refined luxury vinyl plank flooring runs throughout the living and primary bedroom, lending both durability and a clean, contemporary aesthetic. A generously sized garage provides abundant space for parking, storage, or hobbies—an exceptional and highly desirable feature. Step onto your private patio, a serene and secluded retreat offering a rare sense of privacy—perfect for quiet mornings or re
Key facts
- Private patio
- Open-concept layout
- $485 HOA
Tags
Property features AI
Finance
- Other: Bus route nearby (route 497)
- Financial info: Acceptable financing: Cash, Conventional, FHA, VA
- HOA & community: HOA fee $485 monthly; HOA covers common area maintenance, earthquake insurance, lawn service, road maintenance, sewer and water; Around the Clock association contact; 25 units in community; 6 units in building
Exterior
- Parking: Individual garage (covered); Off-street parking; 1 uncovered parking space
- Utilities: Electric energy source; Water service through HOA; Sewer service through HOA; Power provided by PSE
- Home design: Attached condominium; One-level unit (entry on main level); North-facing
- Construction: Built in 2005 (effective year); Metal/vinyl construction; Composition roof; Multi-family structure; 2 stories in building
- Exterior features: Corner lot; Paved; Sidewalk; Balcony/Deck/Patio; End unit; Ground floor; Insulated windows; Unit has a view
Interior
- Kitchen: Dishwasher; Microwave; Refrigerator; Stove/Range
- Bedrooms: 2 bedrooms (both on the main level); Primary bedroom (main level)
- Flooring: Vinyl; Vinyl plank; Carpet
- Bathrooms: 2 full bathrooms (both on the main level); 2 bathtubs; 2 showers
- Heating & cooling: Baseboard heating; No cooling
- Interior features: Electric cooking; Electric dryer hookup; Washer hookup; Fireplace (electric); Walk-in closet(s); Water heater
- Laundry & utility: Washer included; Dryer included; Washer hookup; Electric dryer hookup; Water heater located in bedroom closet (electric)
Neighborhood map
What this means for you Summary
Snapshot
- This is a 2-bed/2.0-bath condo listed at $359k.
Deal economics
- At list price, monthly cash flow is $-686 ($-8k/yr) — negative.
- To cash-flow at today's rent, offer at most $238k (33.8% below list).
- To meet the 1% rule (rent ≥ 1% of price), the offer needs to be $274k (23.7% below list).
- Recommended offer: $238k (33.8% below list) — sets the bar for cash-flow.
- Cap rate 4.0% vs local median 2.7% in Auburn — top-decile yield for the area; either an underpriced asset or a hidden risk that comps aren't pricing in. Stress-test before assuming the spread holds.
Location & tenants
- Location reads 81/100 on livability (#75 in WA, #1,371 nationally) — a professional / high-income tenant draw. Strengths: amenities A+, commute A+, employment A+; Watch: crime F, cost of living F.
- Auburn School District (urban): math 47% / reading 56% proficiency, ranked #125 of 291 in WA (top 43%) — acceptable for families but not a draw, mixed tenant base, ~2y average lease.
- Zoned schools: Lakeland Hills Elementary (536 students, 35% FRL); Auburn Riverside High School (1,909 students, 50% FRL) — zoned schools at 42% FRL track the district average.
- Market conditions: Rents soft (-0.5%/yr); 291 active listings in the ZIP; 8 comparable units currently listed for rent nearby; rentals leasing fast (median 2d on market — plan ~1-2 weeks tenant-placement turnaround); high-income renter base; 3,209 units permitted in Pierce County in 2024 (1,269 in 5+ unit buildings).
Forward outlook
- In year one you build about $38k of equity ($2k loan paydown + $36k appreciation (10.0% local appreciation)).
- Pierce County population projected at +26% by 2050 — long-run rental-demand tailwind backs the buy-and-hold thesis.
- By year 2, paydown + projected appreciation supports a ~$62k cash-out refi (75% LTV) — recoverable capital for the next deal without selling this one.
Negotiation context
- It's been on market 46 days — a 3% lower offer ($348k) is reasonable based on typical stale-listing flexibility.
- 5 sale attempts since 5y ago with the ask held roughly flat each time — persistent listings suggest the price (not the market) is what's stuck; bring a comps-based counter.
Questions for the listing agent
- What do current leases actually rent for vs. the listed asking? Can we see a recent rent roll and the last 12 months of T-12 income?
- It's been on market 46 days. Have you received any prior offers? Is the seller open to a 34% concession, seller financing, or rate buy-down credit?
- What does the HOA fee cover, when was the last increase, and are there any pending special assessments or reserve-fund shortfalls?
- Any open or pending special assessments — roof, HVAC, plumbing, elevator, façade? What's the per-unit balance and payoff schedule, and is the seller paying it off at close or rolling it to the buyer?
- Is there a deadline driving the sale (1031 exchange, divorce, estate, relocation)? That informs how much negotiation room exists.
- Crime grade is F in this area — have there been break-ins, vandalism, or insurance claims at this property in the last 3 years? What carrier currently insures it and at what premium?
- The area grade is low — what's the realistic commute time and amenity access for the typical tenant pool here? Any planned neighborhood developments (good or bad) we should know about?
- What's the average days-on-market for RENTAL listings here right now (not sales)? A rising rental-DOM trend means longer vacancies and softer asking-rent achievability than the comps imply.
- What's the recent tenant-quality profile in this submarket — average credit score on applications, eviction rate, late-payment / NSF rate, and stable-employment percentage? A property-management company in the area should have these aggregated.
- How much new apartment / multifamily construction is in the pipeline within 1–3 miles? Heavy new supply (>2% of stock underway) typically softens rents 12–24 months out; light construction supports rent growth.
Investment metrics
- 1% rule
- 0.76% ✗
- Cap rate
- 4.00%
- Cash-on-cash
- -8.19%
- DSCR
- 0.64
- GRM
- 10.9
CMA / ARV
No comps found within radius.
Projected returns pro-forma
10.0% appreciation · 0.0% rent growth · sell at horizon
- IRR
- 17.7%
- Equity multiple
- 2.43×
- Total profit
- $144,060
- Equity at exit
- $323,416
- IRR
- 16.0%
- Equity multiple
- 5.42×
- Total profit
- $444,749
- Equity at exit
- $697,458
Cash invested: $100,520 (down + closing). Projections, not guarantees.
Landlord ↔ Tenant lean methodology
- Overall (STATE)
- 28 Tenant-Leaning
- State Washington
- 28 Tenant-Leaning · D+8
- County
- — inherits STATE
- City
- — inherits STATE
ZIP-level market 98092
- Home prices YoY
- 3.3%
- Rents YoY
- -0.5%
- Active inventory
- 291
- Price-to-rent
- 10.9×
Monthly cashflow live
- Estimated rent
- $2,741 high interval (Pro) →
- Mortgage (P&I)
- −$1,883
- Tax from tax record
- −$334 /mo · $4,010/yr
- Insurance
- −$150
- HOA
- −$485
- Vacancy / Maint / Mgmt
- −$576
- Net cashflow
- $-686
Break-even live
UW: 25.0% down · 7.5% · 30yr · 1.5% tax · 5.0% vac · 8.0% maint · 8.0% mgmt
Financing live
Cash to close
- Down payment
- $89,750
- Closing costs
- $10,770
- Reserves months
- —
- Total cash needed
- —
Loan-product check · same deal, 3 products live
Conventional
25% down · 7.5% · 30yr
- Down + closing
- —
- Monthly P&I
- —
- Monthly cashflow
- —
- DSCR
- —
- Eligible?
- —
Personal DTI + credit; lowest rate.
DSCR
20% down · 8.5% · 30yr
- Down + closing
- —
- Monthly P&I
- —
- Monthly cashflow
- —
- DSCR
- —
- Eligible?
- —
No personal income docs; deal must DSCR.
Hard money
10% down · 12.0% · 12mo
- Down + closing
- —
- Monthly P&I
- —
- Monthly cashflow
- —
- DSCR
- —
- Eligible?
- —
Short-term bridge; refi at stabilization.
Rent comps 8 comps
| Address | Beds | Baths | Sqft | Rent | $/sqft | DOM | Units | Dist |
|---|---|---|---|---|---|---|---|---|
| 1105 63rd St SE Unit C Auburn, WA | 3.0 | 2.5 | 1372 | $4,000 | $2.92 | 1d | 1 | 0.06mi |
| 1115 62nd St SE Unit 18B Auburn, WA | 2.0 | 1.5 | 1285 | $2,695 | $2.10 | 1d | 1 | 0.10mi |
| 7101 Lindsay Ave SE Auburn, WA | 1.0–2.0 | 1.0–1.5 | 853 | $2,069 | $2.42 | 1d | 20 | 0.54mi |
| 6821 Udall Pl SE Auburn, WA | 1.0–3.0 | 1.0–2.0 | 923 | $2,260 | $2.45 | 1d | 27 | 0.75mi |
| 2705 67th Ct SE Auburn, WA | 3.0 | 3.0 | 1458 | $2,995 | $2.05 | 10d | 1 | 1.03mi |
| 703 47th St SE Auburn, WA | 2.0 | 1.0–2.0 | 781 | $1,970 | $2.52 | 1d | 7 | 1.08mi |
| 4704 Mill Pond Dr SE #213 Auburn, WA | 2.0 | 2.0 | 1142 | $2,750 | $2.41 | 2d | 1 | 1.18mi |
| 508 4th Ave SE Pacific, WA | 2.0 | 1.0 | 885 | $2,100 | $2.37 | 24d | 1 | 1.35mi |
HOA detail condo
- Monthly dues
- $485 · $5,820/yr
- Assessments
- None detected in remarks — confirm with the listing agent.
Listing history 14 events
-
2026-05-12status Pending
-
2026-05-12status Pending
-
2026-04-17price $359,000
-
2026-04-17price $359,000
-
2026-03-27$369,900 Active
-
2026-03-27$369,900 Active
-
2022-01-27soldstatus $378,500 Closed
-
2021-12-24status Pending
-
2021-12-24status Pending
-
2021-12-17price $375,000
-
2021-12-17status Active
-
2021-11-23status Pending
-
2021-11-19$380,000 Active
-
2021-11-19Active
ⓘ Source: listings_history table (triggers on properties + properties_extension) + one-shot
backfill from property_details.listing_events for pre-trigger history.
Tax reassessment forecast WA · Resets to sale price
- Current annual tax
- $4,010 · $334/mo
- Projected year-2 tax
- $4,010 · $334/mo
- Expected delta
- $0/yr ($0/mo · -0.0%)
ⓘ Screening estimate from a state-policy table — verify with the county assessor before closing.
Climate risk First Street
- Flood 1/10 Low FEMA zone X (unshaded) · 0% chance over 30 yrs
- Wildfire 1/10 Low
- Heat 3/10 Moderate 7 d/yr ≥87°F today · 15 d/yr by 30 yrs out
- Wind 1/10 Low
- Air quality 7/10 Severe 10 unhealthy d/yr today · 11 by 30 yrs out
Nearby sold comps map
Loading sold comps map…
Walkable amenities ~0.75 mi
Loading nearby amenities…
Taxation est. · year 1
- Rental income
- $32,890
- − Mortgage interest
- −$20,110
- − Property taxes
- −$4,010
- − Insurance
- −$1,795
- − Repairs & maintenance
- −$2,631
- − Management
- −$2,631
- − HOA
- −$5,820
- − Depreciation
- −$10,444
- Taxable loss
- −$14,550
- Est. tax savings @ 24.0%
- +$3,492
- After-tax cash flow
- $-4,741/yr
For passive investors: Depreciation is non-cash, so a rental often shows a tax loss while cash-flowing — sheltering income. Rental losses are passive: they offset passive income freely, and up to $25,000/yr can offset ordinary (W-2) income if you actively participate and your MAGI is under $100k (phasing out to $0 by $150k); unused losses carry forward. On sale, claimed depreciation is recaptured at up to 25%, and gains may owe capital-gains tax (a 1031 exchange can defer both). Figures are a year-1 estimate at your 24.0% rate — not tax advice; consult a CPA.
Schools (NCES district)
- District
- Auburn School District
- NCES district ID
- 5300300
- Math proficiency
- 47% ▼ -3.00%
- Reading proficiency
- 56% ▼ -1.00%
- Median HH income
- $58,048
- Composite
- 46.73/100
- National rank
- #5240
- State rank
- #125 of 291 in WA
Livability — Auburn
- Score
- 81/100
- State rank
- #75
- US rank
- #1371
Category grades
Schools grade is shown separately in the Schools card above.
Census & demographics
- Census place
- Auburn, WA
- County
- King County · 2,251,916 people
- City population
- 74,969
- Metro
- Seattle-Tacoma-Bellevue, WA
- Population (ZIP)
- 50,224
- Household income
- $122,300
- Rent vs Own
- Severe rent burden
- 1041.0
Population outlook (Pierce County) Hauer SSP2
- Today (2025)
- 956,648 people
- By 2030
- 1,010,862 · +5.7%
- By 2040
- 1,113,170 · +16.4%
- By 2050
- 1,206,524 · +26.1%
- By 2075
- 1,436,425 · +50.2%
- By 2100
- 1,563,654 · +63.5%
Race, ethnicity, and origin ACS 2023
- Neighborhood character
- Diverse neighborhood (Simpson 0.66)
- Race & ethnicity
- White 54% Hispanic / Latino 15% Asian 14% Two or more races 13% Native American 4% Black 3% Pacific Islander 2%
- Hispanic origin (detail)
- Mexican 12%
- Common ancestry
- Portuguese 4% Italian 3% Subsaharan African 3%
- Foreign-born
- 20% · Canada, South Korea, Vietnam
- Languages at home
- 73% English-only · Spanish 9% Russian/Polish/Slavic 4% Other Indo-European 3%
Political lean MEDSL · Pierce
- 2024 margin
- D (+10.8) · D 53.9% · R 43.1% · Other 3.0%
- 2008→2024 swing
- -1.4pp toward R · 2008: 12.2pp · 2024: 10.8pp
- All cycles
- 2024: D+10.8 2020: D+11.2 2016: D+7.5 2012: D+11.0 2008: D+12.2
Not yet ingested
- Civics
- —
Market trends
- HPI YoY
- ▲ 49.75%
- Current HPI
- 1554.06
- Rent YoY
- ▼ -0.46%
- Metro
- Seattle-Tacoma-Bellevue, WA
- State GDP YoY
- ▲ 4.65%
- F500 in state
- 22
Industry mix (Fortune 500 HQ in WA)
| Industry | F500 HQs | Revenue |
|---|---|---|
| Retail | 2 | $269B |
|
||
| Technology / Retail | 1 | $638B |
|
||
| Technology | 1 | $245B |
|
||
| Telecommunications | 1 | $38B |
|
||
| Food / Beverage | 1 | $36B |
|
||
| Automotive / Trucks | 1 | $34B |
|
||
Price history
-5.5% since first listed14 events — show timeline
- 2026-05-12 Pending — NWMLS as Distributed by MLS Grid
- 2026-05-12 Pending — NWMLS as Distributed by MLS Grid
- 2026-04-17 Price Changed $359,000 NWMLS as Distributed by MLS Grid
- 2026-04-17 Price Changed $359,000 NWMLS as Distributed by MLS Grid
- 2026-03-27 Listed $369,900 NWMLS as Distributed by MLS Grid
- 2026-03-27 Listed $369,900 NWMLS as Distributed by MLS Grid
- 2022-01-27 Sold (MLS) $378,500 NWMLS as Distributed by MLS Grid
- 2021-12-24 Pending — NWMLS as Distributed by MLS Grid
- 2021-12-24 Pending — NWMLS as Distributed by MLS Grid
- 2021-12-17 Price Changed $375,000 NWMLS as Distributed by MLS Grid
- 2021-12-17 Relisted — NWMLS as Distributed by MLS Grid
- 2021-11-23 Pending — NWMLS as Distributed by MLS Grid
- 2021-11-19 Listed — NWMLS as Distributed by MLS Grid
- 2021-11-19 Listed $380,000 NWMLS as Distributed by MLS Grid
Property tax history
+3.6%/yrLatest (2026): $4,010 · +1.7% YoY. Source: county tax records.
Cash-flow waterfall
monthlySold comps — $/sqft
last 12 mo · ≤1 miLoading sold comps…