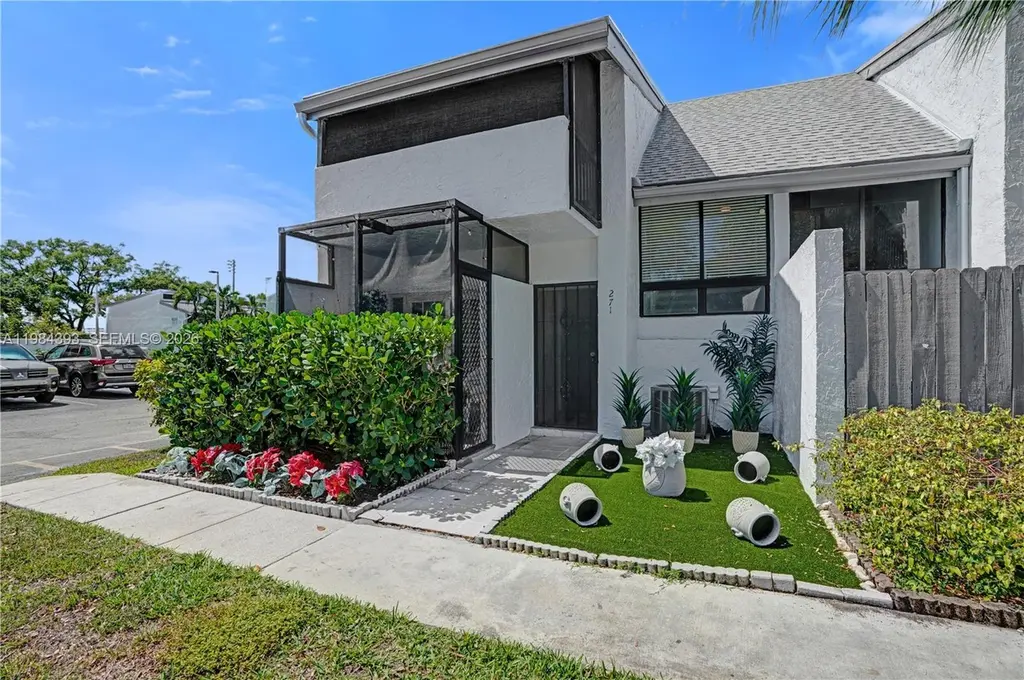
19220 NE 25th Ave Unit 271B · Ojus, FL
Flood risk 7/10 · Major
- FEMA flood zone
- AE
- Chance of flooding over 30 yrs
- 0.73%
- Est. flood insurance / yr
- $1,737 – $8,500
Fire risk 1/10 · Minimal
- Est. fire insurance / yr
- $947 – $1,759
Heat risk 10/10 · Severe
- Hot days now (above 104°F)
- 7 days/yr
- Hot days in 30 yrs
- 28 days/yr
Wind risk 10/10 · Severe
- Chance of severe wind over 30 yrs
- 99.0%
Air-quality risk 2/10 · Minimal
- Unhealthy air days now
- 2 days/yr
- Unhealthy air days in 30 yrs
- 2 days/yr
Risk factors via First Street. Map © Google.
Why this score? — see what drove the C- grade
The composite is a weighted blend of 9 inputs, each scored 0–100. Each bar is that input's sub-score; the figure is the points it added to the 100-point composite (weight × sub-score).
- Cash flow +16.7/30.0
- ARV discount +12.3/15.0
- 1% rule +7.3/10.0
- DSCR +5.2/10.0
- Schools +4.2/10.0
- Livability +4.2/5.0
- Condition / age +2.5/5.0
- Rent growth +2.1/5.0
- Appreciation +0.0/10.0
$415,000
🖨 Deal sheet (PDF) 📄 Offer letter ✓ Due diligence
Listing remarks
Improved price!! Immaculate two-story townhouse in a sought-after gated community, move-in ready! Corner unit featuring three bedrooms, two and a half baths, new floors throughout, new stainless steel refrigerator, remodeled primary bath. The spacious layout offers comfortable living, enjoy and relax in the screened -covered terrace, perfect for entertainment, private balcony or charming front porch (all screened -in ). Freshly painted inside and outside. Located in a desirable community with an assigned parking conveniently located directly in front of the unit. Community with pool, clubhouse, sauna, playground, and basketball court. Walking distance to elementary school. Association fee i
Key facts
- Charming front porch
- Community with pool
- Clubhouse
Tags
Property features AI
Finance
- Financial info: Pets allowed with restrictions
- HOA & community: Monthly association fee; Association fee covers management, common areas, cable TV, insurance, structural maintenance, parking, recreation facilities, reserve fund, roof, sewer, security, trash, and water; Community clubhouse
Exterior
- Parking: One parking space
- Security: Phone entry; Security guard
- Utilities: Central electric heating and cooling
- Home design: Attached property; 2 stories; Entry on level 1
- Construction: Block construction; Year built: unknown
- Exterior features: Balcony; Screened balcony; Fenced complex
Interior
- Kitchen: Electric range; Microwave; Dishwasher; Refrigerator; Trash compactor
- Bedrooms: Primary bedroom on upper level
- Flooring: Hardwood; Wood
- Bathrooms: 2 full bathrooms; 1 half bathroom
- Heating & cooling: Central heating (electric); Central air conditioning; Ceiling fans
- Interior features: Breakfast area; Entrance foyer; Living/dining room; Split bedroom layout; Upper-level primary bedroom; Vaulted ceilings
- Laundry & utility: Washer; Dryer
Neighborhood map
What this means for you Summary
Snapshot
- This is a 3-bed/2.0-bath townhouse listed at $415k.
Deal economics
- At list price, monthly cash flow is $-169 ($-2k/yr) — negative.
- To cash-flow at today's rent, offer at most $391k (5.9% below list).
- Meets the 1% rule at list price ($5k rent vs $415k).
- Recommended offer: $378k (9.0% below list) — sets the bar for market timing.
Location & tenants
- Location reads 83/100 on livability (#58 in FL, #1,031 nationally) — a professional / high-income tenant draw. Strengths: commute A+, housing A+, health & safety A+; Watch: amenities F.
- Miami-Dade (suburban): math 45% / reading 54% proficiency, ranked #40 of 73 in FL (top 55%) — families likely to look elsewhere, expect single-tenant / working-renter base with shorter leases; 64% free/reduced lunch — lower-income household profile, screen leases tightly.
- Zoned schools: Virginia A Boone-Highland Oaks School (math 50% / reading 60%, grade C, #872 of 2,144 statewide, top 42%, 600 students, 40% FRL); Highland Oaks Middle School (math 28% / reading 51%, grade F, #373 of 571 statewide, top 66%, 774 students, 50% FRL); Dr. Michael M. Krop Senior High (math 21% / reading 46%, grade F, #400 of 667 statewide, top 61%, 2,235 students, 49% FRL) — zoned schools average 47% FRL vs 64% district-wide (17 pts lower); this property's tenant base skews higher-income than the district average.
- Market conditions: Rents soft (-1.5%/yr); 993 active listings in the ZIP; 1 comparable units currently listed for rent nearby; solid renter incomes; 10,051 units permitted in Miami-Dade County in 2024 (7,758 in 5+ unit buildings).
- At $5,093/mo this rent would consume 67% of the median local household income ($91k/yr) (locally 1838% of renters already pay >50% of income on rent) — very limited rent-growth headroom before tenants either downsize or default.
Forward outlook
- Local home prices are declining (-3.0%/yr); year-one equity from $3k of loan paydown is wiped out by about $12k of value loss. Plan a longer hold.
- Miami-Dade County population projected at +28% by 2050 — long-run rental-demand tailwind backs the buy-and-hold thesis.
Negotiation context
- It's been on market 93 days — a 9% lower offer ($378k) is reasonable based on typical stale-listing flexibility.
- Current owner paid $70k; list at $415k implies a 493% gain — meaningful room to come down on a strong offer.
Risks & watch-outs
- Watch-outs: flood insurance adds $427/mo.
- Climate carrying-cost: in FEMA flood zone AE (mandatory federal flood insurance); severe wind risk, 99% chance of damaging wind over 30y; extreme-heat days projected 7→28/yr by 2055 (HVAC capex compounding) — expect insurance premiums to compound above CPI over the hold.
Questions for the listing agent
- What do current leases actually rent for vs. the listed asking? Can we see a recent rent roll and the last 12 months of T-12 income?
- It's been on market 93 days. Have you received any prior offers? Is the seller open to a 9% concession, seller financing, or rate buy-down credit?
- Built in 1974 — when were the roof, HVAC, electrical panel, plumbing, and water heater last replaced?
- What's the actual annual flood-insurance premium (NFIP or private), and is the property in a SFHA with mandatory coverage?
- What does the HOA fee cover, when was the last increase, and are there any pending special assessments or reserve-fund shortfalls?
- Why hasn't it sold? Are there any deal-killer items the seller is aware of (foundation, flood, title, zoning, code violations)?
- Is there a deadline driving the sale (1031 exchange, divorce, estate, relocation)? That informs how much negotiation room exists.
- Schools are D-rated, which usually means shorter tenancies and higher turnover. Who's the typical renter profile here, and what's been the actual vacancy rate?
- What's the average days-on-market for RENTAL listings here right now (not sales)? A rising rental-DOM trend means longer vacancies and softer asking-rent achievability than the comps imply.
- What's the recent tenant-quality profile in this submarket — average credit score on applications, eviction rate, late-payment / NSF rate, and stable-employment percentage? A property-management company in the area should have these aggregated.
- How much new for-sale + rental construction is in the pipeline within 1–3 miles? Heavy new supply typically softens prices + rents 12–24 months out; constrained supply supports both.
Investment metrics
- 1% rule
- 1.23% ✓
- Cap rate
- 7.04%
- Cash-on-cash
- 2.66%
- DSCR
- 1.12
- GRM
- 6.8
CMA / ARV
- ARV (on-the-fly)
- $464,200
- Comps found
- 1
Show comp detail 1 sale within ~0.75 mi
| Address | Dist | Beds/Ba | Sqft | Sold | Price | $/sf | Match |
|---|---|---|---|---|---|---|---|
| 19408 NE 26th Ave Unit 154C | 0.10mi | 3/2.0 | 1,579 (-6%) | 18mo | $435,000 | $275 | 69 |
Match score weights: distance 35% · size 25% · config 20% · recency 20%. Top-matched comps best support the ARV.
Projected returns pro-forma
-3.0% appreciation · 0.0% rent growth · sell at horizon
- IRR
- -24.1%
- Equity multiple
- 0.21×
- Total profit
- $-92,036
- Equity at exit
- $61,878
- IRR
- -41.5%
- Equity multiple
- -0.27×
- Total profit
- $-148,055
- Equity at exit
- $35,882
Cash invested: $116,200 (down + closing). Projections, not guarantees.
Landlord ↔ Tenant lean methodology
- Overall (STATE)
- 87 Strongly Landlord-Friendly
- State Florida
- 87 Strongly Landlord-Friendly · R+3
- County
- — inherits STATE
- City
- — inherits STATE
ZIP-level market 33180
- Rents YoY
- -1.5%
- Active inventory
- 993
- Price-to-rent
- 6.8×
Monthly cashflow live
- Estimated rent
- $5,093 medium interval (Pro) →
- Mortgage (P&I)
- −$2,176
- Tax est. 1.5%
- −$519 /mo · $6,225/yr
- Insurance
- −$173
- Flood insurance flood zone
- −$427 /mo · $5,118/yr
- HOA
- −$898
- Vacancy / Maint / Mgmt
- −$1,070
- Net cashflow
- $-169
Break-even live
Sensitivity live
| Price | -10% $118 | -5% $-25 | +0% $-169 | +5% $-312 | +10% $-456 |
|---|---|---|---|---|---|
| Rent | -10% $-571 | -5% $-370 | +0% $-169 | +5% $32 | +10% $234 |
| Rate | -1.0pp $40 | -0.5pp $-63 | base $-169 | +0.5pp $-276 | +1.0pp $-386 |
UW: 25.0% down · 7.5% · 30yr · 1.5% tax · 5.0% vac · 8.0% maint · 8.0% mgmt
Financing live
Cash to close
- Down payment
- $103,750
- Closing costs
- $12,450
- Reserves months
- —
- Total cash needed
- —
Loan-product check · same deal, 3 products live
Conventional
25% down · 7.5% · 30yr
- Down + closing
- —
- Monthly P&I
- —
- Monthly cashflow
- —
- DSCR
- —
- Eligible?
- —
Personal DTI + credit; lowest rate.
DSCR
20% down · 8.5% · 30yr
- Down + closing
- —
- Monthly P&I
- —
- Monthly cashflow
- —
- DSCR
- —
- Eligible?
- —
No personal income docs; deal must DSCR.
Hard money
10% down · 12.0% · 12mo
- Down + closing
- —
- Monthly P&I
- —
- Monthly cashflow
- —
- DSCR
- —
- Eligible?
- —
Short-term bridge; refi at stabilization.
Rent comps 1 comps
| Address | Beds | Baths | Sqft | Rent | $/sqft | DOM | Units | Dist |
|---|---|---|---|---|---|---|---|---|
| 223 SW 10th St Hallandale Beach, FL | 3.0 | 3.0 | 1289 | $3,900 | $3.03 | 26d | 1 | 1.43mi |
HOA detail
- Monthly dues
- $898 · $10,776/yr
- Likely covers
- poolsecurityparking
Listing history 18 events
-
2026-06-18status $415,000 Pending 93 DOM
-
2026-06-18days on market $415,000 Active 93 DOM
-
2026-06-17days on market $415,000 Active 92 DOM
-
2026-06-16days on market $415,000 Active 91 DOM
-
2026-06-15days on market $415,000 Active 90 DOM
-
2026-06-13days on market $415,000 Active 88 DOM
-
2026-06-09days on market $415,000 Active 84 DOM
-
2026-06-08days on market $415,000 Active 83 DOM
-
2026-06-07days on market $415,000 Active 82 DOM
-
2026-06-04days on market $415,000 Active 79 DOM
-
2026-06-03days on market $415,000 Active 78 DOM
-
2026-06-02days on market $415,000 Active 77 DOM
-
2026-06-01days on market $415,000 Active 76 DOM
-
2026-05-31days on market $415,000 Active 75 DOM
-
2026-05-19price $415,000
-
2026-04-13price $427,025
-
2026-03-15$450,000 Active
-
1985-10-01soldstatus $70,000
ⓘ Source: listings_history table (triggers on properties + properties_extension) + one-shot
backfill from property_details.listing_events for pre-trigger history.
Climate risk First Street
- Flood 7/10 Severe FEMA zone AE · 73% chance over 30 yrs
- Wildfire 1/10 Low
- Heat 10/10 Extreme 7 d/yr ≥104°F today · 28 d/yr by 30 yrs out
- Wind 10/10 Extreme 99% chance of damaging wind over 30 yrs
- Air quality 2/10 Low 2 unhealthy d/yr today · 2 by 30 yrs out
Nearby sold comps map
Loading sold comps map…
Walkable amenities ~0.75 mi
Loading nearby amenities…
Taxation est. · year 1
- Rental income
- $61,119
- − Mortgage interest
- −$23,246
- − Property taxes
- −$6,225
- − Insurance
- −$7,194
- − Repairs & maintenance
- −$4,890
- − Management
- −$4,890
- − HOA
- −$10,776
- − Depreciation
- −$12,073
- Taxable loss
- −$8,174
- Est. tax savings @ 24.0%
- +$1,962
- After-tax cash flow
- $-64/yr
For passive investors: Depreciation is non-cash, so a rental often shows a tax loss while cash-flowing — sheltering income. Rental losses are passive: they offset passive income freely, and up to $25,000/yr can offset ordinary (W-2) income if you actively participate and your MAGI is under $100k (phasing out to $0 by $150k); unused losses carry forward. On sale, claimed depreciation is recaptured at up to 25%, and gains may owe capital-gains tax (a 1031 exchange can defer both). Figures are a year-1 estimate at your 24.0% rate — not tax advice; consult a CPA.
Schools (NCES district)
- District
- Miami-Dade
- NCES district ID
- 1200390
- Math proficiency
- 45% ▼ -16.00%
- Reading proficiency
- 54% ▼ -5.00%
- Median HH income
- $43,928
- Composite
- 41.76/100
- National rank
- #3397
- State rank
- #40 of 73 in FL
Livability — Ojus
- Score
- 83/100
- State rank
- #58
- US rank
- #1031
Category grades
Schools grade is shown separately in the Schools card above.
Census & demographics
- Census place
- Ojus, FL
- County
- Miami-Dade County · 2,697,751 people
- Metro
- Miami-Fort Lauderdale-Pompano Beach, FL
- Population (ZIP)
- 34,147
- Household income
- $91,055
- Rent vs Own
- Severe rent burden
- 1838.0
Population outlook (Miami-Dade County) Hauer SSP2
- Today (2025)
- 3,126,439 people
- By 2030
- 3,325,765 · +6.4%
- By 2040
- 3,697,561 · +18.3%
- By 2050
- 4,012,134 · +28.3%
- By 2075
- 4,605,612 · +47.3%
- By 2100
- 4,866,598 · +55.7%
Race, ethnicity, and origin ACS 2023
- Neighborhood character
- Diverse neighborhood (Simpson 0.59)
- Race & ethnicity
- White 46% Hispanic / Latino 45% Two or more races 28% Black 2% Asian 2%
- Hispanic origin (detail)
- Mexican 2% Puerto Rican 2% Cuban 7% Dominican 1% Salvadoran 6%
- Common ancestry
- Scotch-Irish 5% Romanian 5% Italian 3%
- Foreign-born
- 52% · Canada, Jamaica, Dominican Republic
- Languages at home
- 30% English-only · Spanish 49% Other Indo-European 6% Russian/Polish/Slavic 4%
Political lean MEDSL · Miami-Dade
- 2024 margin
- R (+11.4) · D 43.9% · R 55.4%
- 2008→2024 swing
- -27.6pp toward R · 2008: 16.1pp · 2024: -11.4pp
- All cycles
- 2024: R+11.4 2020: D+7.3 2016: D+29.6 2012: D+23.7 2008: D+16.1
Not yet ingested
- Civics
- —
Market trends
- HPI YoY
- ▼ -343.81%
- Current HPI
- 234.7715
- Rent YoY
- ▼ -1.51%
- Metro
- Miami-Fort Lauderdale-Pompano Beach, FL
- State GDP YoY
- ▲ 3.28%
- F500 in state
- 36
Industry mix (Fortune 500 HQ in FL)
| Industry | F500 HQs | Revenue |
|---|---|---|
| Industrial Technology | 2 | $29B |
|
||
| Insurance | 2 | $17B |
|
||
| Retail | 1 | $60B |
|
||
| Technology Distribution | 1 | $58B |
|
||
| Homebuilding | 1 | $35B |
|
||
| Technology Manufacturing | 1 | $35B |
|
||
Price history
+492.9% since first listed4 events — show timeline
- 2026-05-19 Price Changed $415,000 MARMLS
- 2026-04-13 Price Changed $427,025 MARMLS
- 2026-03-15 Listed $450,000 MARMLS
- 1985-10-01 Sold (Public Records) $70,000 Public Records
Property tax history
+0.5%/yrLatest (2025): $734 · +4.7% YoY. Source: county tax records.
Cash-flow waterfall
monthlySold comps — $/sqft
last 12 mo · ≤1 miLoading sold comps…