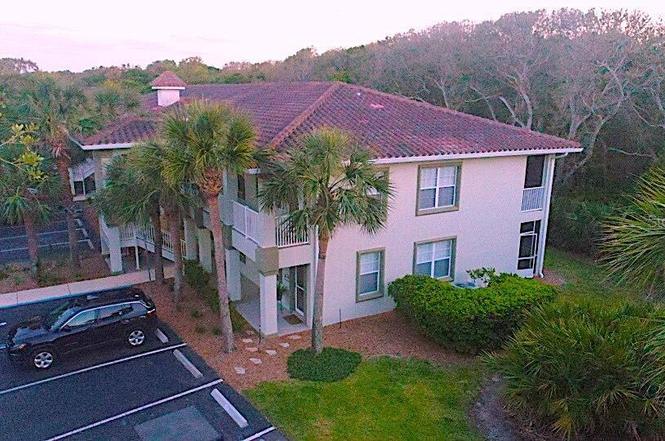
90 San Juan Dr Unit B204 · Marineland, FL
Flood risk 8/10 · Major
- FEMA flood zone
- X (shaded)
- Chance of flooding over 30 yrs
- 0.97%
- Est. flood insurance / yr
- $507 – $1,088
Fire risk 2/10 · Minimal
- Est. fire insurance / yr
- $947 – $1,759
Heat risk 9/10 · Severe
- Hot days now (above 105°F)
- 7 days/yr
- Hot days in 30 yrs
- 20 days/yr
Wind risk 10/10 · Severe
- Chance of severe wind over 30 yrs
- 99.0%
Air-quality risk 2/10 · Minimal
- Unhealthy air days now
- 2 days/yr
- Unhealthy air days in 30 yrs
- 2 days/yr
Risk factors via First Street. Map © Google.
Why this score? — see what drove the D grade
The composite is a weighted blend of 9 inputs, each scored 0–100. Each bar is that input's sub-score; the figure is the points it added to the 100-point composite (weight × sub-score).
- Cash flow +11.7/30.0
- ARV discount +7.5/15.0
- 1% rule +5.8/10.0
- Schools +4.6/10.0
- DSCR +3.5/10.0
- Rent growth +2.7/5.0
- Livability +2.6/5.0
- Condition / age +2.5/5.0
- Appreciation +0.0/10.0
$274,900
🖨 Deal sheet (PDF) 📄 Offer letter ✓ Due diligence
Listing remarks MLS
Wow! TURN-KEY. .. .. .. TOP FLOOR, Open, Airy, Spacious three bedroom, two bath CORNER unit! Absolutely the BEST PRICED, WITH incredible amenities surrounded by ocean front and intracoastal access! Located in our beautiful Matanzas Shores, this condo is loaded with many comfortable amenities, textured laced "Volume Ceilings", like new laminate counter tops in kitchen and cultured marble tops in bathrooms, white raised panel cabinetry, ceramic tile in kitchen, entry and bathrooms, like new carpet in living and bedrooms, hardly used Appliances, side by side washer/dryer, and all with lots of nice open space to entertain on your screened 22' wide patio balcony with access to Master bedroom and 8' x 14' sliding glass wall of window from the living room. Matanzas Shores=True Florida Living! Access to Ocean Front Beach! Swimming pools, Tennis courts, Spa, intracoastal boat dock/best fishing, and spacious clubhouse, and miles of walking /biking trails in this "sought after" area!
Key facts
- Master suite
- Walk-in closet
- Spacious kitchen
Tags
Property features AI
Finance
- Other: Unfurnished unit
- Financial info: Total monthly fees $600; total annual fees $7,200; Lease restrictions apply
- HOA & community: Monthly association fee $600; Association required and approval required; Association manages common areas and cable TV included; Community amenities: clubhouse, fitness center, playground, pool, tennis courts; Pets allowed (max ~30 lbs); Buyer approval required
Exterior
- Parking:
- Security:
- Utilities: Public sewer; Water connected; Sewer connected; Electricity connected; Cable connected; Water source: None listed
- Home design: Residential condominium; 2-story building; unit located on second floor; Faces east; Completed condition
- Construction: Block construction; Tile roof; Slab foundation; Built as part of building B
- Exterior features: Covered porch/patio; Screened porch/patio; Balcony; Asphalt road access
Interior
- Kitchen: Dishwasher; Microwave; Range; Refrigerator; Electric water heater
- Bedrooms: 3 bedrooms (unit on 2nd floor)
- Flooring: Carpet; Tile
- Bathrooms: 2 full bathrooms
- Heating & cooling: Central heating; Central air conditioning
- Interior features: Cathedral ceilings; Ceiling fans
- Laundry & utility: Inside laundry (washer/dryer connections); Dryer
Neighborhood map
What this means for you Summary
Snapshot
- This is a 2-bed/2.0-bath condo listed at $275k.
Deal economics
- At list price, monthly cash flow is $-145 ($-2k/yr) — negative.
- To cash-flow at today's rent, offer at most $249k (9.3% below list).
- Meets the 1% rule at list price ($3k rent vs $275k).
- Recommended offer: $242k (12.0% below list) — sets the bar for market timing.
- Cap rate 6.0% vs local median 1.8% in Marineland — top-decile yield for the area; either an underpriced asset or a hidden risk that comps aren't pricing in. Stress-test before assuming the spread holds.
Location & tenants
- Location reads 52/100 on livability (#886 in FL) — a working-class tenant base; expect higher turnover. Strengths: cost of living A+, crime A; Watch: health & safety C-, amenities F, commute F.
- Flagler (rural): math 53% / reading 56% proficiency, ranked #20 of 73 in FL (top 27%) — acceptable for families but not a draw, mixed tenant base, ~2y average lease.
- Market conditions: Rents flat; 1616 active listings in the ZIP; 6 comparable units currently listed for rent nearby; rentals at typical pace (median 25d on market — plan ~3-4 weeks tenant-placement turnaround); solid renter incomes; 2,588 units permitted in Flagler County in 2024 (0 in 5+ unit buildings).
- This rent runs 43% of the median local income ($84k/yr) — at the standard rent-burdened threshold; future hikes will face affordability resistance.
Forward outlook
- Local home prices are declining (-3.0%/yr); year-one equity from $2k of loan paydown is wiped out by about $8k of value loss. Plan a longer hold.
- Flagler County population projected at +28% by 2050 — long-run rental-demand tailwind backs the buy-and-hold thesis.
Negotiation context
- It's been on market 142 days — a 12% lower offer ($242k) is reasonable based on typical stale-listing flexibility.
- 5 sale attempts since 10y ago; this cycle's ask is 12395% above the opening price — seller raised mid-cycle; expect resistance to lowballs.
- Current owner paid $179k; list at $275k implies a 54% gain — meaningful room to come down on a strong offer.
Risks & watch-outs
- Watch-outs: flood insurance adds $66/mo; HOA is 20% of rent.
- Climate carrying-cost: severe flood risk; severe wind risk, 99% chance of damaging wind over 30y; extreme-heat days projected 7→20/yr by 2055 (HVAC capex compounding) — expect insurance premiums to compound above CPI over the hold.
Questions for the listing agent
- What do current leases actually rent for vs. the listed asking? Can we see a recent rent roll and the last 12 months of T-12 income?
- It's been on market 142 days. Have you received any prior offers? Is the seller open to a 12% concession, seller financing, or rate buy-down credit?
- What's the actual annual flood-insurance premium (NFIP or private), and is the property in a SFHA with mandatory coverage?
- What does the HOA fee cover, when was the last increase, and are there any pending special assessments or reserve-fund shortfalls?
- Any open or pending special assessments — roof, HVAC, plumbing, elevator, façade? What's the per-unit balance and payoff schedule, and is the seller paying it off at close or rolling it to the buyer?
- Why hasn't it sold? Are there any deal-killer items the seller is aware of (foundation, flood, title, zoning, code violations)?
- Is there a deadline driving the sale (1031 exchange, divorce, estate, relocation)? That informs how much negotiation room exists.
- The area grade is low — what's the realistic commute time and amenity access for the typical tenant pool here? Any planned neighborhood developments (good or bad) we should know about?
- What's the average days-on-market for RENTAL listings here right now (not sales)? A rising rental-DOM trend means longer vacancies and softer asking-rent achievability than the comps imply.
- What's the recent tenant-quality profile in this submarket — average credit score on applications, eviction rate, late-payment / NSF rate, and stable-employment percentage? A property-management company in the area should have these aggregated.
- How much new apartment / multifamily construction is in the pipeline within 1–3 miles? Heavy new supply (>2% of stock underway) typically softens rents 12–24 months out; light construction supports rent growth.
Investment metrics
- 1% rule
- 1.08% ✓
- Cap rate
- 5.95%
- Cash-on-cash
- -1.22%
- DSCR
- 0.95
- GRM
- 7.7
CMA / ARV
No comps found within radius.
Projected returns pro-forma
-3.0% appreciation · 0.85% rent growth · sell at horizon
- IRR
- -23.1%
- Equity multiple
- 0.23×
- Total profit
- $-59,653
- Equity at exit
- $40,988
- IRR
- -27.2%
- Equity multiple
- -0.13×
- Total profit
- $-86,907
- Equity at exit
- $23,768
Cash invested: $76,972 (down + closing). Projections, not guarantees.
Landlord ↔ Tenant lean methodology
- Overall (STATE)
- 87 Strongly Landlord-Friendly
- State Florida
- 87 Strongly Landlord-Friendly · R+3
- County
- — inherits STATE
- City
- — inherits STATE
ZIP-level market 32137
- Home prices YoY
- -34.5%
- Rents YoY
- 0.8%
- Active inventory
- 1616
- Price-to-rent
- 7.7×
Monthly cashflow live
- Estimated rent
- $2,975 high interval (Pro) →
- Mortgage (P&I)
- −$1,442
- Tax from tax record
- −$272 /mo · $3,267/yr
- Insurance
- −$115
- Flood insurance flood zone
- −$66 /mo · $798/yr
- HOA
- −$600
- Vacancy / Maint / Mgmt
- −$625
- Net cashflow
- $-145
Break-even live
Sensitivity live
| Price | -10% $11 | -5% $-67 | +0% $-145 | +5% $-223 | +10% $-300 |
|---|---|---|---|---|---|
| Rent | -10% $-380 | -5% $-262 | +0% $-145 | +5% $-27 | +10% $90 |
| Rate | -1.0pp $-6 | -0.5pp $-75 | base $-145 | +0.5pp $-216 | +1.0pp $-288 |
UW: 25.0% down · 7.5% · 30yr · 1.5% tax · 5.0% vac · 8.0% maint · 8.0% mgmt
Financing live
Cash to close
- Down payment
- $68,725
- Closing costs
- $8,247
- Reserves months
- —
- Total cash needed
- —
Loan-product check · same deal, 3 products live
Conventional
25% down · 7.5% · 30yr
- Down + closing
- —
- Monthly P&I
- —
- Monthly cashflow
- —
- DSCR
- —
- Eligible?
- —
Personal DTI + credit; lowest rate.
DSCR
20% down · 8.5% · 30yr
- Down + closing
- —
- Monthly P&I
- —
- Monthly cashflow
- —
- DSCR
- —
- Eligible?
- —
No personal income docs; deal must DSCR.
Hard money
10% down · 12.0% · 12mo
- Down + closing
- —
- Monthly P&I
- —
- Monthly cashflow
- —
- DSCR
- —
- Eligible?
- —
Short-term bridge; refi at stabilization.
Rent comps 6 comps
| Address | Beds | Baths | Sqft | Rent | $/sqft | DOM | Units | Dist |
|---|---|---|---|---|---|---|---|---|
| 29 San Jose Dr Palm Coast, FL | 2.0 | 2.0 | 1306 | $2,400 | $1.84 | 3d | 1 | 0.10mi |
| 104 Surfview Dr #1608 Palm Coast, FL | 2.0 | 2.0 | 1263 | $4,800 | $3.80 | 24d | 1 | 0.26mi |
| 104 Surfview Dr #2105 Palm Coast, FL | 2.0 | 2.0 | 1158 | $2,800 | $2.42 | 24d | 1 | 0.26mi |
| 110 Surfview Dr Unit 1261592P Palm Coast, FL | 2.0 | 2.0 | 1259 | $4,141 | $3.29 | 3d | 1 | 0.26mi |
| 22 Atlantic Dr Palm Coast, FL | 2.0 | 1.0 | 1056 | $3,500 | $3.31 | 15d | 1 | 1.45mi |
| 37 Atlantic Dr Palm Coast, FL | 3.0 | 2.0 | 1501 | $7,500 | $5.00 | 24d | 1 | 1.47mi |
HOA detail condo
- Monthly dues
- $600 · $7,200/yr
- Likely covers
- pool
- Assessments
- None detected in remarks — confirm with the listing agent.
Listing history 29 events
-
2026-06-21days on market $274,900 Active 142 DOM
-
2026-06-18days on market $274,900 Active 139 DOM
-
2026-06-17days on market $274,900 Active 138 DOM
-
2026-06-16days on market $274,900 Active 137 DOM
-
2026-06-15days on market $274,900 Active 136 DOM
-
2026-06-14days on market $274,900 Active 134 DOM
-
2026-06-13days on market $274,900 Active 133 DOM
-
2026-06-10days on market $274,900 Active 131 DOM
-
2026-06-09days on market $274,900 Active 130 DOM
-
2026-06-08days on market $274,900 Active 129 DOM
-
2026-06-07days on market $274,900 Active 128 DOM
-
2026-06-03days on market $274,900 Active 124 DOM
-
2026-06-02days on market $274,900 Active 123 DOM
-
2026-06-01days on market $274,900 Active 122 DOM
-
2026-05-31days on market $274,900 Active 121 DOM
-
2026-04-11historical $2,200
-
2026-01-31$2,200
-
2026-01-30historical
-
2026-01-30$274,900 Active
-
2025-07-29historical Active Under Contract
-
2025-07-07price $279,900
-
2025-06-13price $284,900
-
2025-06-01$294,900 Active
-
2024-11-23historical $1,850
-
2024-10-19$1,850
-
2016-07-08soldstatus $179,000
-
2016-06-27soldstatus $179,000 1010-char remark
Show marketing remark (1010 chars)
Wow! TURN-KEY. .. .. .. TOP FLOOR, Open, Airy, Spacious three bedroom, two bath CORNER unit! Absolutely the BEST PRICED, WITH incredible amenities surrounded by ocean front and intracoastal access! Located in our beautiful Matanzas Shores, this condo is loaded with many comfortable amenities, textured laced "Volume Ceilings", like new laminate counter tops in kitchen and cultured marble tops in bathrooms, white raised panel cabinetry, ceramic tile in kitchen, entry and bathrooms, like new carpet in living and bedrooms, hardly used Appliances, side by side washer/dryer, and all with lots of nice open space to entertain on your screened 22' wide patio balcony with access to Master bedroom and 8' x 14' sliding glass wall of window from the living room. Matanzas Shores=True Florida Living! Access to Ocean Front Beach! Swimming pools, Tennis courts, Spa, intracoastal boat dock/best fishing, and spacious clubhouse, and miles of walking /biking trails in this "sought after" area!
-
2016-02-10$189,900 1010-char remark
Show marketing remark (1010 chars)
Wow! TURN-KEY. .. .. .. TOP FLOOR, Open, Airy, Spacious three bedroom, two bath CORNER unit! Absolutely the BEST PRICED, WITH incredible amenities surrounded by ocean front and intracoastal access! Located in our beautiful Matanzas Shores, this condo is loaded with many comfortable amenities, textured laced "Volume Ceilings", like new laminate counter tops in kitchen and cultured marble tops in bathrooms, white raised panel cabinetry, ceramic tile in kitchen, entry and bathrooms, like new carpet in living and bedrooms, hardly used Appliances, side by side washer/dryer, and all with lots of nice open space to entertain on your screened 22' wide patio balcony with access to Master bedroom and 8' x 14' sliding glass wall of window from the living room. Matanzas Shores=True Florida Living! Access to Ocean Front Beach! Swimming pools, Tennis courts, Spa, intracoastal boat dock/best fishing, and spacious clubhouse, and miles of walking /biking trails in this "sought after" area!
-
2002-06-01soldstatus $153,800
ⓘ Source: listings_history table (triggers on properties + properties_extension) + one-shot
backfill from property_details.listing_events for pre-trigger history.
Tax reassessment forecast FL · Resets to sale price
- Current annual tax
- $3,267 · $272/mo
- Projected year-2 tax
- $3,267 · $272/mo
- Expected delta
- $0/yr ($0/mo · 0.0%)
ⓘ Screening estimate from a state-policy table — verify with the county assessor before closing.
Climate risk First Street
- Flood 8/10 Severe FEMA zone X (shaded) · 97% chance over 30 yrs
- Wildfire 2/10 Low
- Heat 9/10 Extreme 7 d/yr ≥105°F today · 20 d/yr by 30 yrs out
- Wind 10/10 Extreme 99% chance of damaging wind over 30 yrs
- Air quality 2/10 Low 2 unhealthy d/yr today · 2 by 30 yrs out
Nearby sold comps map
Loading sold comps map…
Walkable amenities ~0.75 mi
Loading nearby amenities…
Taxation est. · year 1
- Rental income
- $35,698
- − Mortgage interest
- −$15,399
- − Property taxes
- −$3,267
- − Insurance
- −$2,172
- − Repairs & maintenance
- −$2,856
- − Management
- −$2,856
- − HOA
- −$7,200
- − Depreciation
- −$7,997
- Taxable loss
- −$6,048
- Est. tax savings @ 24.0%
- +$1,452
- After-tax cash flow
- $-285/yr
For passive investors: Depreciation is non-cash, so a rental often shows a tax loss while cash-flowing — sheltering income. Rental losses are passive: they offset passive income freely, and up to $25,000/yr can offset ordinary (W-2) income if you actively participate and your MAGI is under $100k (phasing out to $0 by $150k); unused losses carry forward. On sale, claimed depreciation is recaptured at up to 25%, and gains may owe capital-gains tax (a 1031 exchange can defer both). Figures are a year-1 estimate at your 24.0% rate — not tax advice; consult a CPA.
Schools (NCES district)
- District
- Flagler
- NCES district ID
- 1200540
- Math proficiency
- 53% ▼ -9.00%
- Reading proficiency
- 56% ▼ -4.00%
- Median HH income
- $48,354
- Composite
- 46.35/100
- National rank
- #2464
- State rank
- #20 of 73 in FL
Livability — Marineland
- Score
- 52/100
- State rank
- #886
- US rank
- #25050
Category grades
Schools grade is shown separately in the Schools card above.
Census & demographics
- County
- Flagler County · 113,412 people
- Metro
- Deltona-Daytona Beach-Ormond Beach, FL
- Population (ZIP)
- 48,391
- Household income
- $83,923
- Rent vs Own
- Severe rent burden
- 816.0
Population outlook (Flagler County) Hauer SSP2
- Today (2025)
- 123,474 people
- By 2030
- 131,864 · +6.8%
- By 2040
- 146,176 · +18.4%
- By 2050
- 157,398 · +27.5%
- By 2075
- 177,990 · +44.2%
- By 2100
- 183,381 · +48.5%
Race, ethnicity, and origin ACS 2023
- Neighborhood character
- Predominantly White (77%)
- Race & ethnicity
- White 77% Hispanic / Latino 10% Two or more races 8% Black 6% Asian 3%
- Hispanic origin (detail)
- Puerto Rican 4% Cuban 1%
- Common ancestry
- Romanian 4% Russian 2% Lithuanian 2%
- Foreign-born
- 13% · Canada, Jamaica
- Languages at home
- 85% English-only · Spanish 7% Other Indo-European 3% Russian/Polish/Slavic 2%
Political lean MEDSL · Flagler
- 2024 margin
- Strong R (+28.2) · D 35.6% · R 63.8%
- 2008→2024 swing
- -29.8pp toward R · 2008: 1.6pp · 2024: -28.2pp
- All cycles
- 2024: R+28.2 2020: R+20.8 2016: R+20.6 2012: R+7.4 2008: D+1.6
Not yet ingested
- Civics
- —
Market trends
- HPI YoY
- ▼ -153.27%
- Current HPI
- 290.4607
- Rent YoY
- ▲ 0.85%
- Metro
- Deltona-Daytona Beach-Ormond Beach, FL
- State GDP YoY
- ▲ 3.28%
- F500 in state
- 36
Industry mix (Fortune 500 HQ in FL)
| Industry | F500 HQs | Revenue |
|---|---|---|
| Industrial Technology | 2 | $29B |
|
||
| Insurance | 2 | $17B |
|
||
| Retail | 1 | $60B |
|
||
| Technology Distribution | 1 | $58B |
|
||
| Homebuilding | 1 | $35B |
|
||
| Technology Manufacturing | 1 | $35B |
|
||
Price history
-98.6% since first listed14 events — show timeline
- 2026-04-11 Rental Removed $2,200 STELLARMLS
- 2026-01-31 Listed for Rent $2,200 STELLARMLS
- 2026-01-30 Listing Removed — Beaches MLS
- 2026-01-30 Listed $274,900 Stellar MLS as Distributed by MLS Grid
- 2025-07-29 Contingent — Beaches MLS
- 2025-07-07 Price Changed $279,900 Beaches MLS
- 2025-06-13 Price Changed $284,900 Beaches MLS
- 2025-06-01 Listed $294,900 Beaches MLS
- 2024-11-23 Rental Removed $1,850 STELLARMLS
- 2024-10-19 Listed for Rent $1,850 STELLARMLS
- 2016-07-08 Sold (Public Records) $179,000 Public Records
- 2016-06-27 Sold (MLS) $179,000 Stellar MLS as Distributed by MLS Grid
- 2016-02-10 Listed $189,900 Stellar MLS as Distributed by MLS Grid
- 2002-06-01 Sold (Public Records) $153,800 Public Records
Property tax history
+6.5%/yrLatest (2025): $3,267 · +4.6% YoY. Source: county tax records.
Cash-flow waterfall
monthlySold comps — $/sqft
last 12 mo · ≤1 miLoading sold comps…