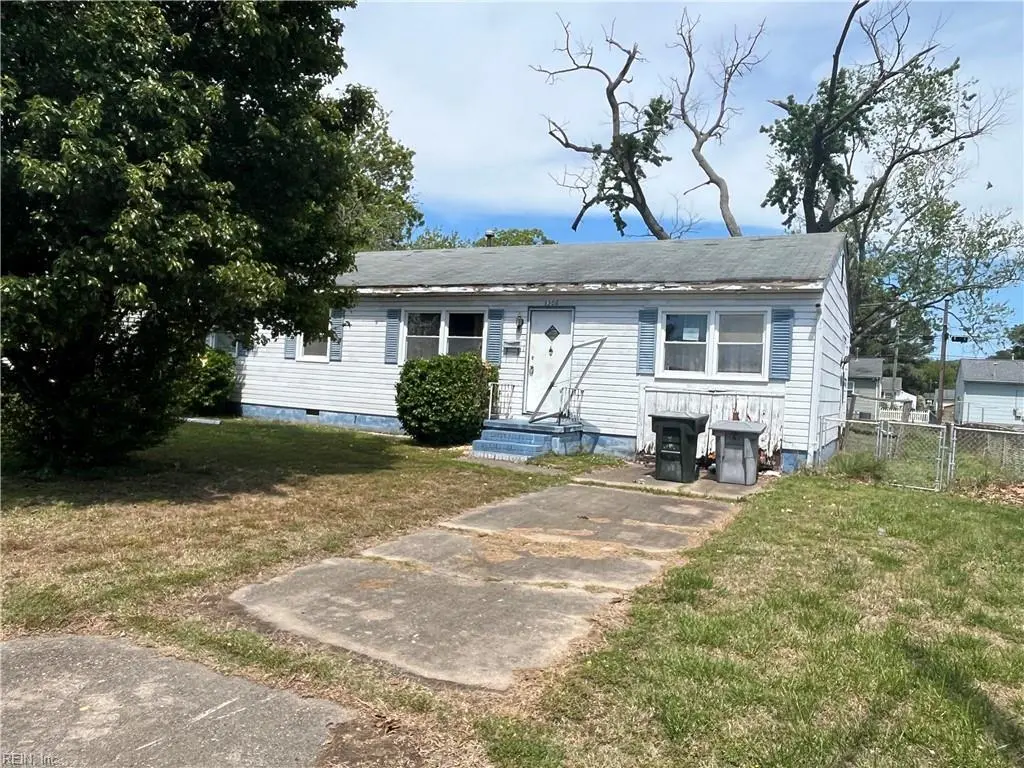
8508 Kennedy Dr · Hampton, VA
Flood risk 6/10 · Moderate
- FEMA flood zone
- AE
- Chance of flooding over 30 yrs
- 0.73%
- Est. flood insurance / yr
- $2,026 – $9,024
Fire risk 1/10 · Minimal
- Est. fire insurance / yr
- $666 – $1,236
Heat risk 9/10 · Severe
- Hot days now (above 106°F)
- 7 days/yr
- Hot days in 30 yrs
- 16 days/yr
Wind risk 8/10 · Major
- Chance of severe wind over 30 yrs
- 80.0%
Air-quality risk 2/10 · Minimal
- Unhealthy air days now
- 1 days/yr
- Unhealthy air days in 30 yrs
- 1 days/yr
Risk factors via First Street. Map © Google.
Why this score? — see what drove the B grade
The composite is a weighted blend of 9 inputs, each scored 0–100. Each bar is that input's sub-score; the figure is the points it added to the 100-point composite (weight × sub-score).
- Cash flow +30.0/30.0
- DSCR +10.0/10.0
- 1% rule +9.6/10.0
- ARV discount +7.5/15.0
- Schools +5.5/10.0
- Rent growth +4.7/5.0
- Livability +3.8/5.0
- Condition / age +2.5/5.0
- Appreciation +0.0/10.0
$120,000
🖨 Deal sheet 📄 Offer letter ✓ Due diligence
Listing remarks
Investor special with strong upside potential! This 3-bedroom, 1-bath ranch offers an opportunity for renovation in an established Hampton neighborhood with renovated and well-maintained homes nearby. Conveniently located near shopping, dining, schools, and interstate access. Property is being sold strictly as-is. Great potential for fix-and-flip or long-term investment. This property may qualify for Seller Financing (Vendee). The property was built prior to 1978 and lead based paint may potentially exist.
Key facts
- Near schools
- Near dining
- Near shopping
Tags
Property features AI
Finance
- HOA & community: No HOA fees
Exterior
- Parking: Driveway parking spaces
- Utilities: City/County water; City/County sewer; Electric water heater
- Home design: Detached ranch single-family home; Single-story (one living level); Crawl foundation; Simple ownership
- Construction: Asphalt shingle roof
- Exterior features: Aluminum siding; Back yard fenced; Storage shed
Interior
- Kitchen: Electric range; Microwave; Dishwasher; Refrigerator
- Bedrooms: Bedroom and full bathroom on the first floor; 5 total rooms including 1st floor bedroom, attic, spare room, and utility closet
- Flooring: Carpet; Vinyl
- Bathrooms: 1 full bathroom; 1 half bathroom
- Heating & cooling: Heat pump for heating and cooling
- Interior features: Scuttle (attic) access
- Laundry & utility: Washer hookup; Dryer hookup; Washer included
Neighborhood map
What this means for you Summary
Snapshot
- This is a 3-bed/1.5-bath single-family listed at $120k.
Deal economics
- At list price, monthly cash flow is $55 ($660/yr) — positive.
- The deal already cash-flows at list — no discount required.
- Meets the 1% rule at list price ($2k rent vs $120k).
- Cap rate 11.4% vs local median 4.5% in Hampton — top-decile yield for the area; either an underpriced asset or a hidden risk that comps aren't pricing in. Stress-test before assuming the spread holds.
Location & tenants
- Location reads 75/100 on livability (#133 in VA, #4,302 nationally) — a middle-class / working-renter tenant base. Strengths: housing A+, health & safety A+, cost of living A; Watch: crime C-, amenities D+, commute F.
- Hampton City Public School District (urban): math 60% / reading 70% proficiency, ranked #40 of 131 in VA (top 30%) — acceptable for families but not a draw, mixed tenant base, ~2y average lease.
- Zoned schools: Alfred S. Forrest Elementary (math 47% / reading 62%, grade C, #650 of 1,108 statewide, top 62%, 540 students, 85% FRL); Bethel High (math 64% / reading 84%, grade B+, #120 of 319 statewide, top 38%, 1,777 students, 86% FRL) — zoned schools average 85% FRL vs 49% district-wide (37 pts higher); higher-poverty schools than district average — tighter screening recommended.
- Market conditions: Rents rising fast (+8.9%/yr); 42 active listings in the ZIP; 19 comparable units currently listed for rent nearby; rentals at typical pace (median 24d on market — plan ~3-4 weeks tenant-placement turnaround); 68 units permitted in Hampton city in 2024 (0 in 5+ unit buildings).
- This rent runs 39% of the median local income ($54k/yr) — at the standard rent-burdened threshold; future hikes will face affordability resistance.
Forward outlook
- Local home prices are declining (-3.0%/yr); year-one equity from $830 of loan paydown is wiped out by about $4k of value loss. Plan a longer hold.
- Hampton County population projected at -13% by 2050 — secular population decline; favor cash flow + early exit over multi-decade hold.
- At projected returns (-3.0% appreciation + 8.0% rent growth), your $34k cash investment doubles in ~9 years — after that, you're playing with house money.
Negotiation context
- Only 11 days on market — expect competitive offers; lowballing is unlikely to land.
Risks & watch-outs
- Watch-outs: flood insurance adds $460/mo.
- Climate carrying-cost: in FEMA flood zone AE (mandatory federal flood insurance); severe wind risk, 80% chance of damaging wind over 30y; extreme-heat days projected 7→16/yr by 2055 (HVAC capex compounding) — expect insurance premiums to compound above CPI over the hold.
Questions for the listing agent
- Built in 1962 — when were the roof, HVAC, electrical panel, plumbing, and water heater last replaced?
- What's the actual annual flood-insurance premium (NFIP or private), and is the property in a SFHA with mandatory coverage?
- Is there a deadline driving the sale (1031 exchange, divorce, estate, relocation)? That informs how much negotiation room exists.
- Schools are B-rated — typically a magnet for longer-tenancy family renters. What's the average tenant stay here, and is there a school-zone premium baked into asking?
- What's the average days-on-market for RENTAL listings here right now (not sales)? A rising rental-DOM trend means longer vacancies and softer asking-rent achievability than the comps imply.
- What's the recent tenant-quality profile in this submarket — average credit score on applications, eviction rate, late-payment / NSF rate, and stable-employment percentage? A property-management company in the area should have these aggregated.
- How much new for-sale + rental construction is in the pipeline within 1–3 miles? Heavy new supply typically softens prices + rents 12–24 months out; constrained supply supports both.
Investment metrics
- 1% rule
- 1.46% ✓
- Cap rate
- 11.45%
- Cash-on-cash
- 18.41%
- DSCR
- 1.82
- GRM
- 5.7
CMA / ARV
- ARV (median comp)
- $240,954
- List price
- $120,000
- Delta
- -50.20%
- Verdict
- UNDERPRICED
- Comps
- 20 within 1.0 mi
Show comp detail 12 sales within ~0.75 mi
| Address | Dist | Beds/Ba | Sqft | Sold | Price | $/sf | Match |
|---|---|---|---|---|---|---|---|
| 8513 Orcutt Ave | 0.04mi | 3/1.0 | 1,282 (+3%) | 3mo | $259,900 | $203 | 89 |
| 5004 Arony St | 0.08mi | 4/2.0 (+1) | 1,250 (+0%) | 4mo | $285,000 | $228 | 86 |
| 633 Brewer St | 0.41mi | 3/2.0 | 1,300 (+4%) | 2mo | $255,000 | $196 | 70 |
| 610 Brooke St | 0.54mi | 3/2.0 | 1,299 (+4%) | 2mo | $292,000 | $225 | 65 |
| 377 Whealton Rd | 0.17mi | 3/2.0 | 1,426 (+14%) | 4mo | $205,000 | $144 | 63 |
| 727 Bellwood Rd | 0.73mi | 3/1.5 | 1,278 (+2%) | 1mo | $160,000 | $125 | 61 |
| 17 Roberta Dr | 0.70mi | 3/2.0 | 1,282 (+3%) | 2mo | $320,000 | $250 | 59 |
| 444 Martha Lee Dr | 0.64mi | 3/1.5 | 1,348 (+8%) | 1mo | $205,000 | $152 | 56 |
| 5007 81st St | 0.60mi | 3/2.0 | 1,140 (-9%) | 6mo | $269,900 | $237 | 51 |
| 4827 81st St | 0.62mi | 4/1.0 (+1) | 1,153 (-8%) | 1mo | $263,900 | $229 | 50 |
| 1008 80th St | 0.66mi | 3/1.0 | 1,121 (-10%) | 2mo | $122,000 | $109 | 49 |
| 5111 81st St | 0.62mi | 3/1.0 | 1,062 (-15%) | 4mo | $180,000 | $169 | 41 |
Match score weights: distance 35% · size 25% · config 20% · recency 20%. Top-matched comps best support the ARV.
Projected returns pro-forma
-3.0% appreciation · 8.0% rent growth · sell at horizon
- IRR
- -4.7%
- Equity multiple
- 0.81×
- Total profit
- $-6,319
- Equity at exit
- $17,892
- IRR
- 12.0%
- Equity multiple
- 2.27×
- Total profit
- $42,637
- Equity at exit
- $10,375
Cash invested: $33,600 (down + closing). Projections, not guarantees.
Landlord ↔ Tenant lean methodology
- Overall (STATE)
- 55 Moderately Landlord-Leaning
- State Virginia
- 55 Moderately Landlord-Leaning · D+2
- County
- — inherits STATE
- City
- — inherits STATE
ZIP-level market 23605
- Home prices YoY
- -7.6%
- Rents YoY
- 8.9%
- Active inventory
- 42
- Price-to-rent
- 5.7×
Monthly cashflow live
- Estimated rent
- $1,757 high interval (Pro) →
- Mortgage (P&I)
- −$629
- Tax from tax record
- −$193 /mo · $2,320/yr
- Insurance
- −$50
- Flood insurance flood zone
- −$460 /mo · $5,525/yr
- HOA
- −$0
- Vacancy / Maint / Mgmt
- −$369
- Net cashflow
- $55
Break-even live
UW: 25.0% down · 7.5% · 30yr · 1.5% tax · 5.0% vac · 8.0% maint · 8.0% mgmt
Financing live
Cash to close
- Down payment
- $30,000
- Closing costs
- $3,600
- Reserves months
- —
- Total cash needed
- —
Loan-product check · same deal, 3 products live
Conventional
25% down · 7.5% · 30yr
- Down + closing
- —
- Monthly P&I
- —
- Monthly cashflow
- —
- DSCR
- —
- Eligible?
- —
Personal DTI + credit; lowest rate.
DSCR
20% down · 8.5% · 30yr
- Down + closing
- —
- Monthly P&I
- —
- Monthly cashflow
- —
- DSCR
- —
- Eligible?
- —
No personal income docs; deal must DSCR.
Hard money
10% down · 12.0% · 12mo
- Down + closing
- —
- Monthly P&I
- —
- Monthly cashflow
- —
- DSCR
- —
- Eligible?
- —
Short-term bridge; refi at stabilization.
Rent comps 19 comps
| Address | Beds | Baths | Sqft | Rent | $/sqft | DOM | Units | Dist |
|---|---|---|---|---|---|---|---|---|
| 5014 Hazelwood Rd Newport News, VA | 3.0 | 1.0 | 955 | $1,900 | $1.99 | 2d | 1 | 0.12mi |
| 624 Sterling St Newport News, VA | 2.0 | 1.0 | 821 | $1,500 | $1.83 | 17d | 1 | 0.39mi |
| 314 Martha Lee Dr Hampton, VA | 3.0 | 2.0 | 1210 | $2,200 | $1.82 | 24d | 1 | 0.65mi |
| 606 Randolph Rd Newport News, VA | 3.0 | 1.0 | 989 | $1,475 | $1.49 | 44d | 1 | 0.67mi |
| 346 Sitka Ct Hampton, VA | 3.0 | 1.5 | 1210 | $1,675 | $1.38 | 24d | 1 | 0.77mi |
| 604 Big Bethel Rd Hampton, VA | 3.0 | 1.5 | 1139 | $2,300 | $2.02 | 44d | 1 | 0.85mi |
| 116 Tyler Ave Unit 1A Newport News, VA | 2.0 | 1.0 | 950 | $1,075 | $1.13 | 44d | 1 | 0.86mi |
| 6010 Jefferson Ave Newport News, VA | 2.0 | 1.0 | 900 | $1,245 | $1.38 | 44d | 2 | 0.88mi |
| 1112 74th St Newport News, VA | 3.0 | 1.0 | 928 | $1,500 | $1.62 | 21d | 1 | 0.98mi |
| 531 Bulkeley Pl Newport News, VA | 2.0–3.0 | 1.0–1.5 | 780 | $1,891 | $2.42 | 2d | 20 | 1.04mi |
| 620 73rd St Newport News, VA | 3.0 | 2.0 | 1203 | $1,900 | $1.58 | 2d | 1 | 1.09mi |
| 602 74th St Newport News, VA | 2.0 | 1.0 | 950 | $1,080 | $1.14 | 24d | 1 | 1.09mi |
| 634 72nd St Newport News, VA | 2.0 | 1.0 | 736 | $1,100 | $1.49 | 24d | 1 | 1.12mi |
| 321 Big Bethel Rd Hampton, VA | 3.0 | 1.0 | 1400 | $2,300 | $1.64 | 12d | 1 | 1.13mi |
| 1600 Pennwood Dr Hampton, VA | 2.0 | 1.0 | 881 | $1,350 | $1.53 | 44d | 6 | 1.20mi |
| 207 Ferguson Ave Newport News, VA | 3.0 | 1.0 | 1350 | $1,495 | $1.11 | 24d | 1 | 1.27mi |
| 37 Pennwood Dr Hampton, VA | 3.0 | 2.0 | 1156 | $1,795 | $1.55 | 24d | 1 | 1.28mi |
| 315 Piez Ave Newport News, VA | 2.0 | 1.0 | 1081 | $1,395 | $1.29 | 11d | 1 | 1.32mi |
| 6206 Hilmar Pl Newport News, VA | 2.0 | 1.0 | 975 | $995 | $1.02 | 44d | 1 | 1.46mi |
Listing history 4 events
-
2026-05-11$120,000 Active 511-char remark
-
2006-11-30soldstatus $172,000
-
2006-07-27soldstatus $84,000
-
1995-07-01soldstatus $72,000
ⓘ Source: listings_history table (triggers on properties + properties_extension) + one-shot
backfill from property_details.listing_events for pre-trigger history.
Tax reassessment forecast VA · Resets to sale price
- Current annual tax
- $2,320 · $193/mo
- Projected year-2 tax
- $2,320 · $193/mo
- Expected delta
- $0/yr ($0/mo · 0.0%)
ⓘ Screening estimate from a state-policy table — verify with the county assessor before closing.
Climate risk First Street
- Flood 6/10 Major FEMA zone AE · 73% chance over 30 yrs
- Wildfire 1/10 Low
- Heat 9/10 Extreme 7 d/yr ≥106°F today · 16 d/yr by 30 yrs out
- Wind 8/10 Severe 80% chance of damaging wind over 30 yrs
- Air quality 2/10 Low 1 unhealthy d/yr today · 1 by 30 yrs out
Nearby sold comps map
Loading sold comps map…
Walkable amenities ~0.75 mi
Loading nearby amenities…
Taxation est. · year 1
- Rental income
- $21,084
- − Mortgage interest
- −$6,722
- − Property taxes
- −$2,320
- − Insurance
- −$6,125
- − Repairs & maintenance
- −$1,687
- − Management
- −$1,687
- − Depreciation
- −$3,491
- Taxable loss
- −$947
- Est. tax savings @ 24.0%
- +$227
- After-tax cash flow
- $887/yr
For passive investors: Depreciation is non-cash, so a rental often shows a tax loss while cash-flowing — sheltering income. Rental losses are passive: they offset passive income freely, and up to $25,000/yr can offset ordinary (W-2) income if you actively participate and your MAGI is under $100k (phasing out to $0 by $150k); unused losses carry forward. On sale, claimed depreciation is recaptured at up to 25%, and gains may owe capital-gains tax (a 1031 exchange can defer both). Figures are a year-1 estimate at your 24.0% rate — not tax advice; consult a CPA.
Schools (NCES district)
- District
- Hampton City Public School District
- NCES district ID
- 5101800
- Math proficiency
- 60% ▼ -21.00%
- Reading proficiency
- 70% ▼ -4.00%
- Median HH income
- $50,089
- Composite
- 55.19/100
- National rank
- #1272
- State rank
- #40 of 131 in VA
Livability — Hampton
- Score
- 75/100
- State rank
- #133
- US rank
- #4302
Category grades
Schools grade is shown separately in the Schools card above.
Census & demographics
- Census place
- Hampton, VA
- County
- Newport News City · 178,950 people
- City population
- 132,421
- Metro
- Virginia Beach-Norfolk-Newport News, VA-NC
- Population (ZIP)
- 13,332
- Household income
- $53,815
- Rent vs Own
- Severe rent burden
- 1119.0
Population outlook (Hampton County) Hauer SSP2
- Today (2025)
- 134,055 people
- By 2030
- 131,753 · -1.7%
- By 2040
- 125,017 · -6.7%
- By 2050
- 116,825 · -12.9%
- By 2075
- 97,033 · -27.6%
- By 2100
- 76,188 · -43.2%
Race, ethnicity, and origin ACS 2023
- Neighborhood character
- Diverse neighborhood (Simpson 0.58)
- Race & ethnicity
- Black 59% White 25% Two or more races 9% Hispanic / Latino 8%
- Hispanic origin (detail)
- Mexican 3% Puerto Rican 3%
- Common ancestry
- Romanian 2% Lithuanian 1% Italian 1%
- Foreign-born
- 5% · Canada, Jamaica
- Languages at home
- 94% English-only · Spanish 5%
Political lean MEDSL · Hampton
- 2024 margin
- Solid D (+39.9) · D 69.2% · R 29.4% · Other 1.4%
- 2008→2024 swing
- +1.0pp no change · 2008: 38.9pp · 2024: 39.9pp
- All cycles
- 2024: D+39.9 2020: D+42.2 2016: D+37.8 2012: D+45.4 2008: D+38.9
Not yet ingested
- Civics
- —
Market trends
- HPI YoY
- ▼ -24.94%
- Current HPI
- 305.0997
- Rent YoY
- ▲ 8.87%
- Metro
- Virginia Beach-Norfolk-Newport News, VA-NC
- State GDP YoY
- ▲ 2.40%
- F500 in state
- 50
Industry mix (Fortune 500 HQ in VA)
| Industry | F500 HQs | Revenue |
|---|---|---|
| Aerospace / Defense | 4 | $236B |
|
||
| Technology / Defense | 3 | $32B |
|
||
| Financial Services | 2 | $176B |
|
||
| Utilities | 2 | $27B |
|
||
| Insurance | 2 | $25B |
|
||
| Technology | 2 | $15B |
|
||
Price history
+66.7% since first listed5 events — show timeline
- 2026-05-22 Pending — REINMLS
- 2026-05-11 Listed $120,000 REINMLS
- 2006-11-30 Sold (Public Records) $172,000 Public Records
- 2006-07-27 Sold (Public Records) $84,000 Public Records
- 1995-07-01 Sold (Public Records) $72,000 Public Records
Property tax history
+8.0%/yrLatest (2025): $2,320 · +2.8% YoY. Source: county tax records.
Cash-flow waterfall
monthlySold comps — $/sqft
last 12 mo · ≤1 miLoading sold comps…