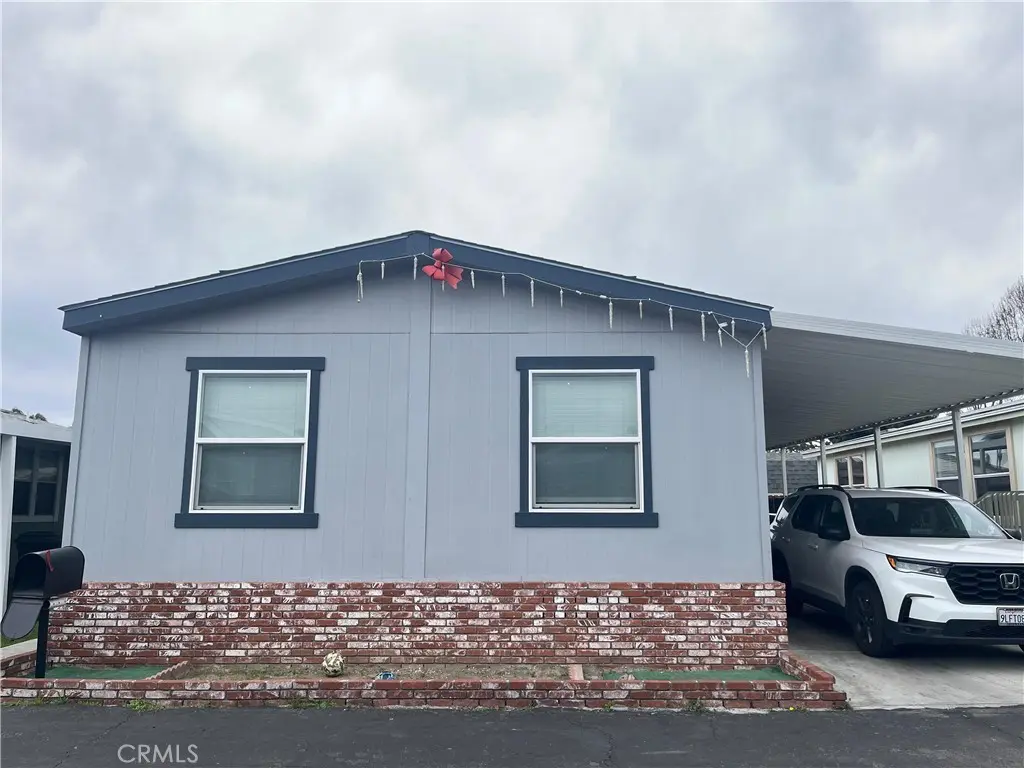
9080 Bloomfield #108 · Cypress, CA
Flood risk 1/10 · Minimal
- FEMA flood zone
- X
- Chance of flooding over 30 yrs
- 0.0%
- Est. flood insurance / yr
- $507 – $1,088
Fire risk 1/10 · Minimal
- Est. fire insurance / yr
- $659 – $1,223
Heat risk 5/10 · Moderate
- Hot days now (above 89°F)
- 7 days/yr
- Hot days in 30 yrs
- 24 days/yr
Wind risk 1/10 · Minimal
- Chance of severe wind over 30 yrs
- —
Air-quality risk 5/10 · Moderate
- Unhealthy air days now
- 7 days/yr
- Unhealthy air days in 30 yrs
- 9 days/yr
Risk factors via First Street. Map © Google.
Why this score? — see what drove the B- grade
The composite is a weighted blend of 9 inputs, each scored 0–100. Each bar is that input's sub-score; the figure is the points it added to the 100-point composite (weight × sub-score).
- Cash flow +30.0/30.0
- 1% rule +10.0/10.0
- DSCR +10.0/10.0
- Schools +6.2/10.0
- ARV discount +4.6/15.0
- Livability +3.7/5.0
- Rent growth +2.9/5.0
- Condition / age +2.2/5.0
- Appreciation +0.0/10.0
$190,000
🖨 Deal sheet 📄 Offer letter ✓ Due diligence
Listing remarks
This gorgeous Mobile/manufactured is in a nice Park Community, home has 3 bedrooms, 2 bathrooms it has open floor plan with sjylight in the kitchen, this one is spacious with laguna cabinets, laminate counters. all bedrooms have ceiling fans. This cozy home has nice back yard area to relax or enjoy with friends. It is walking distance of both elementary and junior high schools. Carport parking for 3 mid-sized cars/ The Park offers pool, party center and play ground. Come and check it out!
Key facts
- Open floor plan
- Ceiling fans
- Laguna cabinets
Tags
Property features AI
Finance
- Other: Lot features: 0-1 unit per acre; Lot size source: Assessor's data
- Financial info: Monthly land lease: $2,100
- HOA & community: Community playground; Manager approval required for park residency
Exterior
- Parking: Carport; Parking available; Located in Lincoln Center Mobile Park
- Utilities: Public/district water; Public sewer; Standard electric service; Telephone available in street; Natural gas available; Electricity available
- Home design: Mobile home (11' x 44'); Single story; Has view
- Construction: Shingle roof; Drywall walls; Mobile home remains on site; Year built per assessor
- Exterior features: Community pool; Suburban community
Interior
- Kitchen: Gas oven; Appliances included
- Bedrooms: Bedrooms located on main level
- Bathrooms: Two full bathrooms; Shower(s)
- Heating & cooling: Wall/window cooling
- Interior features: One-level home; All bedrooms on ground level; Living room
- Laundry & utility: Laundry inside; 220V outlet in laundry area
Neighborhood map
What this means for you Summary
Snapshot
- This is a 3-bed/2.0-bath manufactured listed at $190k. Condition is rated fair.
Deal economics
- At list price, monthly cash flow is $2k ($19k/yr) — positive.
- The deal already cash-flows at list — no discount required.
- Meets the 1% rule at list price ($3k rent vs $190k).
- Recommended offer: $179k (6.0% below list) — sets the bar for market timing.
- Cap rate 16.3% vs local median 2.2% in Cypress — top-decile yield for the area; either an underpriced asset or a hidden risk that comps aren't pricing in. Stress-test before assuming the spread holds.
Location & tenants
- Location reads 74/100 on livability (#141 in CA, #4,900 nationally) — a middle-class / working-renter tenant base. Strengths: schools A+, employment A+, commute A; Watch: health & safety D, cost of living F.
- Cypress Elementary (suburban): math 67% / reading 69% proficiency, ranked #117 of 1,400 in CA (top 8%) — acceptable for families but not a draw, mixed tenant base, ~2y average lease.
- Market conditions: Rents rising (+1.7%/yr); 70 active listings in the ZIP; 33 comparable units currently listed for rent nearby; rentals leasing fast (median 10d on market — plan ~1-2 weeks tenant-placement turnaround); high-income renter base; 6,974 units permitted in Orange County in 2024 (3,839 in 5+ unit buildings).
- This rent runs 32% of the median local income ($130k/yr) — at the standard rent-burdened threshold; future hikes will face affordability resistance.
Forward outlook
- Local home prices are declining (-3.0%/yr); year-one equity from $1k of loan paydown is wiped out by about $6k of value loss. Plan a longer hold.
- Orange County population projected at +14% by 2050 — modest demand growth; plan on rents tracking national, not racing it.
- At projected returns (-3.0% appreciation + 1.7% rent growth), your $53k cash investment doubles in ~4 years — after that, you're playing with house money.
Negotiation context
- It's been on market 80 days — a 6% lower offer ($179k) is reasonable based on typical stale-listing flexibility.
- 5 sale attempts since 3y ago with the ask held roughly flat each time — persistent listings suggest the price (not the market) is what's stuck; bring a comps-based counter.
Risks & watch-outs
- Climate carrying-cost: extreme-heat days projected 7→24/yr by 2055 (HVAC capex compounding) — expect insurance premiums to compound above CPI over the hold.
Questions for the listing agent
- It's been on market 80 days. Have you received any prior offers? Is the seller open to a 6% concession, seller financing, or rate buy-down credit?
- Have any recent inspections been done? Can we get a copy of the seller's disclosures and any deferred-maintenance estimates?
- Why hasn't it sold? Are there any deal-killer items the seller is aware of (foundation, flood, title, zoning, code violations)?
- Is there a deadline driving the sale (1031 exchange, divorce, estate, relocation)? That informs how much negotiation room exists.
- Schools are A-rated — typically a magnet for longer-tenancy family renters. What's the average tenant stay here, and is there a school-zone premium baked into asking?
- What's the average days-on-market for RENTAL listings here right now (not sales)? A rising rental-DOM trend means longer vacancies and softer asking-rent achievability than the comps imply.
- What's the recent tenant-quality profile in this submarket — average credit score on applications, eviction rate, late-payment / NSF rate, and stable-employment percentage? A property-management company in the area should have these aggregated.
- How much new for-sale + rental construction is in the pipeline within 1–3 miles? Heavy new supply typically softens prices + rents 12–24 months out; constrained supply supports both.
Investment metrics
- 1% rule
- 1.82% ✓
- Cap rate
- 16.29%
- Cash-on-cash
- 35.69%
- DSCR
- 2.59
- GRM
- 4.6
CMA / ARV
- ARV (on-the-fly)
- $178,470
- Comps found
- 12
Show comp detail 12 sales within ~0.75 mi
| Address | Dist | Beds/Ba | Sqft | Sold | Price | $/sf | Match |
|---|---|---|---|---|---|---|---|
| 9080 Bloomfield Ave #230 | 0.00mi | 3/2.0 | 1,272 (-4%) | 1mo | $159,900 | $126 | 92 |
| 9080 Bloomfield Ave #209 | 0.00mi | 3/2.0 | 1,248 (-6%) | 3mo | $129,000 | $103 | 88 |
| 9080 Bloomfield Ave #237 | 0.00mi | 3/2.0 | 1,408 (+6%) | 4mo | $130,000 | $92 | 86 |
| 9080 Bloomfield Ave #22 | 0.00mi | 4/2.0 (+1) | 1,344 (+2%) | 10mo | $185,000 | $138 | 84 |
| 9080 Bloomfield Ave #193 | 0.00mi | 3/2.0 | 1,248 (-6%) | 10mo | $165,000 | $132 | 83 |
| 9080 Bloomfield Ave #122 | 0.00mi | 3/2.0 | 1,248 (-6%) | 10mo | $168,000 | $135 | 82 |
| 22221 Bloomfield Ave #47 | 0.26mi | 2/2.0 (-1) | 1,344 (+2%) | 1mo | $275,000 | $205 | 79 |
| 22221 Bloomfield #11 | 0.26mi | 2/2.0 (-1) | 1,344 (+2%) | 3mo | $200,000 | $149 | 78 |
| 9080 Bloomfield Ave #141 | 0.00mi | 4/2.0 (+1) | 1,431 (+8%) | 8mo | $155,000 | $108 | 74 |
| 9080 Bloomfield Ave #192 | 0.12mi | 3/2.0 | 1,434 (+8%) | 11mo | $218,000 | $152 | 71 |
| 9080 Bloomfield Ave #213 | 0.00mi | 3/2.0 | 1,170 (-12%) | 12mo | $185,000 | $158 | 71 |
| 9080 Bloomfield Ave #46 | 0.00mi | 4/2.0 (+1) | 1,440 (+9%) | 14mo | $190,000 | $132 | 69 |
Match score weights: distance 35% · size 25% · config 20% · recency 20%. Top-matched comps best support the ARV.
Projected returns pro-forma
-3.0% appreciation · 1.69% rent growth · sell at horizon
- IRR
- 29.9%
- Equity multiple
- 2.23×
- Total profit
- $65,430
- Equity at exit
- $28,330
- IRR
- 36.5%
- Equity multiple
- 4.17×
- Total profit
- $168,533
- Equity at exit
- $16,428
Cash invested: $53,200 (down + closing). Projections, not guarantees.
Landlord ↔ Tenant lean methodology
- Overall (STATE)
- 18 Strongly Tenant-Friendly
- State California
- 18 Strongly Tenant-Friendly · D+13
- County
- — inherits STATE
- City
- — inherits STATE
ZIP-level market 90630
- Rents YoY
- 1.7%
- Active inventory
- 70
- Price-to-rent
- 4.6×
Monthly cashflow live
- Estimated rent
- $3,465 high interval (Pro) →
- Mortgage (P&I)
- −$996
- Tax from tax record
- −$80 /mo · $955/yr
- Insurance
- −$79
- HOA
- −$0
- Vacancy / Maint / Mgmt
- −$728
- Net cashflow
- $1,582
Break-even live
UW: 25.0% down · 7.5% · 30yr · 1.5% tax · 5.0% vac · 8.0% maint · 8.0% mgmt
Financing live
Cash to close
- Down payment
- $47,500
- Closing costs
- $5,700
- Reserves months
- —
- Total cash needed
- —
Loan-product check · same deal, 3 products live
Conventional
25% down · 7.5% · 30yr
- Down + closing
- —
- Monthly P&I
- —
- Monthly cashflow
- —
- DSCR
- —
- Eligible?
- —
Personal DTI + credit; lowest rate.
DSCR
20% down · 8.5% · 30yr
- Down + closing
- —
- Monthly P&I
- —
- Monthly cashflow
- —
- DSCR
- —
- Eligible?
- —
No personal income docs; deal must DSCR.
Hard money
10% down · 12.0% · 12mo
- Down + closing
- —
- Monthly P&I
- —
- Monthly cashflow
- —
- DSCR
- —
- Eligible?
- —
Short-term bridge; refi at stabilization.
Rent comps 33 comps
| Address | Beds | Baths | Sqft | Rent | $/sqft | DOM | Units | Dist |
|---|---|---|---|---|---|---|---|---|
| 4455 Casa Grande Cir Cypress, CA | 1.0–2.0 | 1.0–1.5 | 811 | $2,837 | $3.50 | 1d | 6 | 0.20mi |
| 4550 Lincoln Ave Cypress, CA | 1.0–2.0 | 1.0–2.0 | 860 | $3,225 | $3.75 | 1d | 3 | 0.36mi |
| 8381 E Blithedale St Long Beach, CA | 3.0 | 2.0 | 1314 | $3,600 | $2.74 | 2d | 1 | 0.50mi |
| 12750 Centralia St Lakewood, CA | 2.0 | 1.0–1.5 | 1056 | $3,350 | $3.17 | 3d | 2 | 0.52mi |
| 12750 Centralia St #43 Lakewood, CA | 2.0 | 1.5 | 1056 | $3,500 | $3.31 | 17d | 1 | 0.55mi |
| 9424 Ethel St Cypress, CA | 3.0 | 2.5 | 1780 | $4,300 | $2.42 | 15d | 1 | 0.65mi |
| 9306 Gregory St Cypress, CA | 3.0 | 2.5 | 1840 | $4,500 | $2.45 | 18d | 1 | 0.66mi |
| 22003 Belshire Ave #9 Hawaiian Gardens, CA | 2.0 | 2.0 | 1140 | $2,900 | $2.54 | 43d | 1 | 0.66mi |
| 4801 Merten Ave Cypress, CA | 3.0 | 2.0 | 1500 | $3,875 | $2.58 | 1d | 1 | 0.70mi |
| 4812 Grace Ave Unit C Cypress, CA | 2.0 | 2.0 | 900 | $2,395 | $2.66 | 13d | 1 | 0.80mi |
| 8120 E Turbo St Long Beach, CA | 3.0 | 1.5 | 1120 | $3,900 | $3.48 | 43d | 1 | 0.81mi |
| 8561 Belmont St Unit 6 Cypress, CA | 3.0 | 2.5 | 1265 | $3,695 | $2.92 | 1d | 1 | 0.85mi |
| 8561 Belmont St Unit 7 Cypress, CA | 3.0 | 2.0 | 1320 | $4,145 | $3.14 | 10d | 1 | 0.85mi |
| 20817 Ely Ave Lakewood, CA | 3.0 | 1.0 | 1102 | $3,550 | $3.22 | 2d | 1 | 0.98mi |
| 21526 Juan Ave Hawaiian Gardens, CA | 2.0 | 2.0 | 1200 | $3,000 | $2.50 | 24d | 1 | 0.99mi |
| 4646 Larwin Ave Cypress, CA | 4.0 | 2.5 | 1562 | $3,800 | $2.43 | 1d | 1 | 1.01mi |
| 12050 226th St Hawaiian Gardens, CA | 3.0 | 2.0 | 1063 | $3,100 | $2.92 | 43d | 1 | 1.03mi |
| 12610 Vandemere St Lakewood, CA | 3.0 | 2.0 | 1056 | $8,250 | $7.81 | 1d | 1 | 1.05mi |
| 10403 Stratton Ct Cypress, CA | 4.0 | 2.5 | 1327 | $3,600 | $2.71 | 43d | 1 | 1.21mi |
| 12350 Del Amo Blvd Lakewood, CA | 1.0–3.0 | 1.0–2.0 | 866 | $3,173 | $3.66 | 2d | 27 | 1.24mi |
| 5475 Villa Way #34 Cypress, CA | 3.0 | 2.5 | 1374 | $3,600 | $2.62 | 2d | 1 | 1.24mi |
| 5477 Twin Lakes Dr Cypress, CA | 2.0 | 1.0 | 1156 | $2,495 | $2.16 | 1d | 1 | 1.25mi |
| 4002 Bryant Ct Cypress, CA | 3.0 | 1.5 | 1046 | $3,400 | $3.25 | 22d | 1 | 1.25mi |
| 10002 Saint Stephen Cir Cypress, CA | 3.0 | 1.5 | 1205 | $3,700 | $3.07 | 17d | 1 | 1.25mi |
| 5524 Camp St Cypress, CA | 4.0 | 3.0 | 1613 | $4,200 | $2.60 | 1d | 1 | 1.29mi |
| 8626 Watson St Unit 8650-E Cypress, CA | 2.0 | 1.0 | 900 | $2,350 | $2.61 | 10d | 1 | 1.29mi |
| 8626 Watson St Unit 8644 Cypress, CA | 2.0 | 1.0 | 900 | $2,450 | $2.72 | 1d | 1 | 1.29mi |
| 8791 Walker St Cypress, CA | 1.0–2.0 | 1.0 | 830 | $2,535 | $3.05 | 1d | 8 | 1.30mi |
| 12022 207th St Lakewood, CA | 3.0 | 2.0 | 1088 | $3,950 | $3.63 | 7d | 1 | 1.31mi |
| 12022 207th St Lakewood, CA | 3.0 | 2.0 | 1088 | $3,950 | $3.63 | 24d | 1 | 1.31mi |
| 21525 Pioneer Blvd Lakewood, CA | 2.0 | 2.0 | 910 | $2,595 | $2.85 | 43d | 1 | 1.37mi |
| 20726 Seine Ave Lakewood, CA | 3.0 | 2.0 | 1354 | $3,400 | $2.51 | 20d | 1 | 1.41mi |
| 20810 Arline Ave Apt 14 Lakewood, CA | 2.0 | 1.5 | 896 | $2,495 | $2.78 | 43d | 1 | 1.47mi |
Listing history 23 events
-
2026-06-18days on market $190,000 Active 80 DOM
-
2026-06-17days on market $190,000 Active 79 DOM
-
2026-06-16days on market $190,000 Active 78 DOM
-
2026-06-15days on market $190,000 Active 77 DOM
-
2026-06-13days on market $190,000 Active 75 DOM
-
2026-06-13days on market $190,000 Active 74 DOM
-
2026-06-09days on market $190,000 Active 71 DOM
-
2026-06-08days on market $190,000 Active 70 DOM
-
2026-06-07days on market $190,000 Active 69 DOM
-
2026-06-04days on market $190,000 Active 66 DOM
-
2026-06-03days on market $190,000 Active 65 DOM
-
2026-06-02days on market $190,000 Active 64 DOM
-
2026-06-01days on market $190,000 Active 63 DOM
-
2026-05-31days on market $190,000 Active 62 DOM
-
2026-03-30$190,000 Active
-
2026-02-10$190,000 Active
-
2025-01-12historical
-
2024-10-15price $179,900
-
2024-07-16$199,000 Active
-
2023-11-13historical
-
2023-05-17$209,000 Active
-
2023-03-20historical
-
2023-01-26$227,000 Active
ⓘ Source: listings_history table (triggers on properties + properties_extension) + one-shot
backfill from property_details.listing_events for pre-trigger history.
Tax reassessment forecast CA · Resets to sale price
- Current annual tax
- $955 · $80/mo
- Projected year-2 tax
- $1,444 · $120/mo
- Expected delta
- +$489/yr (+$41/mo · 51.3%)
ⓘ Screening estimate from a state-policy table — verify with the county assessor before closing.
Climate risk First Street
- Flood 1/10 Low FEMA zone X · 0% chance over 30 yrs
- Wildfire 1/10 Low
- Heat 5/10 Major 7 d/yr ≥89°F today · 24 d/yr by 30 yrs out
- Wind 1/10 Low
- Air quality 5/10 Major 7 unhealthy d/yr today · 9 by 30 yrs out
Nearby sold comps map
Loading sold comps map…
Walkable amenities ~0.75 mi
Loading nearby amenities…
Taxation est. · year 1
- Rental income
- $41,579
- − Mortgage interest
- −$10,643
- − Property taxes
- −$955
- − Insurance
- −$950
- − Repairs & maintenance
- −$3,326
- − Management
- −$3,326
- − Depreciation
- −$5,527
- Taxable income
- $16,852
- Est. tax owed @ 24.0%
- −$4,044
- After-tax cash flow
- $14,942/yr
For passive investors: Depreciation is non-cash, so a rental often shows a tax loss while cash-flowing — sheltering income. Rental losses are passive: they offset passive income freely, and up to $25,000/yr can offset ordinary (W-2) income if you actively participate and your MAGI is under $100k (phasing out to $0 by $150k); unused losses carry forward. On sale, claimed depreciation is recaptured at up to 25%, and gains may owe capital-gains tax (a 1031 exchange can defer both). Figures are a year-1 estimate at your 24.0% rate — not tax advice; consult a CPA.
Condition & rehab AI · 4 photos
This manufactured home requires moderate repairs and maintenance to improve its condition and value. Exterior siding and interior walls need significant attention, while the concrete porch shows visible wear. Painting and replacing the porch would significantly enhance its curb appeal and value.
Repairs flagged
- Major exterior siding — Significant wear and tear
- Major concrete porch — Visible cracks and wear
- Major interior walls — Peeling paint
Value-add opportunities
- Both Paint exterior siding — Enhances curb appeal and value
- Both Replace concrete porch — Improves durability and appearance
- Both Paint interior walls — Enhances interior appearance and value
Renovation cost estimate screening
| Repair item | Severity | Est. cost |
|---|---|---|
| exterior siding · Significant wear and tear | Major | $15,000–50,000 |
| concrete porch · Visible cracks and wear | Major | $15,000–50,000 |
| interior walls · Peeling paint | Major | $15,000–50,000 |
| Total estimated repair cost · 3 items | $45,000–150,000 |
Value-add ROI direction
- Both Paint exterior siding — Enhances curb appeal and value ↑
- Both Replace concrete porch — Improves durability and appearance ↑
- Both Paint interior walls — Enhances interior appearance and value ↑
ⓘ Cost ranges are severity-bucket heuristics (US national rule-of-thumb). Get contractor quotes + a written scope before underwriting a rehab budget.
Schools (NCES district)
- District
- Cypress Elementary
- NCES district ID
- 0610440
- Math proficiency
- 67% ▲ 1.00%
- Reading proficiency
- 69% ▲ 1.00%
- Median HH income
- $83,769
- Composite
- 62.21/100
- National rank
- #1446
- State rank
- #117 of 1400 in CA
Livability — Cypress
- Score
- 74/100
- State rank
- #141
- US rank
- #4900
Category grades
Schools grade is shown separately in the Schools card above.
Census & demographics
- Census place
- Cypress, CA
- County
- Orange County · 3,096,323 people
- City population
- 49,318
- Metro
- Los Angeles-Long Beach-Anaheim, CA
- Population (ZIP)
- 49,318
- Household income
- $130,154
- Rent vs Own
- Severe rent burden
- 1431.0
Population outlook (Orange County) Hauer SSP2
- Today (2025)
- 3,477,456 people
- By 2030
- 3,613,117 · +3.9%
- By 2040
- 3,835,945 · +10.3%
- By 2050
- 3,968,736 · +14.1%
- By 2075
- 4,097,053 · +17.8%
- By 2100
- 3,903,633 · +12.3%
Race, ethnicity, and origin ACS 2023
- Neighborhood character
- Highly diverse neighborhood (Simpson 0.71)
- Race & ethnicity
- Asian 37% White 31% Hispanic / Latino 22% Two or more races 14% Black 3%
- Hispanic origin (detail)
- Mexican 15%
- Common ancestry
- Lithuanian 2% Iranian 1% Italian 1%
- Foreign-born
- 31% · South Korea, Canada, China
- Languages at home
- 57% English-only · Spanish 12% Korean 11% Chinese 5%
Political lean MEDSL · Orange
- 2024 margin
- Toss-up / Even · D 49.7% · R 47.1% · Other 3.2%
- 2008→2024 swing
- +5.2pp toward D · 2008: -2.6pp · 2024: 2.6pp
- All cycles
- 2024: D+2.6 2020: D+9.0 2016: D+7.7 2012: R+8.3 2008: R+2.6
Not yet ingested
- Civics
- —
Market trends
- HPI YoY
- ▼ -870.99%
- Current HPI
- 402.6083
- Rent YoY
- ▲ 1.69%
- Metro
- Los Angeles-Long Beach-Anaheim, CA
- State GDP YoY
- ▲ 3.21%
- F500 in state
- 116
Industry mix (Fortune 500 HQ in CA)
| Industry | F500 HQs | Revenue |
|---|---|---|
| Technology | 27 | $1,492B |
|
||
| Financial Services | 3 | $174B |
|
||
| Retail | 3 | $44B |
|
||
| Insurance | 3 | $26B |
|
||
| Media / Entertainment | 2 | $115B |
|
||
| Pharmaceuticals / Biotech | 2 | $62B |
|
||
Price history
-16.3% since first listed9 events — show timeline
- 2026-03-30 Listed $190,000 CRMLS
- 2026-02-10 Listed $190,000 CRMLS
- 2025-01-12 Listing Removed — CRMLS
- 2024-10-15 Price Changed $179,900 CRMLS
- 2024-07-16 Listed $199,000 CRMLS
- 2023-11-13 Listing Removed — CRMLS
- 2023-05-17 Listed $209,000 CRMLS
- 2023-03-20 Listing Removed — CRMLS
- 2023-01-26 Listed $227,000 CRMLS
Property tax history
+1.2%/yrLatest (2025): $955 · +2.5% YoY. Source: county tax records.
Cash-flow waterfall
monthlySold comps — $/sqft
last 12 mo · ≤1 miLoading sold comps…