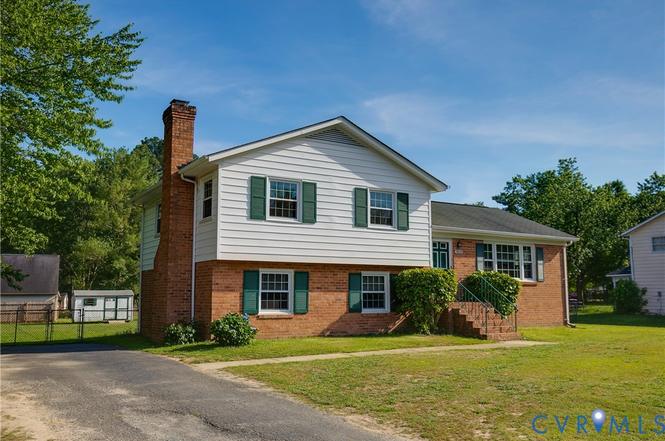
9275 Rappahannock Trl · Glen Allen, VA
Flood risk 1/10 · Minimal
- FEMA flood zone
- X (unshaded)
- Chance of flooding over 30 yrs
- 0.0%
- Est. flood insurance / yr
- $473 – $860
Fire risk 2/10 · Minimal
- Est. fire insurance / yr
- $666 – $1,236
Heat risk 8/10 · Major
- Hot days now (above 103°F)
- 7 days/yr
- Hot days in 30 yrs
- 17 days/yr
Wind risk 6/10 · Moderate
- Chance of severe wind over 30 yrs
- 27.0%
Air-quality risk 2/10 · Minimal
- Unhealthy air days now
- 0 days/yr
- Unhealthy air days in 30 yrs
- 1 days/yr
Risk factors via First Street. Map © Google.
Why this score? — see what drove the F grade
The composite is a weighted blend of 9 inputs, each scored 0–100. Each bar is that input's sub-score; the figure is the points it added to the 100-point composite (weight × sub-score).
- ARV discount +7.5/15.0
- Schools +7.0/10.0
- Cash flow +6.1/30.0
- Livability +3.8/5.0
- Rent growth +2.5/5.0
- Condition / age +2.5/5.0
- 1% rule +0.7/10.0
- DSCR +0.5/10.0
- Appreciation +0.0/10.0
$349,900
🖨 Deal sheet 📄 Offer letter ✓ Due diligence
Listing remarks
Well kept home on a flat lot in Atlee HS district! The property offers a great opportunity to get into the area with a generous 1800+ sq ft. Nice hardwood floors, replacement windows, and recent water heater (2023) ensure an easy next few years.
Key facts
- 0.48 acre lot
- Parking
- Built 1971
Property features AI
Exterior
- Parking: Driveway (unpaved)
- Utilities: Public water; Public sewer
- Home design: Single-story building; Resale property; R2 zoning
- Construction: Brick, frame and vinyl siding with drywall construction; Asphalt roof; Built (actual year provided but not specified)
- Exterior features: Unpaved driveway; Fenced yard (full)
Interior
- Kitchen: No kitchen appliance details provided
- Bedrooms: Total of 6 rooms (bedroom count not specified)
- Flooring: Wood
- Bathrooms: Two full bathrooms; One half bathroom (located in the basement); Second-floor full bath with tub and shower
- Heating & cooling: Heat pump and electric heating; Central air conditioning
- Interior features: Wood flooring; Partially finished basement (crawl space)
- Laundry & utility: Electric water heater
Neighborhood map
What this means for you Summary
Snapshot
- This is a 3-bed/2.5-bath single-family listed at $350k.
Deal economics
- At list price, monthly cash flow is $-648 ($-8k/yr) — negative.
- To cash-flow at today's rent, offer at most $236k (32.7% below list).
- To meet the 1% rule (rent ≥ 1% of price), the offer needs to be $200k (43.0% below list).
- Recommended offer: $200k (43.0% below list) — sets the bar for 1% rule.
Location & tenants
- Location reads 76/100 on livability (#108 in VA, #3,369 nationally) — a middle-class / working-renter tenant base. Strengths: schools A+, employment A+, housing A+; Watch: amenities F, commute F.
- Hanover County Public School District (suburban): math 79% / reading 81% proficiency, ranked #5 of 131 in VA (top 4%) — strong family-tenant draw, lease renewals of 3-5y typical; only 15% free/reduced lunch — higher-income household profile.
- Market conditions: 204 active listings in the ZIP; solid renter incomes; 447 units permitted in Hanover County in 2024 (0 in 5+ unit buildings).
Forward outlook
- Local home prices are declining (-3.0%/yr); year-one equity from $2k of loan paydown is wiped out by about $10k of value loss. Plan a longer hold.
- Hanover County population projected at +11% by 2050 — modest demand growth; plan on rents tracking national, not racing it.
Negotiation context
- Only 2 days on market — expect competitive offers; lowballing is unlikely to land.
- 3 sale attempts since 2y ago with the ask held roughly flat each time — persistent listings suggest the price (not the market) is what's stuck; bring a comps-based counter.
- Current owner paid $218k; list at $350k implies a 61% gain — meaningful room to come down on a strong offer.
Risks & watch-outs
- Climate carrying-cost: major wind risk, 27% chance of damaging wind over 30y; extreme-heat days projected 7→17/yr by 2055 (HVAC capex compounding) — expect insurance premiums to compound above CPI over the hold.
Questions for the listing agent
- What do current leases actually rent for vs. the listed asking? Can we see a recent rent roll and the last 12 months of T-12 income?
- Built in 1971 — when were the roof, HVAC, electrical panel, plumbing, and water heater last replaced?
- Is there a deadline driving the sale (1031 exchange, divorce, estate, relocation)? That informs how much negotiation room exists.
- Schools are A-rated — typically a magnet for longer-tenancy family renters. What's the average tenant stay here, and is there a school-zone premium baked into asking?
- The area grade is low — what's the realistic commute time and amenity access for the typical tenant pool here? Any planned neighborhood developments (good or bad) we should know about?
- What's the average days-on-market for RENTAL listings here right now (not sales)? A rising rental-DOM trend means longer vacancies and softer asking-rent achievability than the comps imply.
- What's the recent tenant-quality profile in this submarket — average credit score on applications, eviction rate, late-payment / NSF rate, and stable-employment percentage? A property-management company in the area should have these aggregated.
- How much new for-sale + rental construction is in the pipeline within 1–3 miles? Heavy new supply typically softens prices + rents 12–24 months out; constrained supply supports both.
Investment metrics
- 1% rule
- 0.57% ✗
- Cap rate
- 4.07%
- Cash-on-cash
- -7.93%
- DSCR
- 0.65
- GRM
- 14.6
CMA / ARV
- ARV (on-the-fly)
- $350,064
- Comps found
- 6
Show comp detail 6 sales within ~0.75 mi
| Address | Dist | Beds/Ba | Sqft | Sold | Price | $/sf | Match |
|---|---|---|---|---|---|---|---|
| 9268 Monongahela Trl | 0.25mi | 3/2.0 | 1,300 (+6%) | 18mo | $339,950 | $262 | 61 |
| 10198 Guenevere Ct | 0.55mi | 3/3.0 | 1,243 (+2%) | 18mo | $385,000 | $310 | 55 |
| 10430 Rapidan Way | 0.32mi | 3/2.0 | 1,104 (-10%) | 18mo | $327,000 | $296 | 51 |
| 10326 Wanchese Way | 0.34mi | 4/2.0 (+1) | 1,296 (+6%) | 22mo | $365,000 | $282 | 49 |
| 9421 Aynhoe Ln | 0.59mi | 3/2.5 | 1,400 (+14%) | 9mo | $400,000 | $286 | 41 |
| 9251 Ivy Banks Dr | 0.74mi | 3/2.0 | 1,358 (+11%) | 19mo | $350,000 | $258 | 30 |
Match score weights: distance 35% · size 25% · config 20% · recency 20%. Top-matched comps best support the ARV.
Projected returns pro-forma
-3.0% appreciation · 3.0% rent growth · sell at horizon
- IRR
- -30.3%
- Equity multiple
- -0.00×
- Total profit
- $-98,033
- Equity at exit
- $52,171
- IRR
- -32.3%
- Equity multiple
- -0.42×
- Total profit
- $-138,836
- Equity at exit
- $30,253
Cash invested: $97,972 (down + closing). Projections, not guarantees.
Landlord ↔ Tenant lean methodology
- Overall (STATE)
- 55 Moderately Landlord-Leaning
- State Virginia
- 55 Moderately Landlord-Leaning · D+2
- County
- — inherits STATE
- City
- — inherits STATE
ZIP-level market 23005
- Home prices YoY
- -31.5%
- Active inventory
- 204
- Price-to-rent
- 14.6×
Monthly cashflow live
- Estimated rent
- $1,996 medium interval (Pro) →
- Mortgage (P&I)
- −$1,835
- Tax from tax record
- −$243 /mo · $2,922/yr
- Insurance
- −$146
- HOA
- −$0
- Vacancy / Maint / Mgmt
- −$419
- Net cashflow
- $-648
Break-even live
UW: 25.0% down · 7.5% · 30yr · 1.5% tax · 5.0% vac · 8.0% maint · 8.0% mgmt
Financing live
Cash to close
- Down payment
- $87,475
- Closing costs
- $10,497
- Reserves months
- —
- Total cash needed
- —
Loan-product check · same deal, 3 products live
Conventional
25% down · 7.5% · 30yr
- Down + closing
- —
- Monthly P&I
- —
- Monthly cashflow
- —
- DSCR
- —
- Eligible?
- —
Personal DTI + credit; lowest rate.
DSCR
20% down · 8.5% · 30yr
- Down + closing
- —
- Monthly P&I
- —
- Monthly cashflow
- —
- DSCR
- —
- Eligible?
- —
No personal income docs; deal must DSCR.
Hard money
10% down · 12.0% · 12mo
- Down + closing
- —
- Monthly P&I
- —
- Monthly cashflow
- —
- DSCR
- —
- Eligible?
- —
Short-term bridge; refi at stabilization.
Listing history 4 events
-
2026-06-15status $349,900 Pending 2 DOM
-
2026-06-13days on market $349,900 Active 2 DOM
-
2026-06-13remarks 245-char remark
-
2026-06-13$349,900 Active 1 DOM
ⓘ Source: listings_history table (triggers on properties + properties_extension) + one-shot
backfill from property_details.listing_events for pre-trigger history.
Tax reassessment forecast VA · Resets to sale price
- Current annual tax
- $2,922 · $243/mo
- Projected year-2 tax
- $2,922 · $243/mo
- Expected delta
- $0/yr ($0/mo · 0.0%)
ⓘ Screening estimate from a state-policy table — verify with the county assessor before closing.
Climate risk First Street
- Flood 1/10 Low FEMA zone X (unshaded) · 0% chance over 30 yrs
- Wildfire 2/10 Low
- Heat 8/10 Severe 7 d/yr ≥103°F today · 17 d/yr by 30 yrs out
- Wind 6/10 Major 27% chance of damaging wind over 30 yrs
- Air quality 2/10 Low 0 unhealthy d/yr today · 1 by 30 yrs out
Nearby sold comps map
Loading sold comps map…
Walkable amenities ~0.75 mi
Loading nearby amenities…
Taxation est. · year 1
- Rental income
- $23,948
- − Mortgage interest
- −$19,600
- − Property taxes
- −$2,922
- − Insurance
- −$1,750
- − Repairs & maintenance
- −$1,916
- − Management
- −$1,916
- − Depreciation
- −$10,179
- Taxable loss
- −$14,333
- Est. tax savings @ 24.0%
- +$3,440
- After-tax cash flow
- $-4,331/yr
For passive investors: Depreciation is non-cash, so a rental often shows a tax loss while cash-flowing — sheltering income. Rental losses are passive: they offset passive income freely, and up to $25,000/yr can offset ordinary (W-2) income if you actively participate and your MAGI is under $100k (phasing out to $0 by $150k); unused losses carry forward. On sale, claimed depreciation is recaptured at up to 25%, and gains may owe capital-gains tax (a 1031 exchange can defer both). Figures are a year-1 estimate at your 24.0% rate — not tax advice; consult a CPA.
Schools (NCES district)
- District
- Hanover County Public School District
- NCES district ID
- 5101830
- Math proficiency
- 79% ▼ -11.00%
- Reading proficiency
- 81% ▼ -3.00%
- Median HH income
- $78,386
- Composite
- 70.37/100
- National rank
- #268
- State rank
- #5 of 131 in VA
Livability — Glen Allen
- Score
- 76/100
- State rank
- #108
- US rank
- #3369
Category grades
Schools grade is shown separately in the Schools card above.
Census & demographics
- County
- Hanover County · 134,767 people
- City population
- 79,019
- Metro
- Richmond, VA
- Population (ZIP)
- 19,987
- Household income
- $89,335
- Rent vs Own
- Severe rent burden
- 416.0
Population outlook (Hanover County) Hauer SSP2
- Today (2025)
- 111,687 people
- By 2030
- 115,373 · +3.3%
- By 2040
- 120,828 · +8.2%
- By 2050
- 123,591 · +10.7%
- By 2075
- 132,168 · +18.3%
- By 2100
- 130,105 · +16.5%
Race, ethnicity, and origin ACS 2023
- Neighborhood character
- Predominantly White (76%)
- Race & ethnicity
- White 76% Black 13% Hispanic / Latino 6% Two or more races 5% Asian 1%
- Hispanic origin (detail)
- Mexican 2%
- Common ancestry
- Slovak 3% Italian 2% Romanian 2%
- Foreign-born
- 5% · Canada, Jamaica, China
- Languages at home
- 93% English-only · Spanish 5% Other Indo-European 1% Arabic 1%
Political lean MEDSL · Hanover
- 2024 margin
- Strong R (+25.8) · D 36.6% · R 62.4% · Other 1.1%
- 2008→2024 swing
- +7.8pp toward D · 2008: -33.6pp · 2024: -25.8pp
- All cycles
- 2024: R+25.8 2020: R+26.8 2016: R+32.5 2012: R+36.7 2008: R+33.6
Not yet ingested
- Civics
- —
Market trends
- HPI YoY
- ▼ -118.63%
- Current HPI
- 257.9445
- Rent YoY
- —
- Metro
- Richmond, VA
- State GDP YoY
- ▲ 2.40%
- F500 in state
- 50
Industry mix (Fortune 500 HQ in VA)
| Industry | F500 HQs | Revenue |
|---|---|---|
| Aerospace / Defense | 4 | $236B |
|
||
| Technology / Defense | 3 | $32B |
|
||
| Financial Services | 2 | $176B |
|
||
| Utilities | 2 | $27B |
|
||
| Insurance | 2 | $25B |
|
||
| Technology | 2 | $15B |
|
||
Price history
+60.5% since first listed7 events — show timeline
- 2026-06-11 Listed $349,900 CVRMLS
- 2024-12-13 Rental Removed $2,295 RENTALBEAST
- 2024-11-27 Listed for Rent $2,295 RENTALBEAST
- 2024-11-17 Rental Removed $2,295 RENTALBEAST
- 2024-09-17 Listed for Rent $2,295 RENTALBEAST
- 2022-05-19 Price Changed $1,995 RENT.
- 2022-02-10 Sold (Public Records) $218,000 Public Records
Property tax history
+12.8%/yrLatest (2026): $2,922 · +11.7% YoY. Source: county tax records.
Cash-flow waterfall
monthlySold comps — $/sqft
last 12 mo · ≤1 miLoading sold comps…