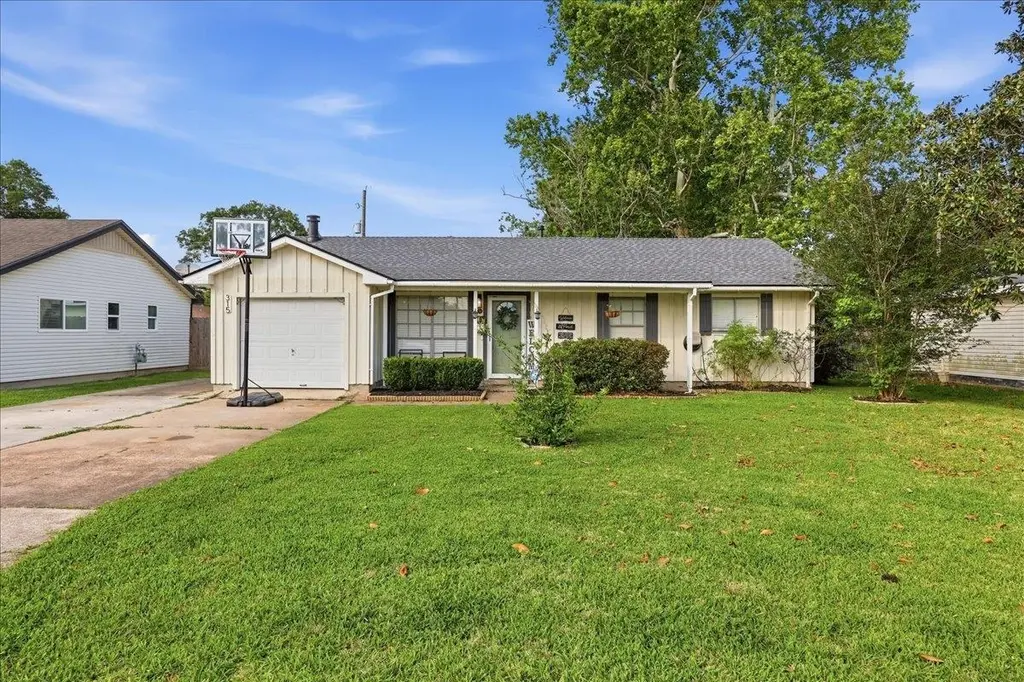
315 S 1 1/2 St · Nederland, TX
Flood risk 8/10 · Major
- FEMA flood zone
- X
- Chance of flooding over 30 yrs
- 0.99%
- Est. flood insurance / yr
- $507 – $1,088
Fire risk 1/10 · Minimal
- Est. fire insurance / yr
- $1,222 – $2,270
Heat risk 9/10 · Severe
- Hot days now (above 109°F)
- 7 days/yr
- Hot days in 30 yrs
- 25 days/yr
Wind risk 9/10 · Severe
- Chance of severe wind over 30 yrs
- 99.0%
Air-quality risk 2/10 · Minimal
- Unhealthy air days now
- 1 days/yr
- Unhealthy air days in 30 yrs
- 1 days/yr
Risk factors via First Street. Map © Google.
Why this score? — see what drove the D grade
The composite is a weighted blend of 9 inputs, each scored 0–100. Each bar is that input's sub-score; the figure is the points it added to the 100-point composite (weight × sub-score).
- Cash flow +14.2/30.0
- Rent growth +4.8/5.0
- Schools +4.5/10.0
- DSCR +4.3/10.0
- 1% rule +4.2/10.0
- Livability +3.8/5.0
- ARV discount +3.1/15.0
- Condition / age +2.5/5.0
- Appreciation +0.0/10.0
$195,000
🖨 Deal sheet (PDF) 📄 Offer letter ✓ Due diligence
Listing remarks MLS
This charming 3-bed, 1.5-bath home in the Nederland ISD is ready for its next chapter! With updates throughout, the main living area invites you to create your own retreat. The kitchen and breakfast room are perfect for whipping up and enjoying your favorite recipes. Venture to the fenced backyard, complete with a covered patio, offering an ideal spot for relaxation. As an added bonus, there's a rainwater system for convenient water collection. Don't miss the opportunity to make this Nederland home your own - give us a call today!
Key facts
- New stove
- New vent hood
- New water heater
Tags
Property features AI
Exterior
- Security: Smoke detector(s)
- Utilities: Public water; Public sewer
- Home design: Single family residence; Single-story
- Construction: Composition roof; Slab foundation
- Exterior features: Covered patio/porch; On-site storage structure
Interior
- Kitchen: Dishwasher; Range; Garbage disposal
- Bathrooms: 1 full bathroom; 1 half bathroom
- Heating & cooling: Central heating; Natural gas heating; Wood stove; Central air; Ceiling fan(s)
- Interior features: Dishwasher; Range; Garbage disposal
Neighborhood map
What this means for you Summary
Snapshot
- This is a 4-bed/1.5-bath single-family listed at $195k.
Deal economics
- At list price, monthly cash flow is $-33 ($-391/yr) — negative.
- To cash-flow at today's rent, offer at most $189k (2.9% below list).
- To meet the 1% rule (rent ≥ 1% of price), the offer needs to be $179k (8.0% below list).
- Recommended offer: $179k (8.0% below list) — sets the bar for 1% rule.
- Cap rate 6.5% vs local median 4.6% in Nederland — top-decile yield for the area; either an underpriced asset or a hidden risk that comps aren't pricing in. Stress-test before assuming the spread holds.
Location & tenants
- Location reads 75/100 on livability (#129 in TX, #3,906 nationally) — a middle-class / working-renter tenant base. Strengths: employment A+, cost of living A+, housing A+; Watch: amenities F, commute F.
- Nederland ISD (suburban): math 51% / reading 52% proficiency, ranked #138 of 826 in TX (top 17%) — acceptable for families but not a draw, mixed tenant base, ~2y average lease.
- Zoned schools: Highland Park El (math 52% / reading 52%, grade C-, #742 of 4,322 statewide, top 19%, 432 students, 54% FRL); Central Middle (math 42% / reading 47%, grade D, #491 of 1,662 statewide, top 31%, 721 students, 55% FRL); Nederland H S (math 49% / reading 61%, grade C, #373 of 1,632 statewide, top 23%, 1,439 students, 47% FRL).
- Market conditions: Rents rising fast (+9.3%/yr); 111 active listings in the ZIP; 5 comparable units currently listed for rent nearby; rentals at typical pace (median 16d on market — plan ~3-4 weeks tenant-placement turnaround); solid renter incomes; 343 units permitted in Jefferson County in 2024 (0 in 5+ unit buildings).
Forward outlook
- Local home prices are declining (-3.0%/yr); year-one equity from $1k of loan paydown is wiped out by about $6k of value loss. Plan a longer hold.
Negotiation context
- Only 3 days on market — expect competitive offers; lowballing is unlikely to land.
- 3 sale attempts since 8y ago with the ask held roughly flat each time — persistent listings suggest the price (not the market) is what's stuck; bring a comps-based counter.
Risks & watch-outs
- Watch-outs: flood insurance adds $66/mo.
- Climate carrying-cost: severe flood risk; severe wind risk, 99% chance of damaging wind over 30y; extreme-heat days projected 7→25/yr by 2055 (HVAC capex compounding) — expect insurance premiums to compound above CPI over the hold.
Questions for the listing agent
- What do current leases actually rent for vs. the listed asking? Can we see a recent rent roll and the last 12 months of T-12 income?
- Built in 1962 — when were the roof, HVAC, electrical panel, plumbing, and water heater last replaced?
- What's the actual annual flood-insurance premium (NFIP or private), and is the property in a SFHA with mandatory coverage?
- Is there a deadline driving the sale (1031 exchange, divorce, estate, relocation)? That informs how much negotiation room exists.
- Schools are A-rated — typically a magnet for longer-tenancy family renters. What's the average tenant stay here, and is there a school-zone premium baked into asking?
- The area grade is low — what's the realistic commute time and amenity access for the typical tenant pool here? Any planned neighborhood developments (good or bad) we should know about?
- What's the average days-on-market for RENTAL listings here right now (not sales)? A rising rental-DOM trend means longer vacancies and softer asking-rent achievability than the comps imply.
- What's the recent tenant-quality profile in this submarket — average credit score on applications, eviction rate, late-payment / NSF rate, and stable-employment percentage? A property-management company in the area should have these aggregated.
- How much new for-sale + rental construction is in the pipeline within 1–3 miles? Heavy new supply typically softens prices + rents 12–24 months out; constrained supply supports both.
Investment metrics
- 1% rule
- 0.92% ✗
- Cap rate
- 6.50%
- Cash-on-cash
- 0.75%
- DSCR
- 1.03
- GRM
- 9.1
CMA / ARV
- ARV (on-the-fly)
- $177,552
- Comps found
- 8
Show comp detail 8 sales within ~0.75 mi
| Address | Dist | Beds/Ba | Sqft | Sold | Price | $/sf | Match |
|---|---|---|---|---|---|---|---|
| 108 S 2nd 1/2 St | 0.21mi | 3/1.5 (-1) | 1,256 (-3%) | 3mo | $210,000 | $167 | 78 |
| 412 S 4th 1/2 St | 0.32mi | 4/2.0 | 1,368 (+6%) | 3mo | $164,900 | $121 | 72 |
| 307 S 3rd St | 0.18mi | 4/2.0 | 1,368 (+6%) | 18mo | $160,000 | $117 | 65 |
| 720 S 2nd St | 0.29mi | 3/1.0 (-1) | 1,233 (-5%) | 9mo | $175,000 | $142 | 64 |
| 116 S 4th 1/2 St | 0.33mi | 3/2.0 (-1) | 1,352 (+4%) | 14mo | $169,900 | $126 | 58 |
| 204 S 2 1/2 St | 0.11mi | 3/1.0 (-1) | 1,406 (+8%) | 19mo | $192,500 | $137 | 58 |
| 211 S 5 1/2 St | 0.41mi | 3/2.5 (-1) | 1,425 (+10%) | 11mo | $265,000 | $186 | 46 |
| 623 S 8th St | 0.60mi | 3/2.0 (-1) | 1,384 (+7%) | 10mo | $178,500 | $129 | 45 |
Match score weights: distance 35% · size 25% · config 20% · recency 20%. Top-matched comps best support the ARV.
Projected returns pro-forma
-3.0% appreciation · 8.0% rent growth · sell at horizon
- IRR
- -11.6%
- Equity multiple
- 0.56×
- Total profit
- $-24,103
- Equity at exit
- $29,075
- IRR
- 4.0%
- Equity multiple
- 1.36×
- Total profit
- $19,852
- Equity at exit
- $16,860
Cash invested: $54,600 (down + closing). Projections, not guarantees.
Landlord ↔ Tenant lean methodology
- Overall (STATE)
- 87 Strongly Landlord-Friendly
- State Texas
- 87 Strongly Landlord-Friendly · R+5
- County
- — inherits STATE
- City
- — inherits STATE
ZIP-level market 77627
- Rents YoY
- 9.3%
- Active inventory
- 111
- Price-to-rent
- 9.1×
Monthly cashflow live
- Estimated rent
- $1,794 high interval (Pro) →
- Mortgage (P&I)
- −$1,023
- Tax from tax record
- −$279 /mo · $3,352/yr
- Insurance
- −$81
- Flood insurance flood zone
- −$66 /mo · $798/yr
- HOA
- −$0
- Vacancy / Maint / Mgmt
- −$377
- Net cashflow
- $-33
Break-even live
Sensitivity live
| Price | -10% $78 | -5% $23 | +0% $-33 | +5% $-88 | +10% $-143 |
|---|---|---|---|---|---|
| Rent | -10% $-174 | -5% $-103 | +0% $-33 | +5% $38 | +10% $109 |
| Rate | -1.0pp $66 | -0.5pp $17 | base $-33 | +0.5pp $-83 | +1.0pp $-134 |
UW: 25.0% down · 7.5% · 30yr · 1.5% tax · 5.0% vac · 8.0% maint · 8.0% mgmt
Financing live
Cash to close
- Down payment
- $48,750
- Closing costs
- $5,850
- Reserves months
- —
- Total cash needed
- —
Loan-product check · same deal, 3 products live
Conventional
25% down · 7.5% · 30yr
- Down + closing
- —
- Monthly P&I
- —
- Monthly cashflow
- —
- DSCR
- —
- Eligible?
- —
Personal DTI + credit; lowest rate.
DSCR
20% down · 8.5% · 30yr
- Down + closing
- —
- Monthly P&I
- —
- Monthly cashflow
- —
- DSCR
- —
- Eligible?
- —
No personal income docs; deal must DSCR.
Hard money
10% down · 12.0% · 12mo
- Down + closing
- —
- Monthly P&I
- —
- Monthly cashflow
- —
- DSCR
- —
- Eligible?
- —
Short-term bridge; refi at stabilization.
Rent comps 5 comps
| Address | Beds | Baths | Sqft | Rent | $/sqft | DOM | Units | Dist |
|---|---|---|---|---|---|---|---|---|
| 608 S 2nd St Nederland, TX | 3.0 | 1.0 | 936 | $1,600 | $1.71 | 15d | 1 | 0.17mi |
| 304 Avenue E Nederland, TX | 3.0 | 2.0 | 1511 | $1,900 | $1.26 | 15d | 1 | 0.22mi |
| 311 Nederland Ave Nederland, TX | 3.0 | 2.0 | 1360 | $1,890 | $1.39 | 15d | 1 | 0.27mi |
| 812 S 6th St Nederland, TX | 3.0 | 1.0 | 996 | $1,500 | $1.51 | 15d | 1 | 0.55mi |
| 1619 Avenue G Unit G Nederland, TX | 3.0 | 1.5 | 1100 | $1,750 | $1.59 | 25d | 1 | 1.39mi |
Listing history 10 events
-
2026-04-30status Pending
-
2026-04-28$195,000 Active
-
2024-09-30soldstatus
-
2024-09-26soldstatus Closed 536-char remark
Show marketing remark (536 chars)
This charming 3-bed, 1.5-bath home in the Nederland ISD is ready for its next chapter! With updates throughout, the main living area invites you to create your own retreat. The kitchen and breakfast room are perfect for whipping up and enjoying your favorite recipes. Venture to the fenced backyard, complete with a covered patio, offering an ideal spot for relaxation. As an added bonus, there's a rainwater system for convenient water collection. Don't miss the opportunity to make this Nederland home your own - give us a call today!
-
2024-08-19status Pending 536-char remark
Show marketing remark (536 chars)
This charming 3-bed, 1.5-bath home in the Nederland ISD is ready for its next chapter! With updates throughout, the main living area invites you to create your own retreat. The kitchen and breakfast room are perfect for whipping up and enjoying your favorite recipes. Venture to the fenced backyard, complete with a covered patio, offering an ideal spot for relaxation. As an added bonus, there's a rainwater system for convenient water collection. Don't miss the opportunity to make this Nederland home your own - give us a call today!
-
2024-07-31$165,000 Active 536-char remark
Show marketing remark (536 chars)
This charming 3-bed, 1.5-bath home in the Nederland ISD is ready for its next chapter! With updates throughout, the main living area invites you to create your own retreat. The kitchen and breakfast room are perfect for whipping up and enjoying your favorite recipes. Venture to the fenced backyard, complete with a covered patio, offering an ideal spot for relaxation. As an added bonus, there's a rainwater system for convenient water collection. Don't miss the opportunity to make this Nederland home your own - give us a call today!
-
2024-07-30price $165,000
-
2018-04-24soldstatus
-
2018-04-23soldstatus
-
2018-03-14$109,900
ⓘ Source: listings_history table (triggers on properties + properties_extension) + one-shot
backfill from property_details.listing_events for pre-trigger history.
Tax reassessment forecast TX · Resets to sale price
- Current annual tax
- $3,352 · $279/mo
- Projected year-2 tax
- $3,568 · $297/mo
- Expected delta
- +$217/yr (+$18/mo · 6.5%)
ⓘ Screening estimate from a state-policy table — verify with the county assessor before closing.
Climate risk First Street
- Flood 8/10 Severe FEMA zone X · 99% chance over 30 yrs
- Wildfire 1/10 Low
- Heat 9/10 Extreme 7 d/yr ≥109°F today · 25 d/yr by 30 yrs out
- Wind 9/10 Extreme 99% chance of damaging wind over 30 yrs
- Air quality 2/10 Low 1 unhealthy d/yr today · 1 by 30 yrs out
Nearby sold comps map
Loading sold comps map…
Walkable amenities ~0.75 mi
Loading nearby amenities…
Taxation est. · year 1
- Rental income
- $21,525
- − Mortgage interest
- −$10,923
- − Property taxes
- −$3,352
- − Insurance
- −$1,772
- − Repairs & maintenance
- −$1,722
- − Management
- −$1,722
- − Depreciation
- −$5,673
- Taxable loss
- −$3,639
- Est. tax savings @ 24.0%
- +$873
- After-tax cash flow
- $483/yr
For passive investors: Depreciation is non-cash, so a rental often shows a tax loss while cash-flowing — sheltering income. Rental losses are passive: they offset passive income freely, and up to $25,000/yr can offset ordinary (W-2) income if you actively participate and your MAGI is under $100k (phasing out to $0 by $150k); unused losses carry forward. On sale, claimed depreciation is recaptured at up to 25%, and gains may owe capital-gains tax (a 1031 exchange can defer both). Figures are a year-1 estimate at your 24.0% rate — not tax advice; consult a CPA.
Schools (NCES district)
- District
- Nederland ISD
- NCES district ID
- 4832280
- Math proficiency
- 51% ▼ -3.00%
- Reading proficiency
- 52% ▼ -3.00%
- Median HH income
- $59,647
- Composite
- 44.95/100
- National rank
- #2709
- State rank
- #138 of 826 in TX
Livability — Nederland
- Score
- 75/100
- State rank
- #129
- US rank
- #3906
Category grades
Schools grade is shown separately in the Schools card above.
Census & demographics
- Census place
- Nederland, TX
- County
- Jefferson County · 203,592 people
- City population
- 22,357
- Metro
- Beaumont-Port Arthur, TX
- Population (ZIP)
- 22,357
- Household income
- $78,001
- Rent vs Own
- Severe rent burden
- 572.0
Population outlook (Jefferson County) Hauer SSP2
- Today (2025)
- 259,015 people
- By 2030
- 260,685 · +0.6%
- By 2040
- 263,309 · +1.7%
- By 2050
- 265,237 · +2.4%
- By 2075
- 270,193 · +4.3%
- By 2100
- 255,628 · -1.3%
Race, ethnicity, and origin ACS 2023
- Neighborhood character
- Predominantly White (78%)
- Race & ethnicity
- White 78% Hispanic / Latino 12% Two or more races 8% Black 4% Asian 3%
- Hispanic origin (detail)
- Mexican 8%
- Common ancestry
- Lithuanian 10% Slovak 3% Italian 2%
- Foreign-born
- 5% · Canada, Vietnam
- Languages at home
- 87% English-only · Spanish 8% Other Indo-European 1% Vietnamese 1%
Political lean MEDSL · Jefferson
- 2024 margin
- Lean R (+8.9) · D 45.1% · R 54.0%
- 2008→2024 swing
- -11.1pp toward R · 2008: 2.2pp · 2024: -8.9pp
- All cycles
- 2024: R+8.9 2020: R+1.6 2016: R+0.5 2012: D+1.6 2008: D+2.2
Not yet ingested
- Civics
- —
Market trends
- HPI YoY
- ▼ -228.91%
- Current HPI
- 176.2132
- Rent YoY
- ▲ 9.27%
- Metro
- Beaumont-Port Arthur, TX
- State GDP YoY
- ▲ 3.95%
- F500 in state
- 110
Industry mix (Fortune 500 HQ in TX)
| Industry | F500 HQs | Revenue |
|---|---|---|
| Energy | 16 | $1,198B |
|
||
| Technology | 5 | $198B |
|
||
| Engineering / Construction | 4 | $72B |
|
||
| Energy Services | 3 | $60B |
|
||
| Utilities | 3 | $41B |
|
||
| Healthcare | 2 | $330B |
|
||
Price history
+77.4% since first listed10 events — show timeline
- 2026-04-30 Pending — BBOR
- 2026-04-28 Listed $195,000 BBOR
- 2024-09-30 Sold (Public Records) — Public Records
- 2024-09-26 Sold (MLS) — BBOR
- 2024-08-19 Pending — BBOR
- 2024-07-31 Listed $165,000 BBOR
- 2024-07-30 Price Changed $165,000 BBOR
- 2018-04-24 Sold (Public Records) — Public Records
- 2018-04-23 Sold (MLS) — BBOR
- 2018-03-14 Listed $109,900 BBOR
Property tax history
+4.4%/yrLatest (2025): $3,352 · +6.4% YoY. Source: county tax records.
Cash-flow waterfall
monthlySold comps — $/sqft
last 12 mo · ≤1 miLoading sold comps…