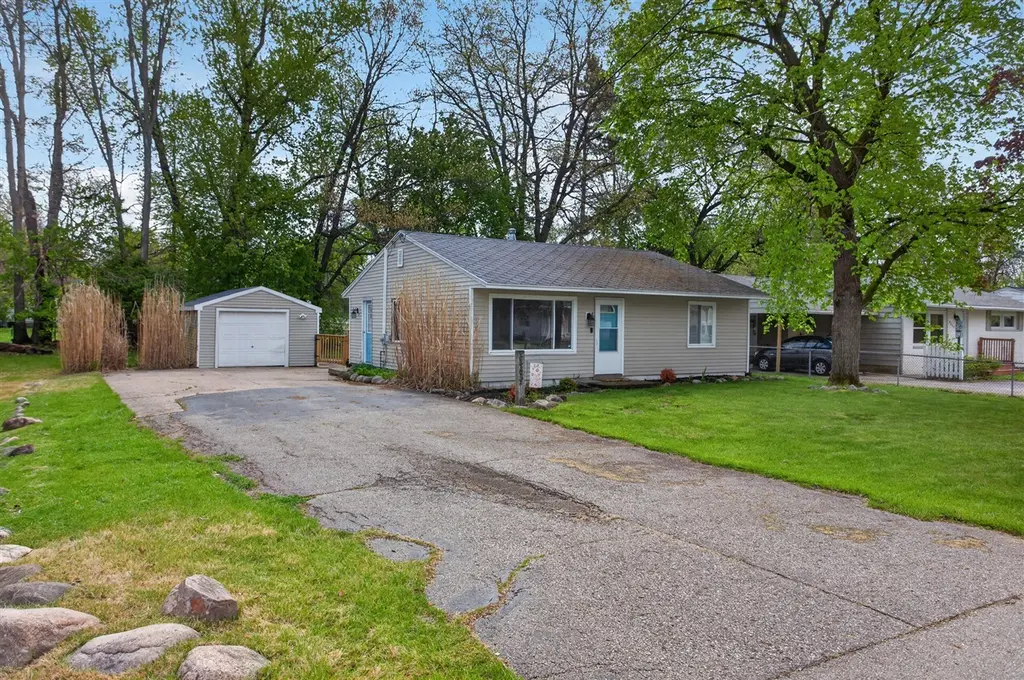
3455 Acacia Blvd · Jackson, MI
Flood risk 1/10 · Minimal
- FEMA flood zone
- X (unshaded)
- Chance of flooding over 30 yrs
- 0.0%
- Est. flood insurance / yr
- $507 – $1,088
Fire risk 3/10 · Minor
- Est. fire insurance / yr
- $784 – $1,456
Heat risk 3/10 · Minor
- Hot days now (above 98°F)
- 7 days/yr
- Hot days in 30 yrs
- 15 days/yr
Wind risk 2/10 · Minimal
- Chance of severe wind over 30 yrs
- —
Air-quality risk 2/10 · Minimal
- Unhealthy air days now
- 1 days/yr
- Unhealthy air days in 30 yrs
- 1 days/yr
Risk factors via First Street. Map © Google.
Why this score? — see what drove the D grade
The composite is a weighted blend of 9 inputs, each scored 0–100. Each bar is that input's sub-score; the figure is the points it added to the 100-point composite (weight × sub-score).
- Cash flow +12.9/30.0
- ARV discount +8.9/15.0
- Rent growth +4.4/5.0
- DSCR +3.9/10.0
- Livability +3.7/5.0
- 1% rule +3.2/10.0
- Condition / age +2.5/5.0
- Schools +1.8/10.0
- Appreciation +0.0/10.0
$174,900
🖨 Deal sheet (PDF) 📄 Offer letter ✓ Due diligence
Listing remarks MLS
Here's your opportunity to move to Summit Township - This 3 bedroom 1 bath bungalow offers a large open living room with updated flooring and paint, updated kitchen with appliance package included and door to your private deck, main floor primary bedroom, 2 additional bedrooms, main floor laundry, and updated full bath with custom tile shower/tub combo. Exterior features a 1 car detached garage, extra lot included in price, private wooded backyard perfect for summer nights! Don't miss this great opportunity!
Key facts
- Private deck
- Open living room
- Main floor laundry
Tags
Property features AI
Exterior
- Parking: Detached garage (1 car)
- Utilities: Public water
- Home design: Single-family residence; Residential property; Built in 1955
- Construction: Vinyl siding; Shingle roof
- Exterior features: Paved road access; Lot approximately 0.32 acres
Interior
- Kitchen: Dishwasher; Range; Refrigerator
- Bathrooms: One full bathroom
- Heating & cooling: Forced air heating; Has cooling
- Interior features: Six total rooms; Basement is slab
- Laundry & utility: Washer; Dryer; Natural gas water heater
Neighborhood map
What this means for you Summary
Snapshot
- This is a 3-bed/1.0-bath single-family listed at $175k.
Deal economics
- At list price, monthly cash flow is $-13 ($-156/yr) — negative.
- To cash-flow at today's rent, offer at most $173k (1.3% below list).
- To meet the 1% rule (rent ≥ 1% of price), the offer needs to be $144k (17.7% below list).
- Recommended offer: $144k (17.7% below list) — sets the bar for 1% rule.
Location & tenants
- Location reads 74/100 on livability (#197 in MI, #4,970 nationally) — a middle-class / working-renter tenant base. Strengths: cost of living A+, housing A+, health & safety A+; Watch: schools D, crime F, employment F.
- Jackson Public Schools (urban): math 15% / reading 28% proficiency, ranked #458 of 540 in MI (top 85%) — low school quality limits family demand, transient renter base, plan for 1-2y turnover; 63% free/reduced lunch — lower-income household profile, screen leases tightly.
- Market conditions: Rents rising fast (+7.5%/yr); 164 active listings in the ZIP; 317 units permitted in Jackson County in 2024 (103 in 5+ unit buildings).
- This rent runs 31% of the median local income ($56k/yr) — at the standard rent-burdened threshold; future hikes will face affordability resistance.
Forward outlook
- Local home prices are declining (-3.0%/yr); year-one equity from $1k of loan paydown is wiped out by about $5k of value loss. Plan a longer hold.
- Jackson County population projected at -13% by 2050 — secular population decline; favor cash flow + early exit over multi-decade hold.
Negotiation context
- It's been on market 48 days — a 3% lower offer ($170k) is reasonable based on typical stale-listing flexibility.
- 15 sale attempts since 16y ago; this cycle's ask has dropped $10k (5%) from the opening price — seller is motivated, your offer sets the floor, not the list.
- Current owner paid $112k; list at $175k implies a 56% gain — meaningful room to come down on a strong offer.
Risks & watch-outs
- Watch-outs: built in 1955 — expect roof / HVAC / electrical / plumbing capex.
Questions for the listing agent
- What do current leases actually rent for vs. the listed asking? Can we see a recent rent roll and the last 12 months of T-12 income?
- It's been on market 48 days. Have you received any prior offers? Is the seller open to a 18% concession, seller financing, or rate buy-down credit?
- Built in 1955 — when were the roof, HVAC, electrical panel, plumbing, and water heater last replaced?
- Is there a deadline driving the sale (1031 exchange, divorce, estate, relocation)? That informs how much negotiation room exists.
- Schools are D-rated, which usually means shorter tenancies and higher turnover. Who's the typical renter profile here, and what's been the actual vacancy rate?
- Crime grade is F in this area — have there been break-ins, vandalism, or insurance claims at this property in the last 3 years? What carrier currently insures it and at what premium?
- The area grade is low — what's the realistic commute time and amenity access for the typical tenant pool here? Any planned neighborhood developments (good or bad) we should know about?
- What's the average days-on-market for RENTAL listings here right now (not sales)? A rising rental-DOM trend means longer vacancies and softer asking-rent achievability than the comps imply.
- What's the recent tenant-quality profile in this submarket — average credit score on applications, eviction rate, late-payment / NSF rate, and stable-employment percentage? A property-management company in the area should have these aggregated.
- How much new for-sale + rental construction is in the pipeline within 1–3 miles? Heavy new supply typically softens prices + rents 12–24 months out; constrained supply supports both.
Investment metrics
- 1% rule
- 0.82% ✗
- Cap rate
- 6.20%
- Cash-on-cash
- -0.32%
- DSCR
- 0.99
- GRM
- 10.1
CMA / ARV
- ARV (median comp)
- $180,513
- List price
- $174,900
- Delta
- -3.11%
- Verdict
- FAIR
- Comps
- 20 within 1.0 mi
Show comp detail 8 sales within ~0.75 mi
| Address | Dist | Beds/Ba | Sqft | Sold | Price | $/sf | Match |
|---|---|---|---|---|---|---|---|
| 3440 Tracey Dr | 0.11mi | 3/1.0 | 926 (-0%) | 13mo | $174,000 | $188 | 84 |
| 3500 Harding Rd | 0.13mi | 3/1.0 | 880 (-5%) | 12mo | $150,000 | $170 | 76 |
| 3633 Roosevelt Cir | 0.28mi | 3/1.0 | 936 (+1%) | 23mo | $206,400 | $221 | 66 |
| 3539 Roosevelt Rd | 0.15mi | 3/1.0 | 999 (+8%) | 22mo | $158,000 | $158 | 62 |
| 1809 Park Rd | 0.29mi | 4/1.0 (+1) | 972 (+5%) | 15mo | $170,000 | $175 | 61 |
| 1501 Park Road Rd | 0.18mi | 3/1.0 | 1,053 (+14%) | 11mo | $190,000 | $180 | 60 |
| 3638 Roosevelt Cir | 0.31mi | 3/1.0 | 1,040 (+12%) | 15mo | $185,000 | $178 | 53 |
| 2699 Kibby Rd | 0.69mi | 2/1.0 (-1) | 888 (-4%) | 10mo | $203,000 | $229 | 47 |
Match score weights: distance 35% · size 25% · config 20% · recency 20%. Top-matched comps best support the ARV.
Projected returns pro-forma
-3.0% appreciation · 7.54% rent growth · sell at horizon
- IRR
- -12.1%
- Equity multiple
- 0.54×
- Total profit
- $-22,309
- Equity at exit
- $26,078
- IRR
- 2.5%
- Equity multiple
- 1.21×
- Total profit
- $10,440
- Equity at exit
- $15,122
Cash invested: $48,972 (down + closing). Projections, not guarantees.
Landlord ↔ Tenant lean methodology
- Overall (STATE)
- 62 Landlord-Friendly
- State Michigan
- 62 Landlord-Friendly · EVEN
- County
- — inherits STATE
- City
- — inherits STATE
ZIP-level market 49203
- Home prices YoY
- -31.7%
- Rents YoY
- 7.5%
- Active inventory
- 164
- Price-to-rent
- 10.1×
Monthly cashflow live
- Estimated rent
- $1,439 medium interval (Pro) →
- Mortgage (P&I)
- −$917
- Tax from tax record
- −$160 /mo · $1,921/yr
- Insurance
- −$73
- HOA
- −$0
- Vacancy / Maint / Mgmt
- −$302
- Net cashflow
- $-13
Break-even live
Sensitivity live
| Price | -10% $86 | -5% $36 | +0% $-13 | +5% $-63 | +10% $-112 |
|---|---|---|---|---|---|
| Rent | -10% $-127 | -5% $-70 | +0% $-13 | +5% $44 | +10% $101 |
| Rate | -1.0pp $75 | -0.5pp $31 | base $-13 | +0.5pp $-58 | +1.0pp $-104 |
UW: 25.0% down · 7.5% · 30yr · 1.5% tax · 5.0% vac · 8.0% maint · 8.0% mgmt
Financing live
Cash to close
- Down payment
- $43,725
- Closing costs
- $5,247
- Reserves months
- —
- Total cash needed
- —
Loan-product check · same deal, 3 products live
Conventional
25% down · 7.5% · 30yr
- Down + closing
- —
- Monthly P&I
- —
- Monthly cashflow
- —
- DSCR
- —
- Eligible?
- —
Personal DTI + credit; lowest rate.
DSCR
20% down · 8.5% · 30yr
- Down + closing
- —
- Monthly P&I
- —
- Monthly cashflow
- —
- DSCR
- —
- Eligible?
- —
No personal income docs; deal must DSCR.
Hard money
10% down · 12.0% · 12mo
- Down + closing
- —
- Monthly P&I
- —
- Monthly cashflow
- —
- DSCR
- —
- Eligible?
- —
Short-term bridge; refi at stabilization.
Listing history 50 events
-
2026-06-19days on market $174,900 Active 48 DOM
-
2026-06-18days on market $174,900 Active 47 DOM
Show marketing remark (514 chars)
Here's your opportunity to move to Summit Township - This 3 bedroom 1 bath bungalow offers a large open living room with updated flooring and paint, updated kitchen with appliance package included and door to your private deck, main floor primary bedroom, 2 additional bedrooms, main floor laundry, and updated full bath with custom tile shower/tub combo. Exterior features a 1 car detached garage, extra lot included in price, private wooded backyard perfect for summer nights! Don't miss this great opportunity!
-
2026-06-18price $174,900 Active 46 DOM
Show marketing remark (514 chars)
Here's your opportunity to move to Summit Township - This 3 bedroom 1 bath bungalow offers a large open living room with updated flooring and paint, updated kitchen with appliance package included and door to your private deck, main floor primary bedroom, 2 additional bedrooms, main floor laundry, and updated full bath with custom tile shower/tub combo. Exterior features a 1 car detached garage, extra lot included in price, private wooded backyard perfect for summer nights! Don't miss this great opportunity!
-
2026-06-17days on market $179,900 Active 46 DOM
-
2026-06-16days on market $179,900 Active 45 DOM
-
2026-06-15days on market $179,900 Active 44 DOM
-
2026-06-14days on market $179,900 Active 42 DOM
-
2026-06-13days on market $179,900 Active 41 DOM
-
2026-06-10days on market $179,900 Active 39 DOM
-
2026-06-09days on market $179,900 Active 38 DOM
-
2026-06-08days on market $179,900 Active 37 DOM
-
2026-06-07days on market $179,900 Active 36 DOM
-
2026-06-03days on market $179,900 Active 32 DOM
-
2026-06-02days on market $179,900 Active 31 DOM
-
2026-06-01days on market $179,900 Active 30 DOM
-
2026-05-31days on market $179,900 Active 29 DOM
-
2026-05-30days on market $179,900 Active 28 DOM
-
2026-05-02$184,900 Active 513-char remark
Show marketing remark (514 chars)
Here's your opportunity to move to Summit Township - This 3 bedroom 1 bath bungalow offers a large open living room with updated flooring and paint, updated kitchen with appliance package included and door to your private deck, main floor primary bedroom, 2 additional bedrooms, main floor laundry, and updated full bath with custom tile shower/tub combo. Exterior features a 1 car detached garage, extra lot included in price, private wooded backyard perfect for summer nights! Don't miss this great opportunity!
-
2026-05-02$184,900 Active 514-char remark
Show marketing remark (514 chars)
Here's your opportunity to move to Summit Township - This 3 bedroom 1 bath bungalow offers a large open living room with updated flooring and paint, updated kitchen with appliance package included and door to your private deck, main floor primary bedroom, 2 additional bedrooms, main floor laundry, and updated full bath with custom tile shower/tub combo. Exterior features a 1 car detached garage, extra lot included in price, private wooded backyard perfect for summer nights! Don't miss this great opportunity!
-
2026-05-02$184,900 Active
Show marketing remark (514 chars)
Here's your opportunity to move to Summit Township - This 3 bedroom 1 bath bungalow offers a large open living room with updated flooring and paint, updated kitchen with appliance package included and door to your private deck, main floor primary bedroom, 2 additional bedrooms, main floor laundry, and updated full bath with custom tile shower/tub combo. Exterior features a 1 car detached garage, extra lot included in price, private wooded backyard perfect for summer nights! Don't miss this great opportunity!
-
2026-02-09historical
-
2026-02-09historical
-
2025-12-19price $178,900
-
2025-12-19price $178,900
-
2025-08-15price $182,000
-
2025-08-15price $182,000
-
2025-08-11$189,000 Active
-
2025-08-11historical
-
2025-08-08$189,000 Active
-
2025-08-08$189,000 Active
-
2018-12-19soldstatus $112,000
-
2018-12-14soldstatus $112,000
-
2018-12-14soldstatus $112,000
-
2018-12-14soldstatus $112,000 Closed
-
2018-11-12historical Keep Showing-Contgcy Appl
-
2018-11-04price $109,000
-
2018-10-18$109,000
-
2018-10-18$109,000
-
2018-10-18$116,000 Active
-
2014-09-04soldstatus $62,700
-
2014-08-29soldstatus $62,700
-
2014-08-29soldstatus $62,700
-
2014-08-29soldstatus $62,700
-
2014-07-08historical
-
2014-05-16$64,900
-
2014-05-16$64,900
-
2014-05-16$64,900
-
2014-05-06historical
-
2014-05-06historical
-
2014-03-04$67,000
ⓘ Source: listings_history table (triggers on properties + properties_extension) + one-shot
backfill from property_details.listing_events for pre-trigger history.
Tax reassessment forecast MI · Partial reset (capped growth)
- Current annual tax
- $1,921 · $160/mo
- Projected year-2 tax
- $2,307 · $192/mo
- Expected delta
- +$386/yr (+$32/mo · 20.1%)
ⓘ Screening estimate from a state-policy table — verify with the county assessor before closing.
Climate risk First Street
- Flood 1/10 Low FEMA zone X (unshaded) · 0% chance over 30 yrs
- Wildfire 3/10 Moderate
- Heat 3/10 Moderate 7 d/yr ≥98°F today · 15 d/yr by 30 yrs out
- Wind 2/10 Low
- Air quality 2/10 Low 1 unhealthy d/yr today · 1 by 30 yrs out
Nearby sold comps map
Loading sold comps map…
Walkable amenities ~0.75 mi
Loading nearby amenities…
Taxation est. · year 1
- Rental income
- $17,272
- − Mortgage interest
- −$9,797
- − Property taxes
- −$1,921
- − Insurance
- −$874
- − Repairs & maintenance
- −$1,382
- − Management
- −$1,382
- − Depreciation
- −$5,088
- Taxable loss
- −$3,171
- Est. tax savings @ 24.0%
- +$761
- After-tax cash flow
- $605/yr
For passive investors: Depreciation is non-cash, so a rental often shows a tax loss while cash-flowing — sheltering income. Rental losses are passive: they offset passive income freely, and up to $25,000/yr can offset ordinary (W-2) income if you actively participate and your MAGI is under $100k (phasing out to $0 by $150k); unused losses carry forward. On sale, claimed depreciation is recaptured at up to 25%, and gains may owe capital-gains tax (a 1031 exchange can defer both). Figures are a year-1 estimate at your 24.0% rate — not tax advice; consult a CPA.
Schools (NCES district)
- District
- Jackson Public Schools
- NCES district ID
- 2619620
- Math proficiency
- 15% ▼ -6.00%
- Reading proficiency
- 28% ▼ -3.00%
- Median HH income
- $38,344
- Composite
- 17.99/100
- National rank
- #8986
- State rank
- #458 of 540 in MI
Livability — Jackson
- Score
- 74/100
- State rank
- #197
- US rank
- #4970
Category grades
Schools grade is shown separately in the Schools card above.
Census & demographics
- County
- Jackson County · 85,581 people
- City population
- 85,581
- Metro
- Jackson, MI
- Population (ZIP)
- 36,474
- Household income
- $56,201
- Rent vs Own
- Severe rent burden
- 1383.0
Population outlook (Jackson County) Hauer SSP2
- Today (2025)
- 156,365 people
- By 2030
- 153,123 · -2.1%
- By 2040
- 144,981 · -7.3%
- By 2050
- 135,671 · -13.2%
- By 2075
- 113,833 · -27.2%
- By 2100
- 86,592 · -44.6%
Race, ethnicity, and origin ACS 2023
- Neighborhood character
- Predominantly White (73%)
- Race & ethnicity
- White 73% Black 15% Two or more races 9% Hispanic / Latino 5%
- Common ancestry
- Romanian 6% Lithuanian 3% Slovak 2%
- Foreign-born
- 2% · Canada
- Languages at home
- 97% English-only · Spanish 1% Other Indo-European 1%
Political lean MEDSL · Jackson
- 2024 margin
- Strong R (+21.3) · D 38.6% · R 59.9% · Other 1.5%
- 2008→2024 swing
- -23.7pp toward R · 2008: 2.4pp · 2024: -21.3pp
- All cycles
- 2024: R+21.3 2020: R+19.0 2016: R+20.1 2012: R+5.8 2008: D+2.4
Not yet ingested
- Civics
- —
Market trends
- HPI YoY
- ▼ -98.09%
- Current HPI
- 211.5474
- Rent YoY
- ▲ 7.54%
- Metro
- Jackson, MI
- State GDP YoY
- ▲ 1.37%
- F500 in state
- 28
Industry mix (Fortune 500 HQ in MI)
| Industry | F500 HQs | Revenue |
|---|---|---|
| Automotive Parts | 3 | $48B |
|
||
| Automotive | 2 | $372B |
|
||
| Chemicals | 1 | $45B |
|
||
| Automotive Retail | 1 | $29B |
|
||
| Healthcare / Medical Devices | 1 | $23B |
|
||
| Automotive Technology | 1 | $20B |
|
||
Price history
+274.1% since first listed45 events — show timeline
- 2026-06-18 Price Changed $174,900 MiRealSource-MiMLS
- 2026-06-18 Price Changed $174,900 REALCOMP
- 2026-06-18 Price Changed $174,900 SW Michigan MLS
- 2026-05-28 Price Changed $179,900 MiRealSource-MiMLS
- 2026-05-27 Price Changed $179,900 REALCOMP
- 2026-05-27 Price Changed $179,900 SW Michigan MLS
- 2026-05-02 Listed $184,900 SW Michigan MLS
- 2026-05-02 Listed $184,900 REALCOMP
- 2026-05-02 Listed $184,900 MiRealSource-MiMLS
- 2026-02-09 Listing Removed — REALCOMP
- 2026-02-09 Listing Removed — Greater Lansing AoR
- 2025-12-19 Price Changed $178,900 REALCOMP
- 2025-12-19 Price Changed $178,900 Greater Lansing AoR
- 2025-08-15 Price Changed $182,000 REALCOMP
- 2025-08-15 Price Changed $182,000 Greater Lansing AoR
- 2025-08-11 Listed $189,000 REALCOMP
- 2025-08-11 Listing Removed — REALCOMP
- 2025-08-08 Listed $189,000 REALCOMP
- 2025-08-08 Listed $189,000 Greater Lansing AoR
- 2018-12-19 Sold (Public Records) $112,000 Public Records
- 2018-12-14 Sold (MLS) $112,000 MiRealSource-MiMLS
- 2018-12-14 Sold (MLS) $112,000 SW Michigan MLS
- 2018-12-14 Sold (MLS) $112,000 REALCOMP
- 2018-11-12 Contingent — MiRealSource-MiMLS
- 2018-11-04 Price Changed $109,000 MiRealSource-MiMLS
- 2018-10-18 Listed $116,000 MiRealSource-MiMLS
- 2018-10-18 Listed $109,000 SW Michigan MLS
- 2018-10-18 Listed $109,000 REALCOMP
- 2014-09-04 Sold (Public Records) $62,700 Public Records
- 2014-08-29 Sold (MLS) $62,700 MiRealSource-MiMLS
- 2014-08-29 Sold (MLS) $62,700 REALCOMP
- 2014-08-29 Sold (MLS) $62,700 SW Michigan MLS
- 2014-07-08 Listing Removed — MiRealSource-MiMLS
- 2014-05-16 Listed $64,900 MiRealSource-MiMLS
- 2014-05-16 Listed $64,900 REALCOMP
- 2014-05-16 Listed $64,900 SW Michigan MLS
- 2014-05-06 Listing Removed — REALCOMP
- 2014-05-06 Listing Removed — MiRealSource-MiMLS
- 2014-03-04 Listed $67,000 REALCOMP
- 2014-03-04 Listed $67,000 MiRealSource-MiMLS
- 2010-10-19 Sold (Public Records) $53,000 Public Records
- 2010-09-09 Sold (MLS) $53,000 MiRealSource-MiMLS
- 2010-08-07 Listing Removed — MiRealSource-MiMLS
- 2010-05-07 Listed $54,900 MiRealSource-MiMLS
- 2009-10-14 Sold (Public Records) $46,750 Public Records
Property tax history
+6.4%/yrLatest (2025): $1,921 · -19.1% YoY. Source: county tax records.
Cash-flow waterfall
monthlySold comps — $/sqft
last 12 mo · ≤1 miLoading sold comps…