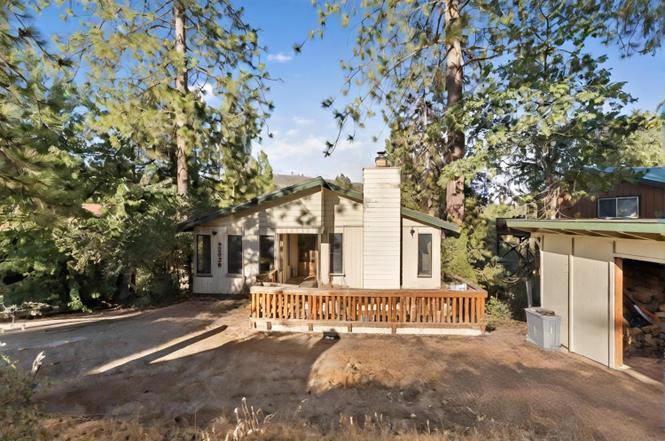
33828 Shaver Springs Rd · Auberry, CA
Flood risk 6/10 · Moderate
- FEMA flood zone
- X (unshaded)
- Chance of flooding over 30 yrs
- 0.74%
- Est. flood insurance / yr
- $507 – $1,088
Fire risk 9/10 · Severe
- Est. fire insurance / yr
- $659 – $1,223
Heat risk 4/10 · Minor
- Hot days now (above 95°F)
- 8 days/yr
- Hot days in 30 yrs
- 19 days/yr
Wind risk 1/10 · Minimal
- Chance of severe wind over 30 yrs
- —
Air-quality risk 10/10 · Severe
- Unhealthy air days now
- 67 days/yr
- Unhealthy air days in 30 yrs
- 75 days/yr
Risk factors via First Street. Map © Google.
Why this score? — see what drove the B- grade
The composite is a weighted blend of 9 inputs, each scored 0–100. Each bar is that input's sub-score; the figure is the points it added to the 100-point composite (weight × sub-score).
- Cash flow +24.9/30.0
- ARV discount +15.0/15.0
- DSCR +8.1/10.0
- 1% rule +6.2/10.0
- Schools +5.0/10.0
- Livability +2.7/5.0
- Rent growth +2.5/5.0
- Condition / age +2.5/5.0
- Appreciation +0.0/10.0
$223,000
🖨 Deal sheet 📄 Offer letter ✓ Due diligence
Listing remarks MLS
Short Sale in good neighborhood. Nice home backs open space with view to pond. This home is in need of a little TLC, but is ready to move in as is. Large garage, open living/great room, fireplace w/ insert, tile counter tops in kitchen.
Key facts
- 7,501 sq ft lot
- Built 1978
- Listed 164 days
Neighborhood map
What this means for you Summary
Snapshot
- This is a 3-bed/3.0-bath single-family listed at $223k.
Deal economics
- At list price, monthly cash flow is $481 ($6k/yr) — positive.
- The deal already cash-flows at list — no discount required.
- Meets the 1% rule at list price ($2k rent vs $223k).
- Recommended offer: $196k (12.0% below list) — sets the bar for market timing.
- Cap rate 8.9% vs local median 2.4% in Auberry — top-decile yield for the area; either an underpriced asset or a hidden risk that comps aren't pricing in. Stress-test before assuming the spread holds.
Location & tenants
- Location reads 53/100 on livability (#982 in CA) — a working-class tenant base; expect higher turnover. Strengths: housing A+, crime B, employment B; Watch: schools D+, amenities F, commute F.
- Market conditions: 58 active listings in the ZIP; 2,426 units permitted in Fresno County in 2024 (296 in 5+ unit buildings).
Forward outlook
- Local home prices are declining (-3.0%/yr); year-one equity from $2k of loan paydown is wiped out by about $7k of value loss. Plan a longer hold.
- Fresno County population projected at +11% by 2050 — modest demand growth; plan on rents tracking national, not racing it.
Negotiation context
- It's been on market 164 days — a 12% lower offer ($196k) is reasonable based on typical stale-listing flexibility.
- 2 sale attempts since 15y ago with the ask held roughly flat each time — persistent listings suggest the price (not the market) is what's stuck; bring a comps-based counter.
- Current owner paid $160k; 39% above their basis — modest negotiation headroom, anchor on the comps not their cost.
Risks & watch-outs
- Climate carrying-cost: major flood risk; severe wildfire risk — expect insurance premiums to compound above CPI over the hold.
Questions for the listing agent
- It's been on market 164 days. Have you received any prior offers? Is the seller open to a 12% concession, seller financing, or rate buy-down credit?
- Built in 1978 — when were the roof, HVAC, electrical panel, plumbing, and water heater last replaced?
- What does the HOA fee cover, when was the last increase, and are there any pending special assessments or reserve-fund shortfalls?
- Why hasn't it sold? Are there any deal-killer items the seller is aware of (foundation, flood, title, zoning, code violations)?
- Is there a deadline driving the sale (1031 exchange, divorce, estate, relocation)? That informs how much negotiation room exists.
- Schools are D-rated, which usually means shorter tenancies and higher turnover. Who's the typical renter profile here, and what's been the actual vacancy rate?
- What's the average days-on-market for RENTAL listings here right now (not sales)? A rising rental-DOM trend means longer vacancies and softer asking-rent achievability than the comps imply.
- What's the recent tenant-quality profile in this submarket — average credit score on applications, eviction rate, late-payment / NSF rate, and stable-employment percentage? A property-management company in the area should have these aggregated.
- How much new for-sale + rental construction is in the pipeline within 1–3 miles? Heavy new supply typically softens prices + rents 12–24 months out; constrained supply supports both.
Investment metrics
- 1% rule
- 1.12% ✓
- Cap rate
- 8.88%
- Cash-on-cash
- 9.24%
- DSCR
- 1.41
- GRM
- 7.4
CMA / ARV
- ARV (on-the-fly)
- $386,640
- Comps found
- 1
Show comp detail 1 sale within ~0.75 mi
| Address | Dist | Beds/Ba | Sqft | Sold | Price | $/sf | Match |
|---|---|---|---|---|---|---|---|
| 33899 Tocaloma Rd | 0.09mi | 3/1.8 | 1,265 (-12%) | 12mo | $341,000 | $270 | 61 |
Match score weights: distance 35% · size 25% · config 20% · recency 20%. Top-matched comps best support the ARV.
Projected returns pro-forma
-3.0% appreciation · 3.0% rent growth · sell at horizon
- IRR
- -2.3%
- Equity multiple
- 0.91×
- Total profit
- $-5,493
- Equity at exit
- $33,250
- IRR
- 7.4%
- Equity multiple
- 1.56×
- Total profit
- $34,692
- Equity at exit
- $19,281
Cash invested: $62,440 (down + closing). Projections, not guarantees.
Landlord ↔ Tenant lean methodology
- Overall (STATE)
- 18 Strongly Tenant-Friendly
- State California
- 18 Strongly Tenant-Friendly · D+13
- County
- — inherits STATE
- City
- — inherits STATE
ZIP-level market 93602
- Home prices YoY
- -28.8%
- Active inventory
- 58
- Price-to-rent
- 7.4×
Monthly cashflow live
- Estimated rent
- $2,496 medium interval (Pro) →
- Mortgage (P&I)
- −$1,169
- Tax from tax record
- −$186 /mo · $2,230/yr
- Insurance
- −$93
- HOA
- −$43
- Vacancy / Maint / Mgmt
- −$524
- Net cashflow
- $481
Break-even live
UW: 25.0% down · 7.5% · 30yr · 1.5% tax · 5.0% vac · 8.0% maint · 8.0% mgmt
Financing live
Cash to close
- Down payment
- $55,750
- Closing costs
- $6,690
- Reserves months
- —
- Total cash needed
- —
Loan-product check · same deal, 3 products live
Conventional
25% down · 7.5% · 30yr
- Down + closing
- —
- Monthly P&I
- —
- Monthly cashflow
- —
- DSCR
- —
- Eligible?
- —
Personal DTI + credit; lowest rate.
DSCR
20% down · 8.5% · 30yr
- Down + closing
- —
- Monthly P&I
- —
- Monthly cashflow
- —
- DSCR
- —
- Eligible?
- —
No personal income docs; deal must DSCR.
Hard money
10% down · 12.0% · 12mo
- Down + closing
- —
- Monthly P&I
- —
- Monthly cashflow
- —
- DSCR
- —
- Eligible?
- —
Short-term bridge; refi at stabilization.
HOA detail
- Monthly dues
- $43 · $516/yr
Listing history 11 events
-
2026-01-30status Pending
-
2025-10-27historical Pending Accepting Backups
-
2025-10-03price $223,000
-
2025-09-16price $224,000
-
2025-08-29price $225,000
-
2025-08-15$229,999 Active
-
2011-05-06soldstatus $160,000 236-char remark
Show marketing remark (236 chars)
Short Sale in good neighborhood. Nice home backs open space with view to pond. This home is in need of a little TLC, but is ready to move in as is. Large garage, open living/great room, fireplace w/ insert, tile counter tops in kitchen.
-
2011-05-06soldstatus $160,000
Show marketing remark (236 chars)
Short Sale in good neighborhood. Nice home backs open space with view to pond. This home is in need of a little TLC, but is ready to move in as is. Large garage, open living/great room, fireplace w/ insert, tile counter tops in kitchen.
-
2011-03-31historical 236-char remark
Show marketing remark (236 chars)
Short Sale in good neighborhood. Nice home backs open space with view to pond. This home is in need of a little TLC, but is ready to move in as is. Large garage, open living/great room, fireplace w/ insert, tile counter tops in kitchen.
-
2011-01-02$160,000 236-char remark
Show marketing remark (236 chars)
Short Sale in good neighborhood. Nice home backs open space with view to pond. This home is in need of a little TLC, but is ready to move in as is. Large garage, open living/great room, fireplace w/ insert, tile counter tops in kitchen.
-
2005-06-20soldstatus $326,000
ⓘ Source: listings_history table (triggers on properties + properties_extension) + one-shot
backfill from property_details.listing_events for pre-trigger history.
Tax reassessment forecast CA · Resets to sale price
- Current annual tax
- $2,230 · $186/mo
- Projected year-2 tax
- $2,230 · $186/mo
- Expected delta
- $0/yr ($0/mo · 0.0%)
ⓘ Screening estimate from a state-policy table — verify with the county assessor before closing.
Climate risk First Street
- Flood 6/10 Major FEMA zone X (unshaded) · 74% chance over 30 yrs
- Wildfire 9/10 Extreme
- Heat 4/10 Moderate 8 d/yr ≥95°F today · 19 d/yr by 30 yrs out
- Wind 1/10 Low
- Air quality 10/10 Extreme 67 unhealthy d/yr today · 75 by 30 yrs out
Nearby sold comps map
Loading sold comps map…
Walkable amenities ~0.75 mi
Loading nearby amenities…
Taxation est. · year 1
- Rental income
- $29,957
- − Mortgage interest
- −$12,491
- − Property taxes
- −$2,230
- − Insurance
- −$1,115
- − Repairs & maintenance
- −$2,397
- − Management
- −$2,397
- − HOA
- −$516
- − Depreciation
- −$6,487
- Taxable income
- $2,324
- Est. tax owed @ 24.0%
- −$558
- After-tax cash flow
- $5,214/yr
For passive investors: Depreciation is non-cash, so a rental often shows a tax loss while cash-flowing — sheltering income. Rental losses are passive: they offset passive income freely, and up to $25,000/yr can offset ordinary (W-2) income if you actively participate and your MAGI is under $100k (phasing out to $0 by $150k); unused losses carry forward. On sale, claimed depreciation is recaptured at up to 25%, and gains may owe capital-gains tax (a 1031 exchange can defer both). Figures are a year-1 estimate at your 24.0% rate — not tax advice; consult a CPA.
Schools (NCES district)
No district data.
Livability — Auberry
- Score
- 53/100
- State rank
- #982
- US rank
- #24661
Category grades
Schools grade is shown separately in the Schools card above.
Census & demographics
- Census place
- Auberry, CA
- City population
- 3,091
- Population (ZIP)
- 3,091
Population outlook (Fresno County) Hauer SSP2
- Today (2025)
- 1,042,971 people
- By 2030
- 1,072,198 · +2.8%
- By 2040
- 1,122,408 · +7.6%
- By 2050
- 1,157,251 · +11.0%
- By 2075
- 1,182,575 · +13.4%
- By 2100
- 1,105,899 · +6.0%
Race, ethnicity, and origin ACS 2023
- Neighborhood character
- Predominantly White (74%)
- Race & ethnicity
- White 74% Two or more races 12% Hispanic / Latino 10% Native American 9%
- Hispanic origin (detail)
- Mexican 10%
- Common ancestry
- Lithuanian 4% Scotch-Irish 2% Italian 2%
- Foreign-born
- 1% · Canada
- Languages at home
- 95% English-only · Spanish 4% Other Indo-European 1%
Political lean MEDSL · Fresno
- 2024 margin
- Toss-up / Even · D 46.5% · R 50.9% · Other 2.6%
- 2008→2024 swing
- -6.5pp toward R · 2008: 2.1pp · 2024: -4.4pp
- All cycles
- 2024: R+4.4 2020: D+7.8 2016: D+3.9 2012: R+2.9 2008: D+2.1
Not yet ingested
- Civics
- —
Market trends
- HPI YoY
- ▼ -98.97%
- Current HPI
- 244.699
- Rent YoY
- —
- Metro
- —
- State GDP YoY
- ▲ 3.21%
- F500 in state
- 116
Industry mix (Fortune 500 HQ in CA)
| Industry | F500 HQs | Revenue |
|---|---|---|
| Technology | 27 | $1,492B |
|
||
| Financial Services | 3 | $174B |
|
||
| Retail | 3 | $44B |
|
||
| Insurance | 3 | $26B |
|
||
| Media / Entertainment | 2 | $115B |
|
||
| Pharmaceuticals / Biotech | 2 | $62B |
|
||
Price history
-31.6% since first listed11 events — show timeline
- 2026-01-30 Pending — FRESNOMLS
- 2025-10-27 Contingent — FRESNOMLS
- 2025-10-03 Price Changed $223,000 FRESNOMLS
- 2025-09-16 Price Changed $224,000 FRESNOMLS
- 2025-08-29 Price Changed $225,000 FRESNOMLS
- 2025-08-15 Listed $229,999 FRESNOMLS
- 2011-05-06 Sold (Public Records) $160,000 Public Records
- 2011-05-06 Sold (MLS) $160,000 FRESNOMLS
- 2011-03-31 Delisted — FRESNOMLS
- 2011-01-02 Listed $160,000 FRESNOMLS
- 2005-06-20 Sold (Public Records) $326,000 Public Records
Property tax history
+2.5%/yrLatest (2025): $2,230 · +6.3% YoY. Source: county tax records.
Cash-flow waterfall
monthlySold comps — $/sqft
last 12 mo · ≤1 miLoading sold comps…