86 Main St · New York Mills, NY
Flood risk No data
- FEMA flood zone
- —
- Chance of flooding over 30 yrs
- —
- Est. flood insurance / yr
- —
Fire risk No data
- Est. fire insurance / yr
- —
Heat risk No data
- Hot days now (above threshold)
- —
- Hot days in 30 yrs
- —
Wind risk No data
- Chance of severe wind over 30 yrs
- —
Air-quality risk No data
- Unhealthy air days now
- —
- Unhealthy air days in 30 yrs
- —
Risk factors via First Street. Map © Google.
Why this score? — see what drove the D grade
The composite is a weighted blend of 9 inputs, each scored 0–100. Each bar is that input's sub-score; the figure is the points it added to the 100-point composite (weight × sub-score).
- Appreciation +10.0/10.0
- ARV discount +7.5/15.0
- Cash flow +7.2/30.0
- Schools +5.2/10.0
- Livability +3.9/5.0
- Rent growth +2.5/5.0
- Condition / age +2.5/5.0
- 1% rule +2.0/10.0
- DSCR +1.4/10.0
$299,000
🖨 Deal sheet (PDF) 📄 Offer letter ✓ Due diligence
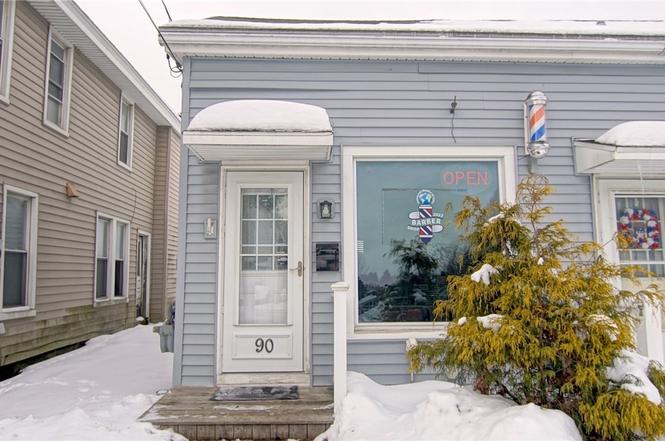
Listing remarks
Secluded Home with Income Producing Units, Excellent Investment! This immaculately kept 2 bedroom home, with the potential for a 3rd bedroom, offers 1 1/2 baths and a kitchen featuring stainless steel appliances. The living room includes a cozy gas fireplace, and the home opens to a covered deck overlooking a large, privacy fenced yard, ideal for entertaining and get-togethers. A 1 stall detached garage provides additional upstairs storage. Set back and secluded behind the barber shop, the home offers added privacy. Along the street frontage is a barber shop with a 1/2 bath, plus a separate 1 bedroom, 1 bath apartment. Each unit generates $600 per month, providing steady rental income. The
Key facts
- Covered deck
- Privacy fenced yard
- Detached garage
Tags
Neighborhood map
What this means for you Summary
Snapshot
- This is a 2-bed/1.5-bath single-family listed at $299k.
Deal economics
- At list price, monthly cash flow is $-407 ($-5k/yr) — negative.
- To cash-flow at today's rent, offer at most $240k (19.7% below list).
- To meet the 1% rule (rent ≥ 1% of price), the offer needs to be $210k (29.8% below list).
- Recommended offer: $210k (29.8% below list) — sets the bar for 1% rule.
Location & tenants
- Location reads 78/100 on livability (#175 in NY, #2,712 nationally) — a middle-class / working-renter tenant base. Strengths: health & safety A+, cost of living A, housing A; Watch: amenities F, commute F.
- New York Mills Union Free School District (suburban): math 60% / reading 65% proficiency, ranked #224 of 590 in NY (top 38%) — acceptable for families but not a draw, mixed tenant base, ~2y average lease.
- Zoned schools: New York Mills School (math 52% / reading 47%, 546 students, 50% FRL) — zoned schools average 50% FRL vs 30% district-wide (20 pts higher); higher-poverty schools than district average — tighter screening recommended.
- Zoned-school proficiency averages 50% at this address vs 62% district-wide (-13 pts) — the specific schools serving this property underperform the New York Mills Union Free School District average; the district grade overstates school quality for this exact location.
- Market conditions: 10 active listings in the ZIP; 1 comparable units currently listed for rent nearby; 204 units permitted in Oneida County in 2024 (68 in 5+ unit buildings).
Forward outlook
- In year one you build about $32k of equity ($2k loan paydown + $30k appreciation (10.0% local appreciation)).
- Oneida County population projected at -12% by 2050 — secular population decline; favor cash flow + early exit over multi-decade hold.
- By year 2, paydown + projected appreciation supports a ~$51k cash-out refi (75% LTV) — recoverable capital for the next deal without selling this one.
Negotiation context
- It's been on market 97 days — a 9% lower offer ($272k) is reasonable based on typical stale-listing flexibility.
- 2 sale attempts; this cycle's ask has dropped $26k (8%) from the opening price — seller is motivated, your offer sets the floor, not the list.
Risks & watch-outs
- Watch-outs: built in 1949 — expect roof / HVAC / electrical / plumbing capex.
Questions for the listing agent
- What do current leases actually rent for vs. the listed asking? Can we see a recent rent roll and the last 12 months of T-12 income?
- It's been on market 97 days. Have you received any prior offers? Is the seller open to a 30% concession, seller financing, or rate buy-down credit?
- Built in 1949 — when were the roof, HVAC, electrical panel, plumbing, and water heater last replaced?
- Why hasn't it sold? Are there any deal-killer items the seller is aware of (foundation, flood, title, zoning, code violations)?
- Is there a deadline driving the sale (1031 exchange, divorce, estate, relocation)? That informs how much negotiation room exists.
- Schools are B-rated — typically a magnet for longer-tenancy family renters. What's the average tenant stay here, and is there a school-zone premium baked into asking?
- The area grade is low — what's the realistic commute time and amenity access for the typical tenant pool here? Any planned neighborhood developments (good or bad) we should know about?
- What's the average days-on-market for RENTAL listings here right now (not sales)? A rising rental-DOM trend means longer vacancies and softer asking-rent achievability than the comps imply.
- What's the recent tenant-quality profile in this submarket — average credit score on applications, eviction rate, late-payment / NSF rate, and stable-employment percentage? A property-management company in the area should have these aggregated.
- How much new for-sale + rental construction is in the pipeline within 1–3 miles? Heavy new supply typically softens prices + rents 12–24 months out; constrained supply supports both.
Investment metrics
- 1% rule
- 0.70% ✗
- Cap rate
- 4.66%
- Cash-on-cash
- -5.84%
- DSCR
- 0.74
- GRM
- 11.9
CMA / ARV
- ARV (on-the-fly)
- $176,904
- Comps found
- 12
Show comp detail 12 sales within ~0.75 mi
| Address | Dist | Beds/Ba | Sqft | Sold | Price | $/sf | Match |
|---|---|---|---|---|---|---|---|
| 7 6th St | 0.30mi | 3/1.0 (+1) | 1,144 (+1%) | 8mo | $220,000 | $192 | 71 |
| 94 Campbell Ave | 0.40mi | 3/1.0 (+1) | 1,120 (-1%) | 5mo | $252,350 | $225 | 68 |
| 5 Huxford Pl | 0.59mi | 3/1.5 (+1) | 1,170 (+3%) | 2mo | $230,000 | $197 | 60 |
| 5 Harts Hill Pkwy | 0.53mi | 3/1.0 (+1) | 1,100 (-3%) | 5mo | $260,000 | $236 | 59 |
| 125 Campbell Ave | 0.57mi | 2/1.0 | 1,174 (+4%) | 8mo | $183,200 | $156 | 58 |
| 10 Russell Ave | 0.54mi | 3/1.5 (+1) | 1,110 (-2%) | 10mo | $119,500 | $108 | 58 |
| 18 Trinity Ave | 0.73mi | 2/2.0 | 1,122 (-1%) | 11mo | $103,000 | $92 | 53 |
| 6 2nd St | 0.50mi | 3/2.0 (+1) | 1,163 (+3%) | 19mo | $136,100 | $117 | 50 |
| 19 Whitesboro St | 0.74mi | 2/1.0 | 1,183 (+4%) | 9mo | $166,500 | $141 | 48 |
| 55 Sauquoit St | 0.59mi | 3/1.5 (+1) | 1,069 (-6%) | 19mo | $135,000 | $126 | 42 |
| 2364 Douglas Ave | 0.56mi | 3/2.0 (+1) | 1,075 (-5%) | 20mo | $245,000 | $228 | 42 |
| 5 Oatley Ave | 0.61mi | 3/1.0 (+1) | 1,228 (+8%) | 11mo | $79,000 | $64 | 41 |
Match score weights: distance 35% · size 25% · config 20% · recency 20%. Top-matched comps best support the ARV.
Projected returns pro-forma
10.0% appreciation · 3.0% rent growth · sell at horizon
- IRR
- 20.1%
- Equity multiple
- 2.64×
- Total profit
- $136,932
- Equity at exit
- $269,363
- IRR
- 18.4%
- Equity multiple
- 6.06×
- Total profit
- $423,708
- Equity at exit
- $580,891
Cash invested: $83,720 (down + closing). Projections, not guarantees.
Landlord ↔ Tenant lean methodology
- Overall (STATE)
- 15 Strongly Tenant-Friendly
- State New York
- 15 Strongly Tenant-Friendly · D+10
- County
- — inherits STATE
- City
- — inherits STATE
ZIP-level market 13417
- Home prices YoY
- 11.9%
- Active inventory
- 10
- Price-to-rent
- 11.9×
Monthly cashflow live
- Estimated rent
- $2,100 medium interval (Pro) →
- Mortgage (P&I)
- −$1,568
- Tax est. 1.5%
- −$374 /mo · $4,485/yr
- Insurance
- −$125
- HOA
- −$0
- Vacancy / Maint / Mgmt
- −$441
- Net cashflow
- $-407
Break-even live
Sensitivity live
| Price | -10% $-201 | -5% $-304 | +0% $-407 | +5% $-511 | +10% $-614 |
|---|---|---|---|---|---|
| Rent | -10% $-573 | -5% $-490 | +0% $-407 | +5% $-324 | +10% $-241 |
| Rate | -1.0pp $-257 | -0.5pp $-331 | base $-407 | +0.5pp $-485 | +1.0pp $-564 |
UW: 25.0% down · 7.5% · 30yr · 1.5% tax · 5.0% vac · 8.0% maint · 8.0% mgmt
Financing live
Cash to close
- Down payment
- $74,750
- Closing costs
- $8,970
- Reserves months
- —
- Total cash needed
- —
Loan-product check · same deal, 3 products live
Conventional
25% down · 7.5% · 30yr
- Down + closing
- —
- Monthly P&I
- —
- Monthly cashflow
- —
- DSCR
- —
- Eligible?
- —
Personal DTI + credit; lowest rate.
DSCR
20% down · 8.5% · 30yr
- Down + closing
- —
- Monthly P&I
- —
- Monthly cashflow
- —
- DSCR
- —
- Eligible?
- —
No personal income docs; deal must DSCR.
Hard money
10% down · 12.0% · 12mo
- Down + closing
- —
- Monthly P&I
- —
- Monthly cashflow
- —
- DSCR
- —
- Eligible?
- —
Short-term bridge; refi at stabilization.
Rent comps 1 comps
| Address | Beds | Baths | Sqft | Rent | $/sqft | DOM | Units | Dist |
|---|---|---|---|---|---|---|---|---|
| 4 1st St Yorkville, NY | 3.0 | 1.0 | 888 | $2,100 | $2.36 | 45d | 1 | 0.59mi |
Listing history 5 events
-
2026-04-27status Pending
-
2026-04-20price $299,000
-
2026-04-20status Active
-
2026-03-17status Pending
-
2025-12-17$324,900 Active
ⓘ Source: listings_history table (triggers on properties + properties_extension) + one-shot
backfill from property_details.listing_events for pre-trigger history.
Nearby sold comps map
Loading sold comps map…
Walkable amenities ~0.75 mi
Loading nearby amenities…
Taxation est. · year 1
- Rental income
- $25,200
- − Mortgage interest
- −$16,749
- − Property taxes
- −$4,485
- − Insurance
- −$1,495
- − Repairs & maintenance
- −$2,016
- − Management
- −$2,016
- − Depreciation
- −$8,698
- Taxable loss
- −$10,259
- Est. tax savings @ 24.0%
- +$2,462
- After-tax cash flow
- $-2,426/yr
For passive investors: Depreciation is non-cash, so a rental often shows a tax loss while cash-flowing — sheltering income. Rental losses are passive: they offset passive income freely, and up to $25,000/yr can offset ordinary (W-2) income if you actively participate and your MAGI is under $100k (phasing out to $0 by $150k); unused losses carry forward. On sale, claimed depreciation is recaptured at up to 25%, and gains may owe capital-gains tax (a 1031 exchange can defer both). Figures are a year-1 estimate at your 24.0% rate — not tax advice; consult a CPA.
Schools (NCES district)
- District
- New York Mills Union Free School District
- NCES district ID
- 3620610
- Math proficiency
- 60% ▲ 5.00%
- Reading proficiency
- 65% ▲ 13.00%
- Median HH income
- $40,329
- Composite
- 52.21/100
- National rank
- #1605
- State rank
- #224 of 590 in NY
Livability — New York Mills
- Score
- 78/100
- State rank
- #175
- US rank
- #2712
Category grades
Schools grade is shown separately in the Schools card above.
Census & demographics
- Census place
- New York Mills, NY
- City population
- 3,012
- Population (ZIP)
- 3,012
Population outlook (Oneida County) Hauer SSP2
- Today (2025)
- 225,223 people
- By 2030
- 220,384 · -2.1%
- By 2040
- 209,071 · -7.2%
- By 2050
- 197,920 · -12.1%
- By 2075
- 175,541 · -22.1%
- By 2100
- 148,491 · -34.1%
Race, ethnicity, and origin ACS 2023
- Neighborhood character
- Predominantly White (99%)
- Race & ethnicity
- White 99% Asian 1%
- Common ancestry
- Romanian 21% Lithuanian 4% Serbian 2%
- Foreign-born
- 2%
- Languages at home
- 94% English-only · Russian/Polish/Slavic 4% Vietnamese 1% Other Indo-European 1%
Political lean MEDSL · Oneida
- 2024 margin
- Strong R (+21.3) · D 39.4% · R 60.6%
- 2008→2024 swing
- -15.2pp toward R · 2008: -6.1pp · 2024: -21.3pp
- All cycles
- 2024: R+21.3 2020: R+15.5 2016: R+21.1 2012: R+5.3 2008: R+6.1
Not yet ingested
- Civics
- —
Market trends
- HPI YoY
- ▲ 31.74%
- Current HPI
- 298.823
- Rent YoY
- —
- Metro
- —
- State GDP YoY
- ▲ 2.60%
- F500 in state
- 92
Industry mix (Fortune 500 HQ in NY)
| Industry | F500 HQs | Revenue |
|---|---|---|
| Financial Services | 10 | $950B |
|
||
| Consumer Goods | 9 | $162B |
|
||
| Insurance | 4 | $225B |
|
||
| Telecommunications | 2 | $144B |
|
||
| Pharmaceuticals | 2 | $112B |
|
||
| Media / Entertainment | 2 | $69B |
|
||
Price history
-8.0% since first listed5 events — show timeline
- 2026-04-27 Pending — CNYIS
- 2026-04-20 Price Changed $299,000 CNYIS
- 2026-04-20 Relisted — CNYIS
- 2026-03-17 Pending — CNYIS
- 2025-12-17 Listed $324,900 CNYIS
Cash-flow waterfall
monthlySold comps — $/sqft
last 12 mo · ≤1 miLoading sold comps…